
I am a big advocate of data-backed content marketing and insist on writing data-backed posts, because crunched data shows promising patterns that your website visitors or social media followers might follow.
So, is there no place for human intuition in businesses? Can machine-based algorithms and tools give the complete picture for lifting your business sales?
The intuition vs. data debate has been a recurring one for years. MIT researchers have even found an algorithm that trumps human intuition. That doesn’t mean an end of the debate in favor of machines though – only humans move from observing and analyzing data to taking decisions and action on it. Machines don’t, at least not yet.
Skepticism and critical thinking are the human traits that are as important as data for running a successful marketing campaign and growing your business. Data enhances your decision making and keeps you better-informed.
There are certain fallacies, though, that marketers fall for when analyzing data from their campaigns. In this article, I want to present you five limitations of data and how you can overcome them in your marketing.
Most of the available and visible data is of the glorified winners and that’s where this bias kicks in…
Have you ever glorified students that drop out of college, citing the shiny examples of Bill Gates and Mark Zuckerberg?
Sure you’re optimistic. But, do you know that the majority of America’s 30 million college dropouts are more likely than graduates to be unemployed, poor and in default with their debtors?
I don’t doubt your intentions. They are pure, but I’m sure that you’ve fallen for this mistake of – focusing solely on the winners and falling for the survivorship bias.

Media broadcasts these survivors as they sneak a peek into their secret mantra of success. The information on “what should be avoided” is usually ignored, because it isn’t available with the people that make it to the cover of business magazines.
Rather, the real lessons on what not to do lie with the people that failed and couldn’t get out of bad situations. But, your opinion has been skewed by a few survivors that have gained tremendous visibility.
This bias can set into your marketing campaigns, when you implement a traffic or SEO strategy that got tremendous results for an influencer/competitor.
For example, you must have heard of the Skyscraper technique. It has helped numerous webmasters in increasing their organic traffic and gaining juicy backlinks.
Since you need to craft extremely high-quality content to outdo your competitors, your budget and time required for execution is considerably high. Yet most small business owners never question the strategy’s effectiveness before implementing it on their blogs.
It’s rather a well-known fact that a marketing strategy loses its impact, once a key influencer shares it. Infographics weren’t as effective after I rigorously used them. The email templates I share are misused and rendered ineffective by some lazy marketers.
Doug Cunnington shared his failure with achieving results from the Skyscraper technique. He didn’t get those “great resource, here’s a backlink” emails.
So, how can you ensure that you don’t fall for this bias?
If data on a marketing strategy looks too good to be true, then double check the conditions where it worked.
Aspects such as the niche, budget, time required and other pivotal factors that contributed to the success of the strategy need to be scrutinized.
Infographics don’t work just because they are infographics (you’ve to ensure that there is demand for them and that you can promote it to the right people). And, just using the golden ratio won’t make you a stunning designer.

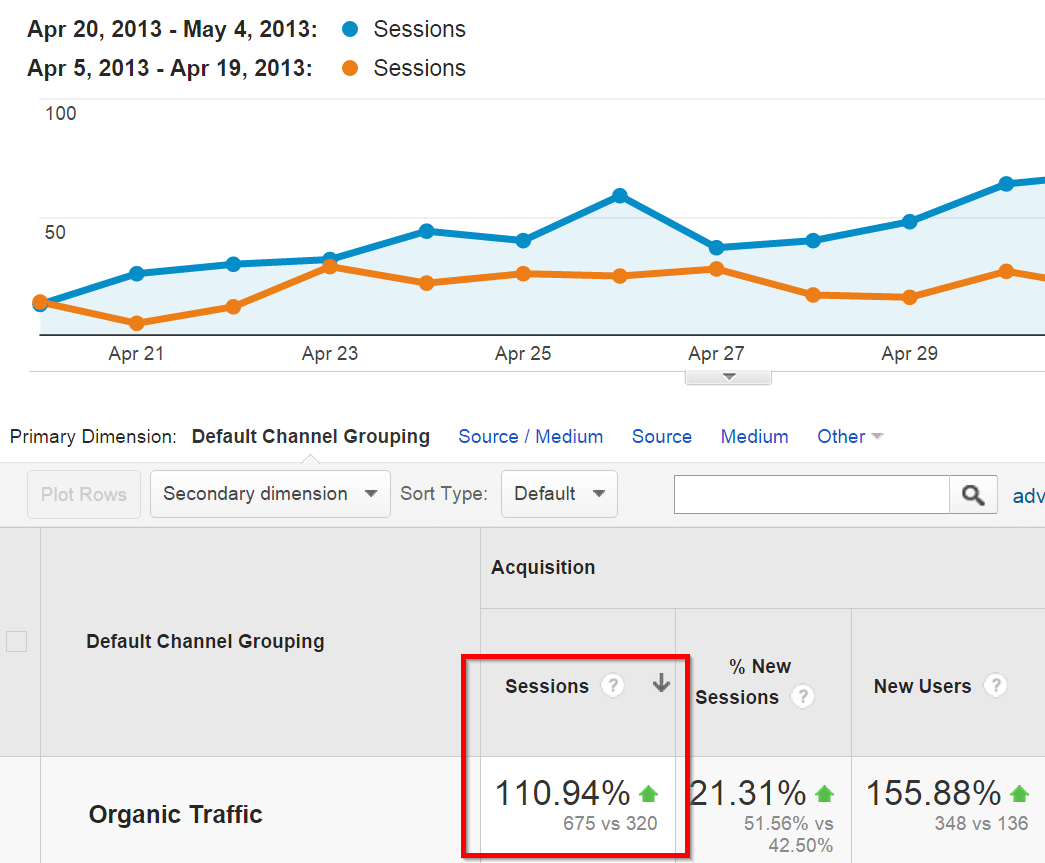
Brian Dean, himself, mentions that the Skyscraper technique might not work effectively in some niches and in certain conditions.
![]()
Sometimes, you’ll find success by putting in a little extra creative effort. For Doug, mixing the Skyscraper technique with guest posting (he had to get 8 guest posts published) gave brilliant results.
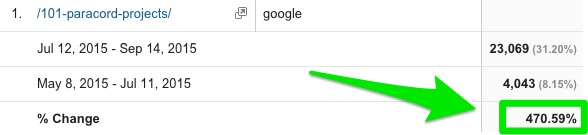
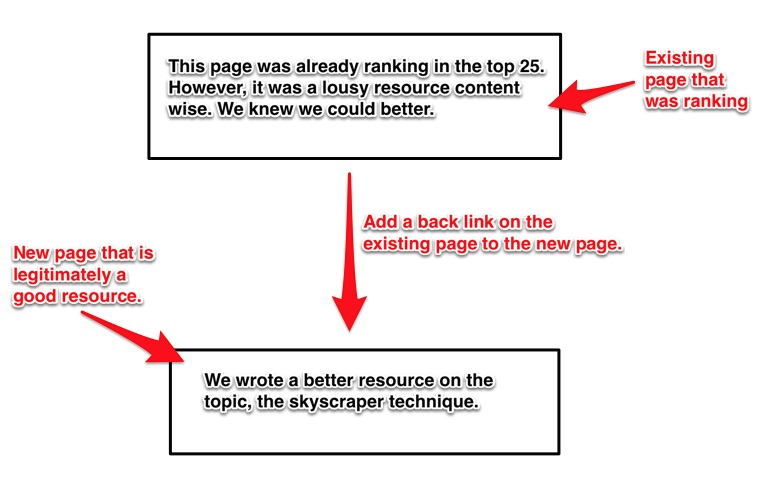
He also did internal linking from an existing page (that Google had liked) to the Skyscraped version on the same subject.
Fundamentals remain the same: Creativity and curiosity will help you in making better, faster, more efficient and effective decisions
Do you know that over 2.7 zettabytes of data exist in the digital universe today?
But, most of the data (around 60 to 70 percent at least) that’s been produced doesn’t exist in the traditional row and column format. It’s…
Unstructured.
Now, who do you think would play a better role at understanding the customer patterns?
Your CRM tool will most likely contain pre-defined fields that impose a structure on a customer’s data points.
You might get access to advanced software tools that aggregate data from multiple sources and standardize it. Then, an analysis can be performed for uncovering insights.
A quicker and smarter way than such an automated process is you, a human, observing trends. You might even need to first actually decide on the questions worth pursuing in a data set.
Creativity in observing and deriving insights from data is essential. Humans can quickly correlate their business decisions with revenue numbers.
For example, measuring the ROI from your content marketing efforts and tying content to your sales funnel is a huge challenge. You’ll need to factor out vanity metrics, like traffic and reach with concrete numbers.
Contently has been working on an ROI formula that can be applied across an entire organization, taking dozens of inputs into account,including how share of voice affects a brand’s bottom line. They share a case study of how they managed a 15.5x content ROI here.
You’ll notice that Contently did use tools to tag a prospective client and find out the articles and pages he read on their website and how he moved through their funnel.
But, their sales team and their creativity observed that the unstructured data played a bigger role in closing an $82,000 contract with the client.
Similar is the case with David Mcsweeney. His curiosity led him to discover that journalists are always looking for trending news. And, there is a flavor for every month (like spiders for August).

So, he capitalized on the success of the ‘The Health Effects of Coca Cola’ infographic to create one on Scotland’s ‘other national drink’ – Irn Bru, for his website Favrify.
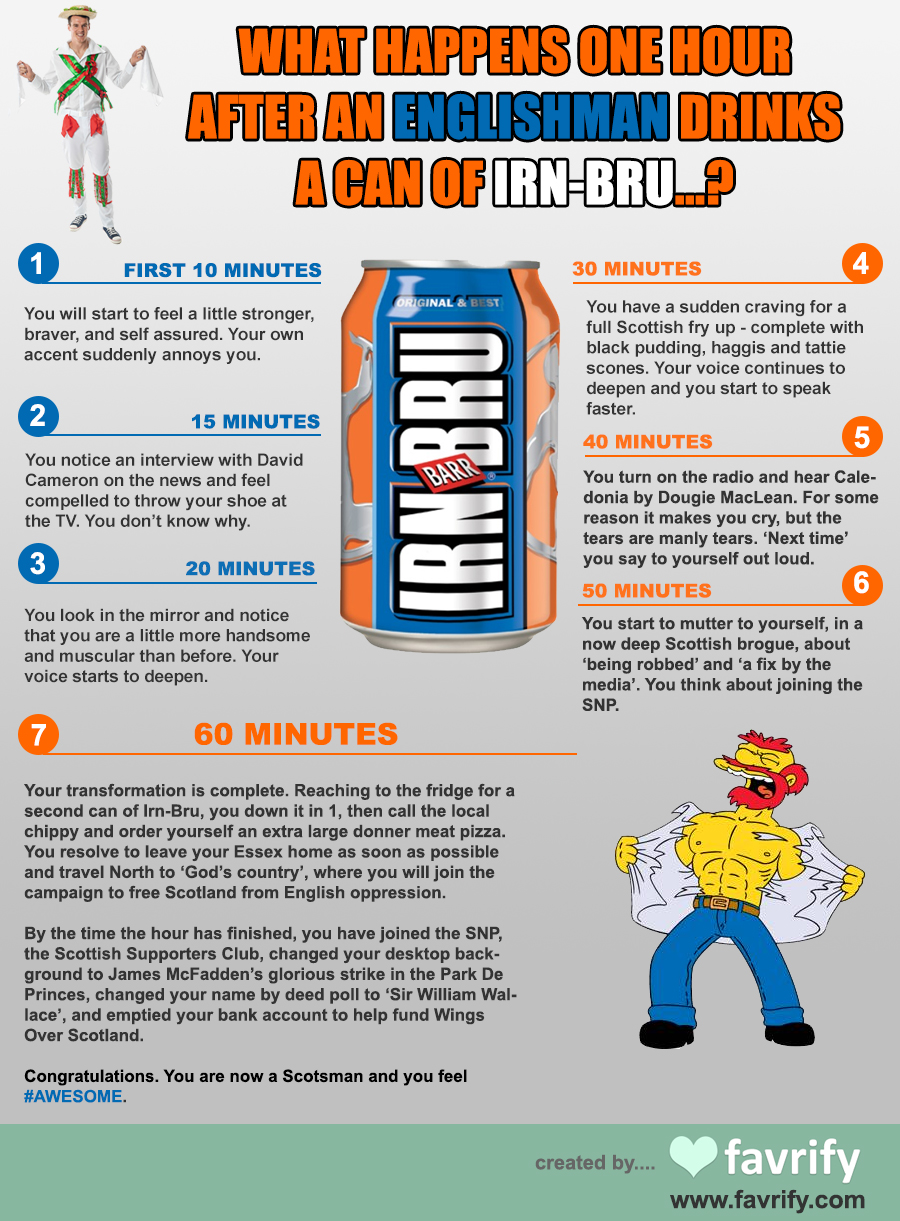
The result was over 100,000 visitors within 48 hours and numerous press mentions.
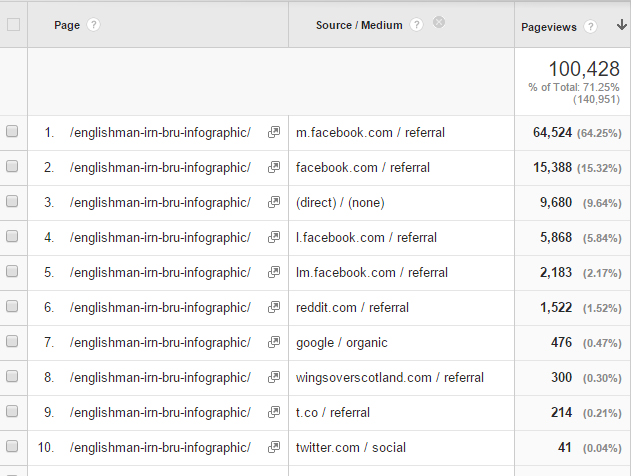
I don’t think David’s creativity and curiosity could be substituted purely with data.
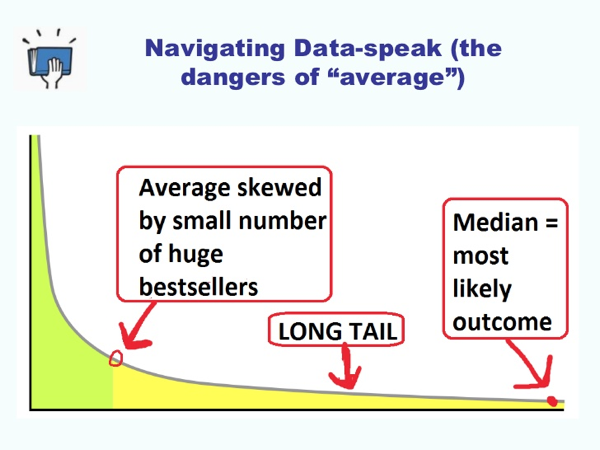
Averages and rounding-off can trick you to drive wrong insights
Have you ever experienced a sales spike during winter holidays? Or, have you felt a dip in traffic during the summer months?
If you only rely on an annual overview (or monthly overview) from your analytics software, then you might not get the complete picture. Let me show you 4 ways in which data might get skewed, leading you to draw wrong insights.
1. Mark Coker plots the data on eBook sales at Smashwords. As an author, you might get fooled into believing that you have higher chances of publishing a best-selling eBook.
2. If you’re using a tool to mine the “number of comments” your brand receives after launching a product or publishing a blog post:
Then you aren’t aware of the sentiment around the conversations.
For example, Adidas drew a huge number of comments on their pro-gay post on Valentine’s day.

If you don’t zoom inside, you wouldn’t find that there were actually many angry comments.
The Adidas social media team proactively responded to all comments with a big emoji kiss.
3. When you conduct keyword research, you’ll likely rely on the monthly search volume for determining if a keyword is worth pursuing.
But, do you know that the keyword search volume is the average of last 12 months?
So, you should ideally also zoom into the monthly searches to find out the keywords that have been gaining prominence,
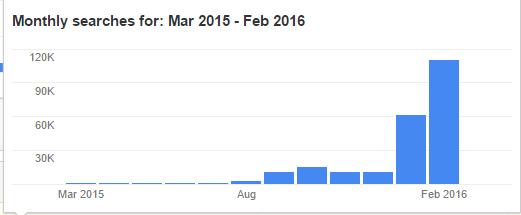
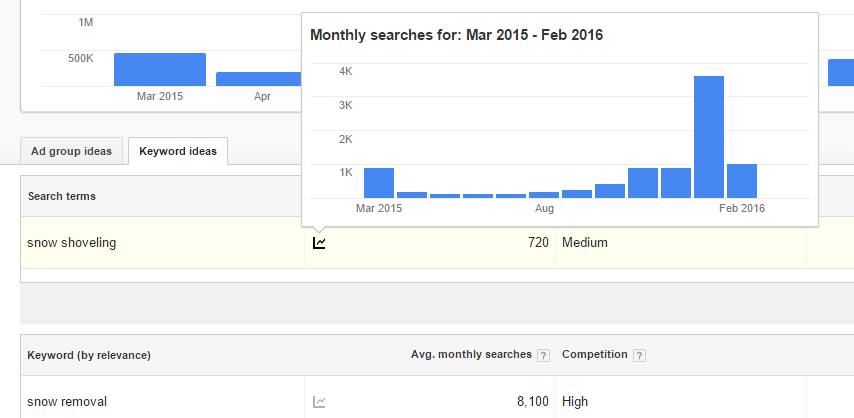
or, the ones, like ‘snow shoveling’ that have seasonal spikes.
This insight will be helpful in deciding if the keyword ranking spot on the first page for just 3 seasonal months will help in generating a good ROI for your business.
I would recommend opting for the evergreen keywords that get consistent searches all the year round.
4. Another aspect of the Keyword Planner is being aware that averages aren’t exactly true numbers.
See, Google groups the keywords into buckets, on the basis of their volumes. And, sometimes the closest bucket for a keyword isn’t rounded to the nearest 10, but rather 100.
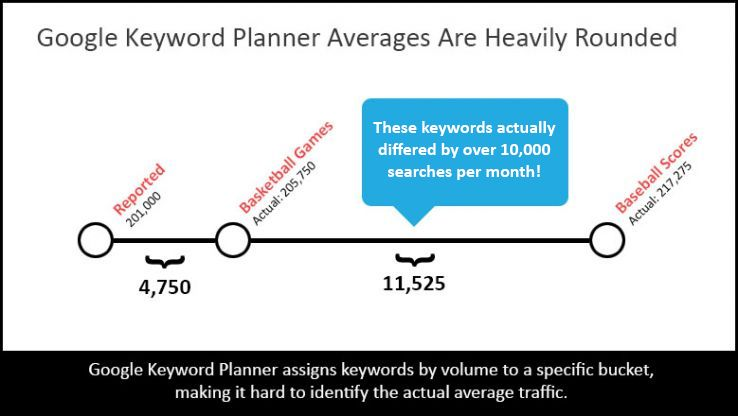
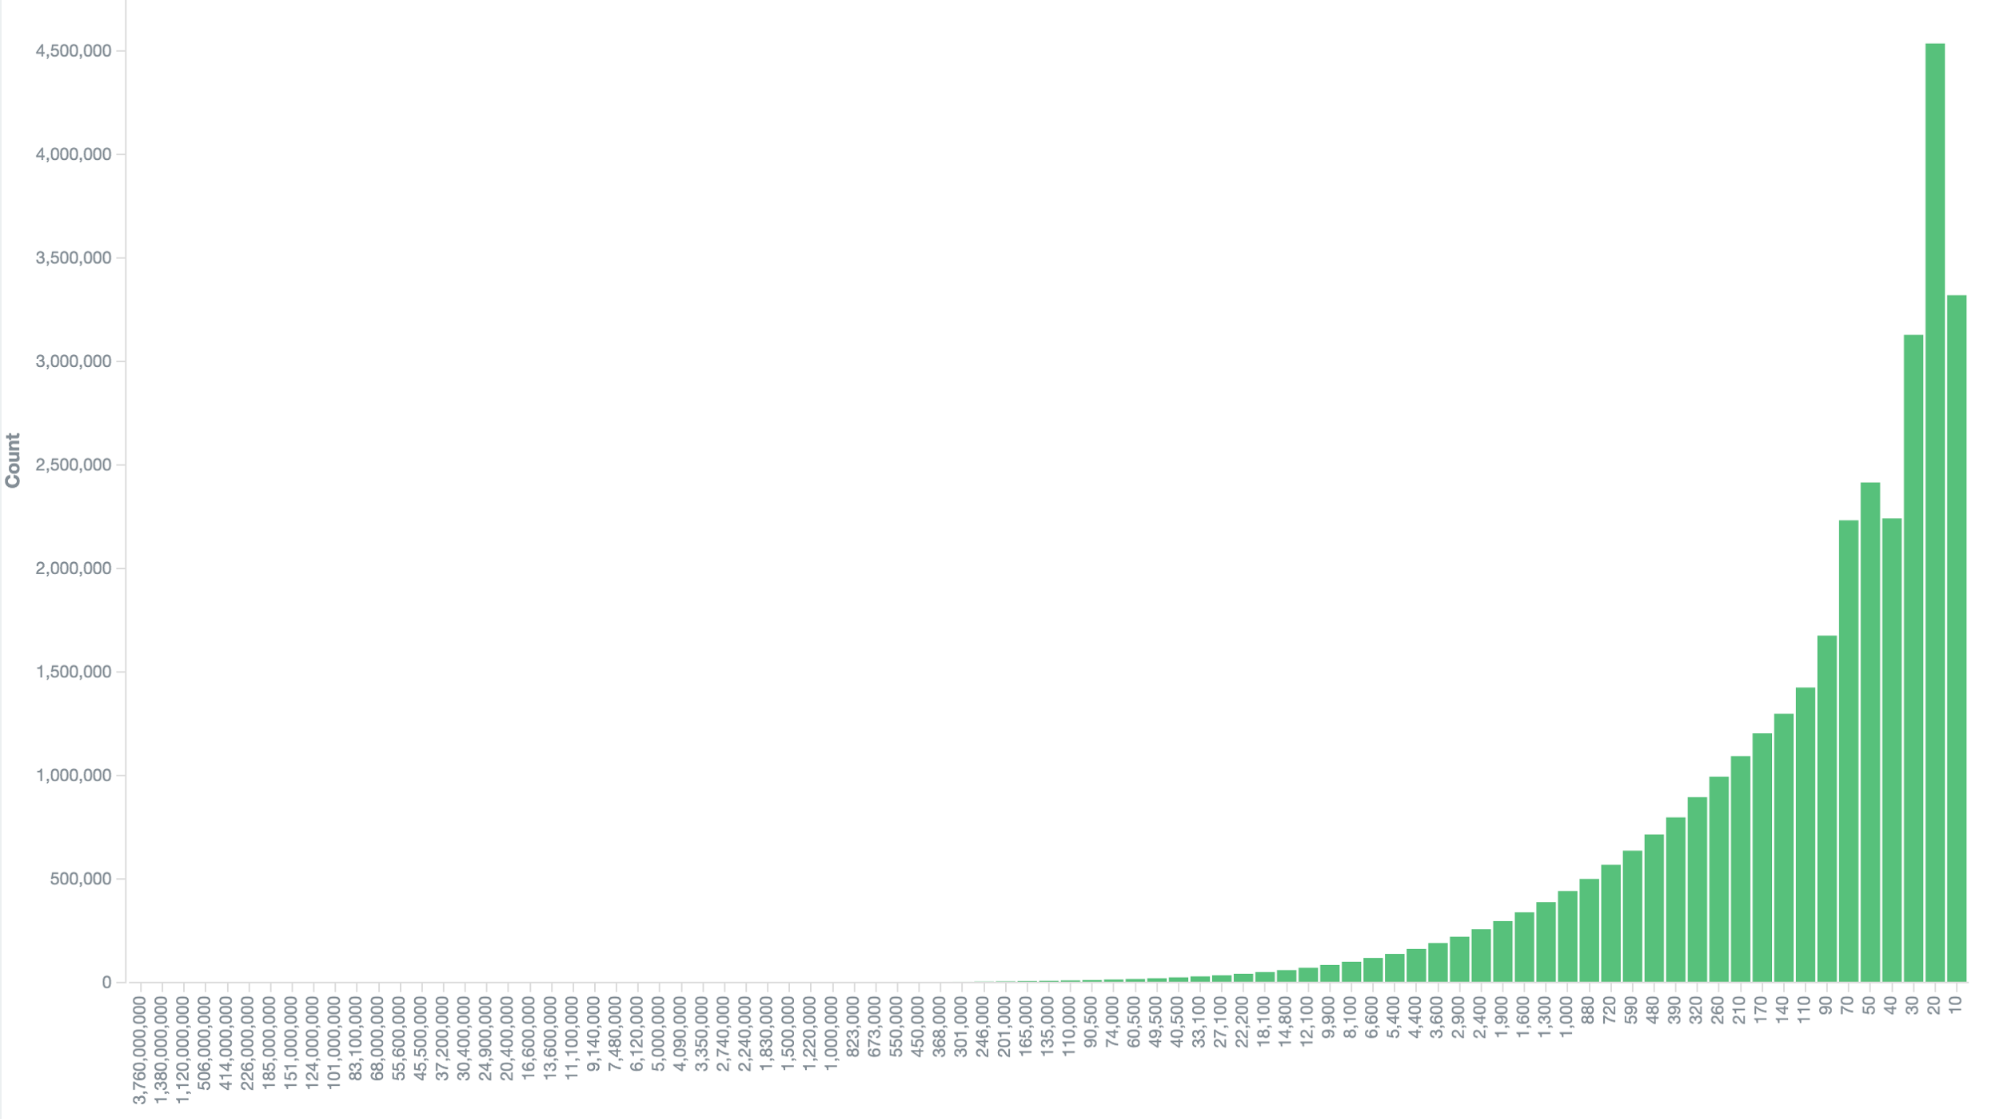
The Keyword.io team did an analysis of 57 billion search terms and they found that the difference in bucket sizes quickly increases (720 > 880 > 1,000 > 1,300 > 1,600).
I would love to share a solution to the problem, but it doesn’t exist. The only way that you can mitigate the risk is by focusing on the keywords that give you results. Dig into your Google Analytics and Webmaster tools and find them. And, diversify your traffic sources to move beyond Google.
Higher conversions in an A/B test might attract the wrong kind of audience for your business
There are numerous simple tests that you can run today to increase the number of email opt-ins and the sales you make. While I recommend that you try these tests, always try to discern the hidden insights beyond a pure percentage increase in conversions.
You’ll have to think about how your decisions affect the business at a higher level. For example, using emojis can increase the engagement on your social media updates. But, does it suit your brand personality and attract members from your target audience?
Let me show you another real-world example. Ramit Sethi from iWillTeachYouToBeRich.com ran an A/B test that compared high price vs. low price for their product. His team found that setting a lower price would generate an additional hundred thousand dollars in revenue.
So, did Ramit go with a lower price?
Nope.
He was ready to lose a few dollars, because a lower priced product would attract the wrong kind of audience.
In Ramit’s own words,
Tests are terrific. Data is critical. But, the CEO ultimately sets the vision and makes the call.
The fact is that 90% of A/B tests might not produce any significant result. In the same vein, not every positive test will result in additional revenue. The case studies you see in blog posts (mine included) belong to the 10% that are success stories.
So, when split testing, always be ready to grind to get considerable improvements in revenue. I’ve also shared how chasing irrelevant keywords will attract the wrong kind of audience and how fixing your keyword targeting will help.
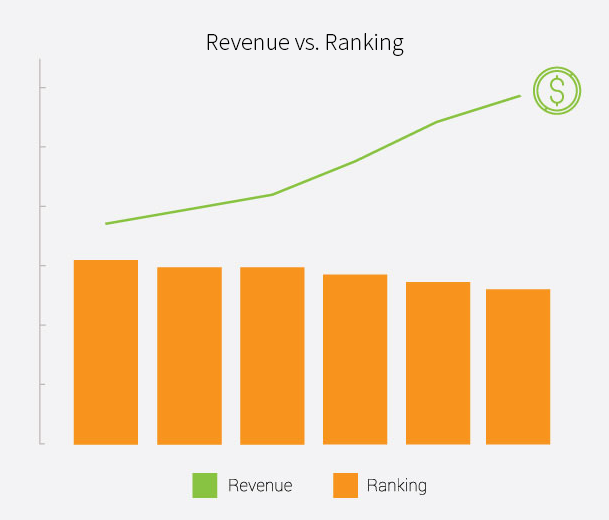
Previously, I’ve also shared how sometimes (when checking user intent) even losing your SEO rankings can improve your revenue.
Data fails to answer this most basic question…
So, what kind of insights can data from analytics tools reveal?
The what, when and where, in most cases.
You don’t get qualitative insights into the motivations of your customer that lead to purchases.
The Why…
For marketers, this is an incredibly valuable insight that can prevent them from chasing the wrong activities.
For example, most keyword tools offer you a keyword volume and the competition analysis of the websites ranking in search results. They show you backlinks, domain authority, page authority and the like.
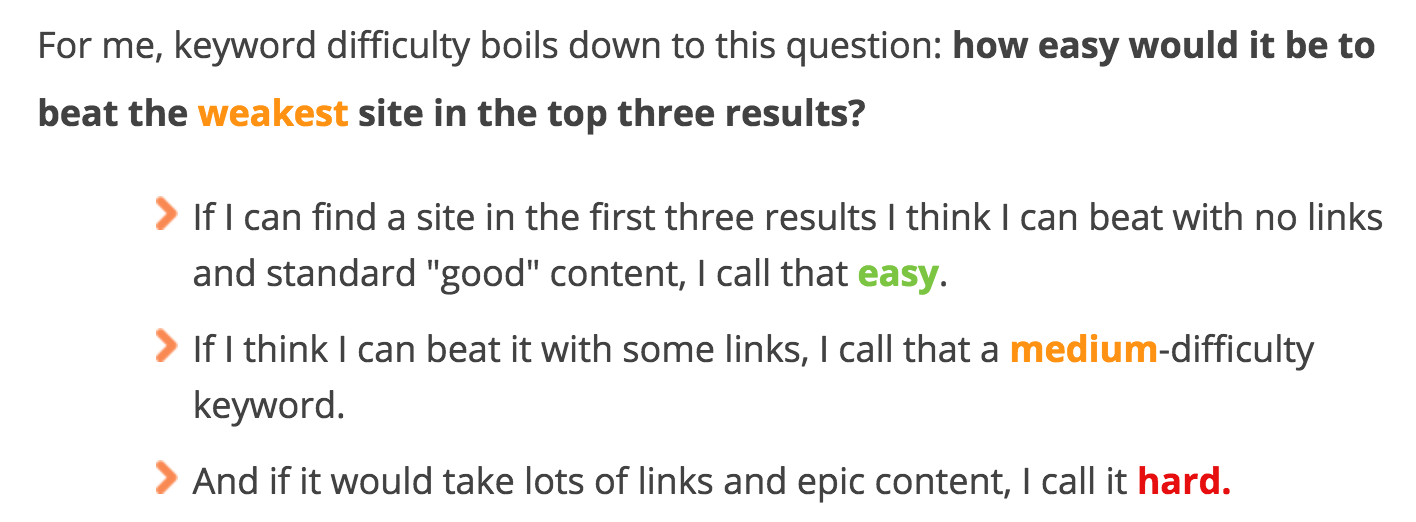
Now, most tools have also devised an algorithm to show a keyword competition score. But, it’s difficult to list competition as easy, medium and difficult.

So, even with a score in the range of 0-100, it’s still your responsibility to uncover why a keyword is ranking. Perrin, from Authority Hacker, devised the following criteria for judging a keyword’s difficulty.
Similarly you will probably have a lot of difficulty ranking for keywords associated with a brand or a tool like “Google Keyword Planner”.
You might also find that Google prefers a certain type of website for some specific keywords. And, your keyword research tool won’t give you insight for the critical why of their ranking.
For example, look at the results for ‘shirts for female’. All of the results shown are from an eCommerce websites – so good luck ranking for it with a content website.

Similarly you might find search results dominated by a few websites, when searching for hotels, travelling tips, jobs, etc. Hayden, from Nohat Digital, discusses this monopoly in search results here.
Conclusion
Data is an incredible asset for marketers. I regularly write data-backed posts to support my arguments. 50% of marketers surveyed expressed a desire to measure the attention people are paying towards their content.
But, relying on data, automated tools and algorithms alone can lead to many pitfalls. I showed you five examples in this article. I would say that marrying data with your intuition is a better solution for driving more revenue.
I would love to hear your experiences with data-backed marketing. Have you experienced a failure in your marketing campaigns due to sole reliance on data?
Comments (14)