
Do you know what question I get asked almost more than any other question?
It’s this one: “How do I get more traffic?”
People ask me this every single day.
I’ve learned that most people think getting traffic is pretty much a pipe dream. They think it will take month after month of hustling.
So it often surprises people when I tell them that they already have what they need to get a lot more traffic.
You have the ability right now, and it’s completely free.
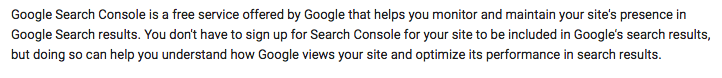
It’s Google Search Console, also called GSC for short.
It used to be called Google Webmaster Tools, so if you remember using that, you’ll find GSC familiar.
This mega-powerful tool is one of Google’s gems. It’s not as popular as Google Analytics, but it packs a punch.
One of GSC’s tools is called Search Analytics, and you can use it to drive more traffic to your site. One of my clients increased their traffic by 28% just by using this free tool.
I’m going to break it down step by step, so even if you’ve never used Google Search Console before, you can pick it up just by reading this article.
What is Google Search Console?
GSC is a hub for all things related to your site.
It allows you to tweak everything from structured data to spam issues and everything in between.
It’s a must-have tool for any site owner, but it’s often overlooked.
That’s a shame because GSC can deliver some amazing results when used correctly.
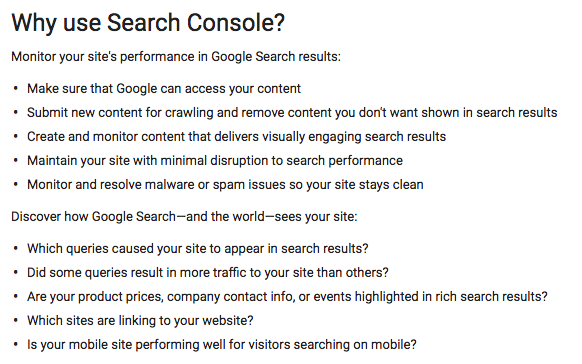
Here are just a few of the benefits of using GSC:
It’s one of the most comprehensive free website resources out there.
In fact, it rivals many paid tools on the market. It’s not a replacement for all of them, but it’s an outstanding supplement to be used alongside other tools.
You’re probably wondering how an analysis tool like GSC will help you get more traffic.
I’ll explain this in detail as we go on, but basically, you’re going to use info from GSC to modify your content and your website strategies (e.g., marketing, SEO, advertising).
GSC is actually a suite of tools, and they’re all insanely helpful.
But for the purpose of driving traffic, we’re going to focus on the Search Analytics tool.
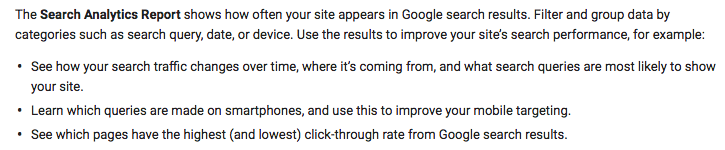
Search Analytics shows you all the information about exactly how your site appears in the SERPs.
Here’s what you can do with it:
Don’t worry, we’re going to unpack all of this. But already you can see why this is such a useful tool.
It allows you to laser focus on your traffic and analyzes how much you’re getting and why you’re getting it.
Getting data from Search Analytics
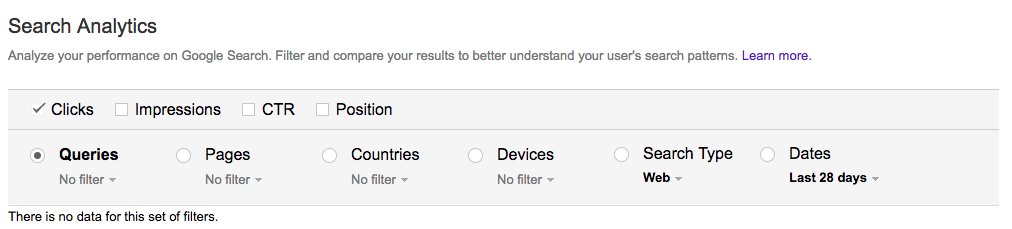
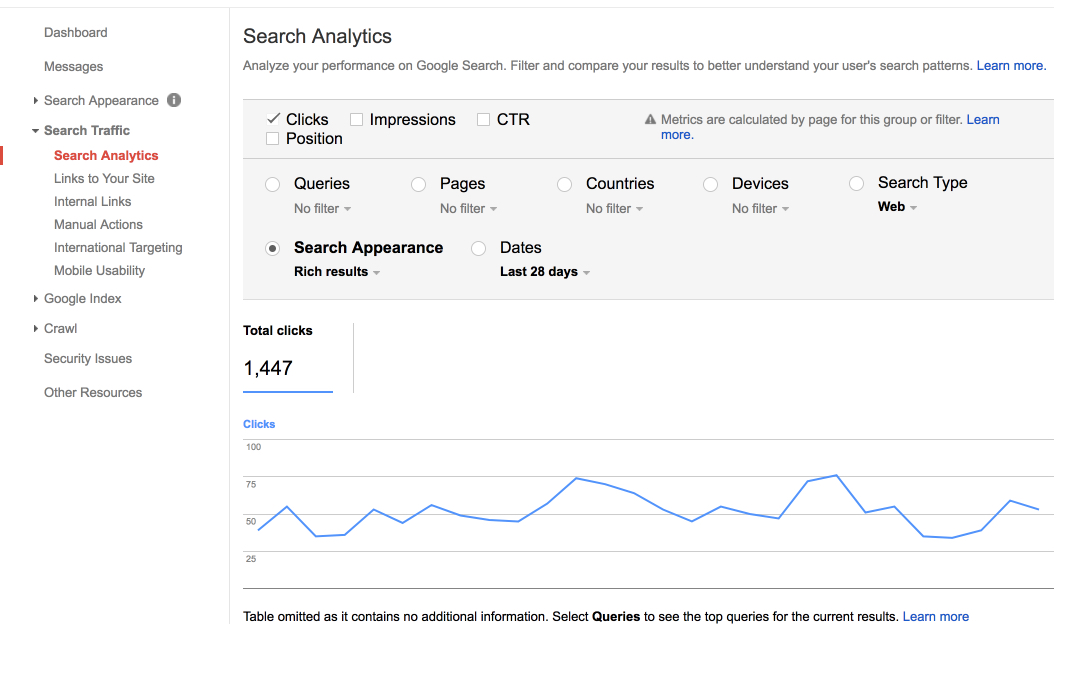
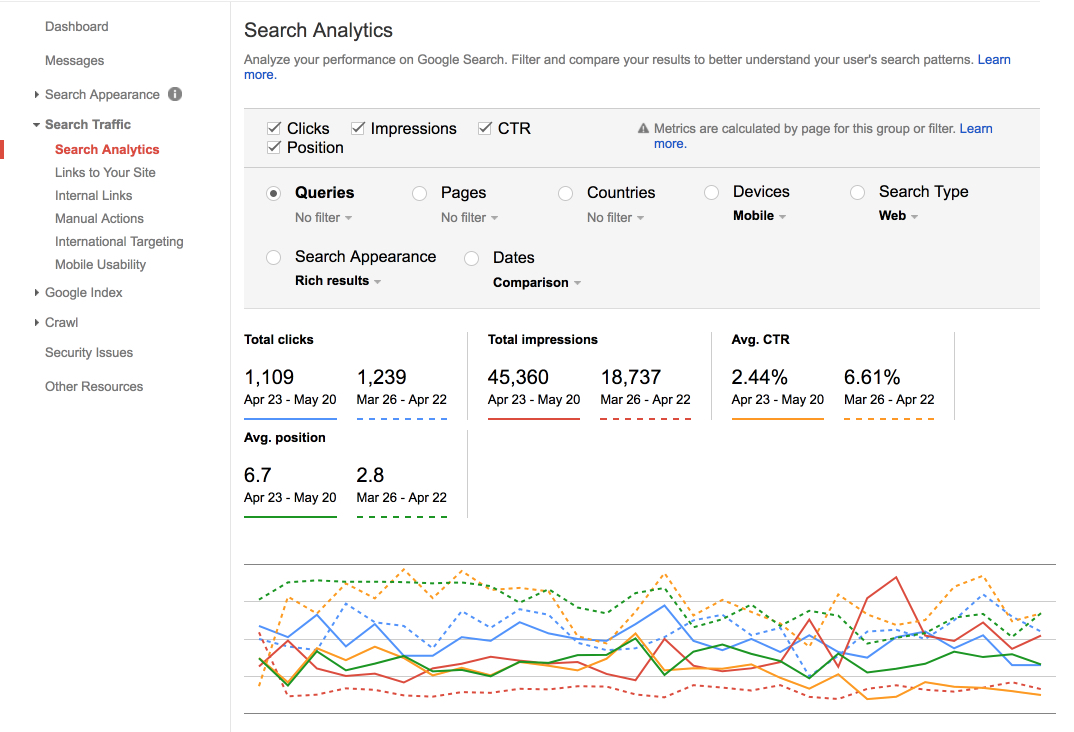
Let’s take a look at the Search Analytics interface.

The top row gives you options to apply different filters to your reports.

Here’s what each of them does:
The Clicks filter shows you how many clicks you’ve gotten from the SERPs.
The Impressions filter shows you how many SERP results people have seen. Google counts these impressions differently based on certain factors, but that’s really all you need to know.
The CTR (click-through rate) is probably a metric you’re familiar with. Google has a standardized formula for this: the click count divided by the impression count.
The Position filter gives you the average position of the topmost result of your site.
Altogether, these four filters give you a wide range of results.
The options in the next box allow you to refine your results further. These are grouping options that categorize the data for you.

I’ll briefly go over each of them.
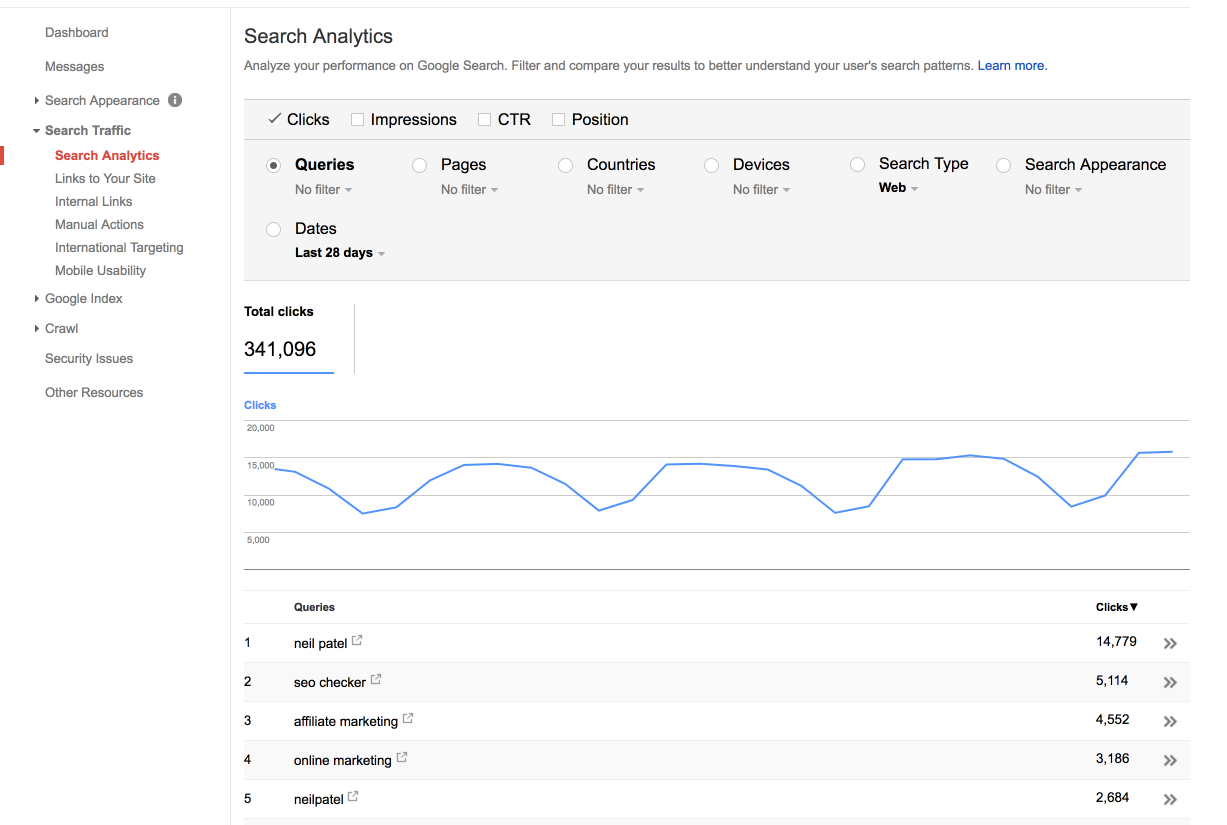
The Queries option returns a list of search terms that drove users to your site.
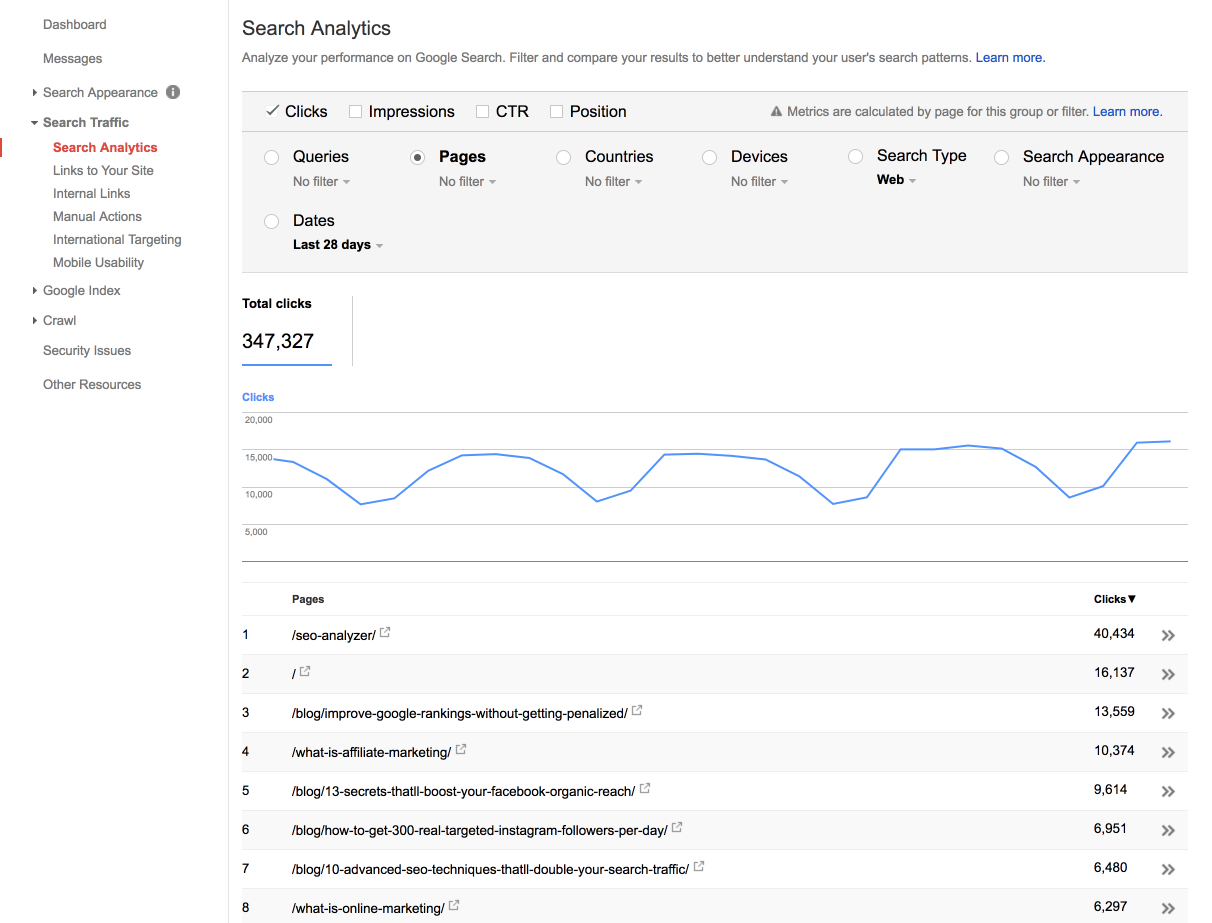
The Page option shows you which pages on your site appeared in search results.
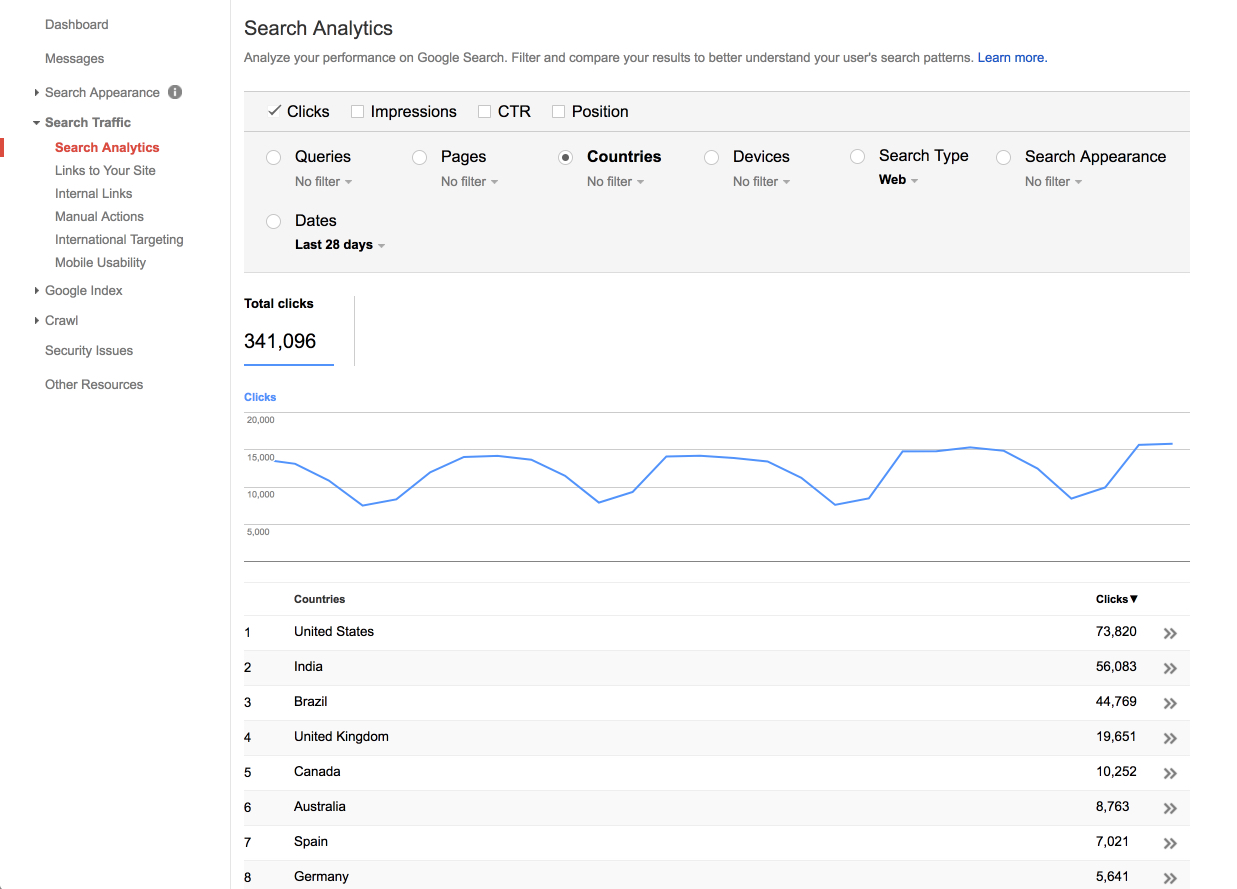
The Country option shows you where all of these searches came from.
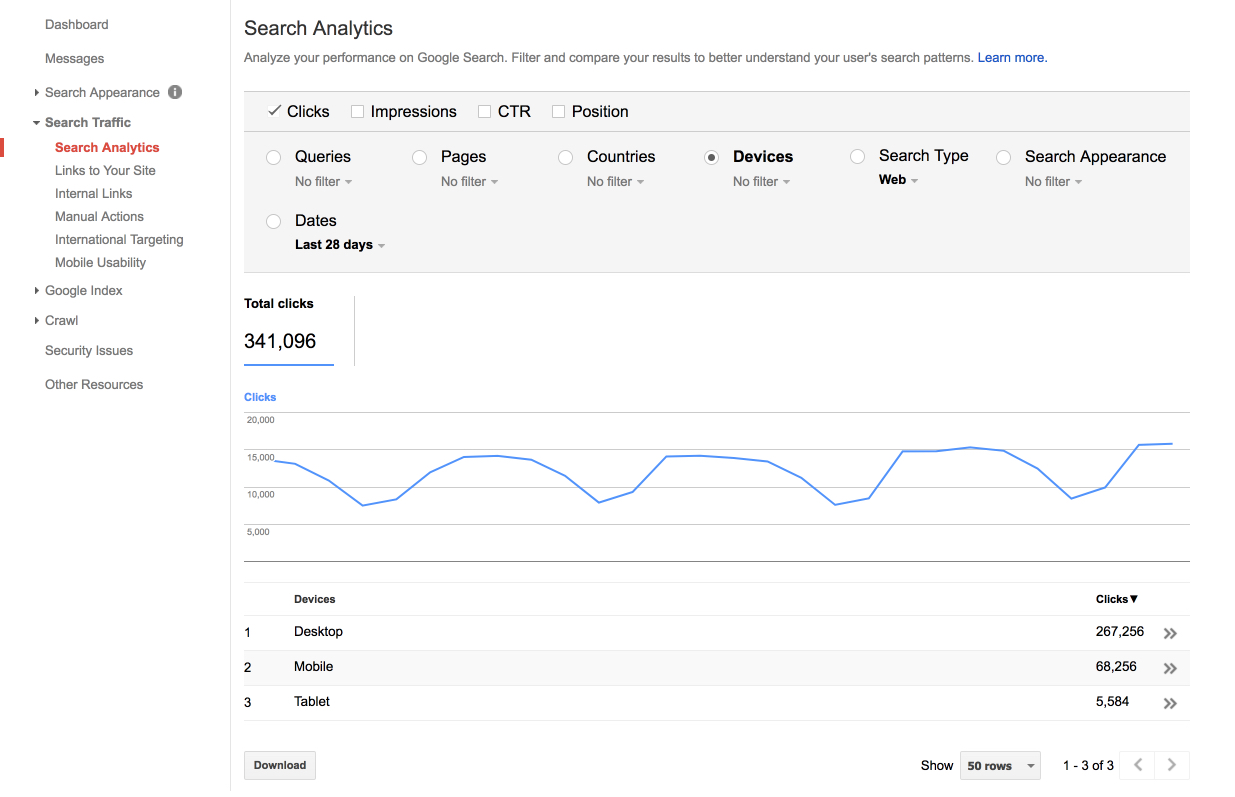
The Device option shows you which devices were used to search.
The Search Type option shows you if users used web search, video search, image search, or another type.
The Search Appearance option lets you use special filters. You might not always see this option since it requires you to have impressions for at least one of the other features.
Finally, the Date option lets you choose the timeframe.
Each option has a time and a place. I’ll walk you through each of them.
Optimize results that don’t get clicks
This is one of my favorite features in GSC.
The idea here is to look for keywords with lots of impressions but few clicks and a low CTR.
These are keywords that tons of people are seeing, but they’re not actually visiting your site.
Since these keywords have high visibility, you can work on improving your SERP presence so more of those people click through to your site.
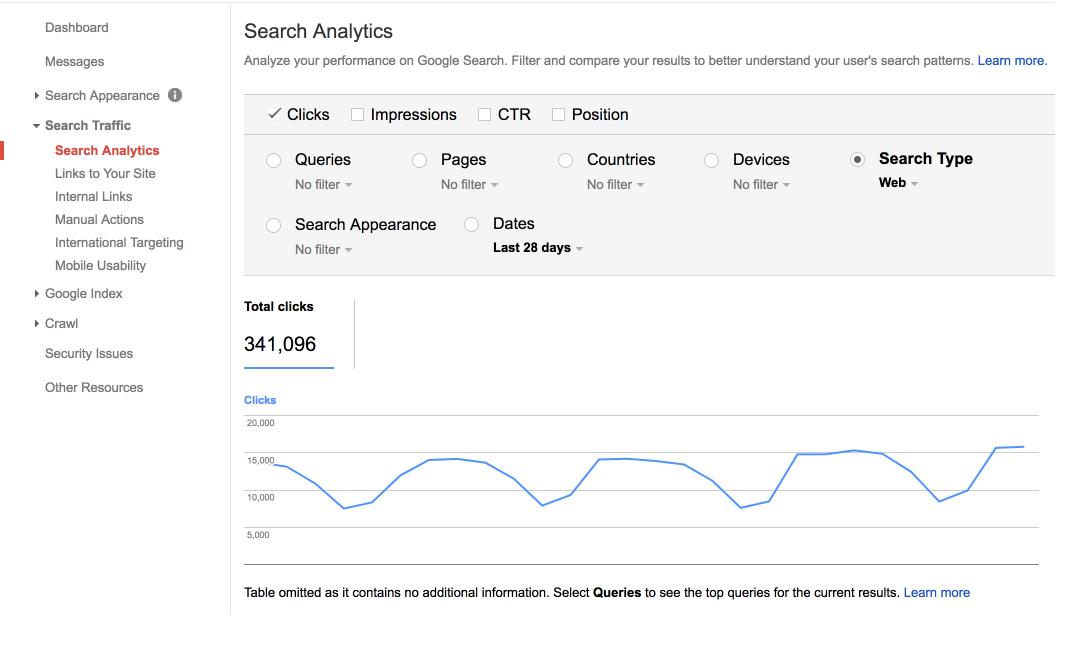
First, you have to run a simple report.
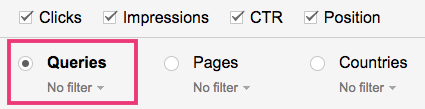
Start by clicking all four filters: Clicks, Impressions, CTR, and Position. (You don’t technically need the Position filter, but it’s nice to know.)

Next, select the Queries option.
Below the graph, you should see a list of keywords.
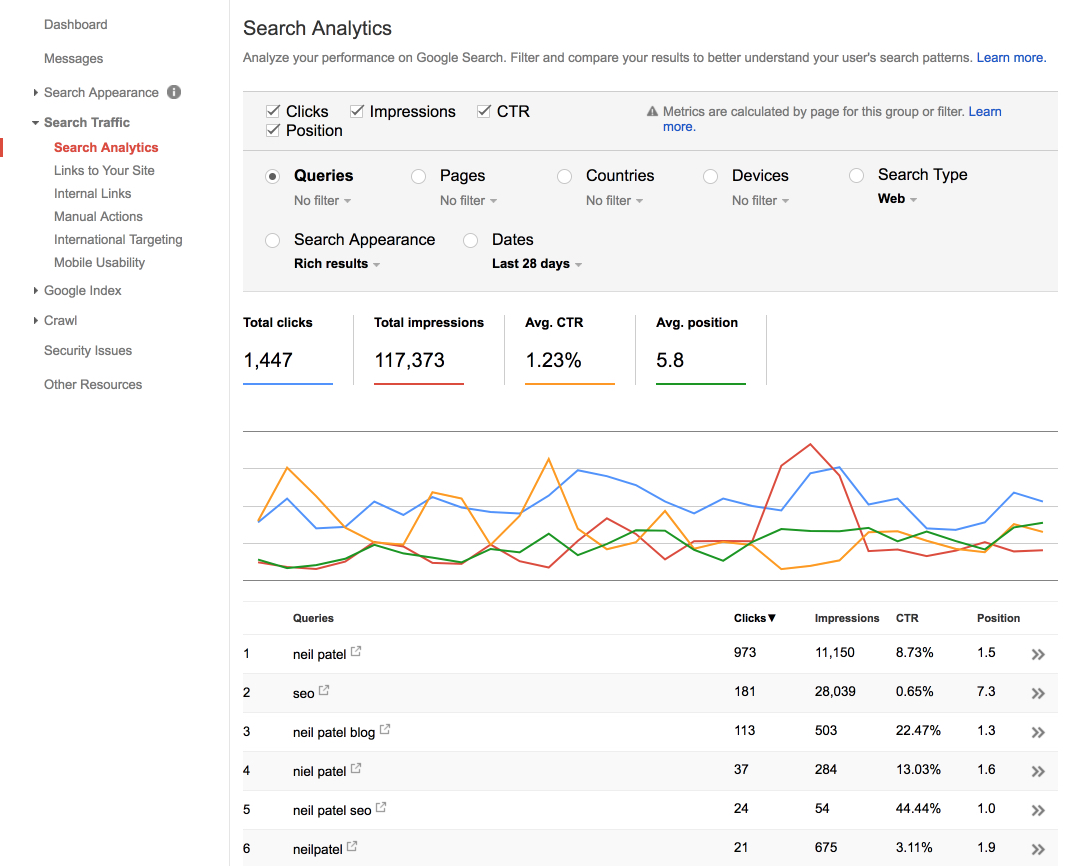
Those four filters you applied are available for each keyword:
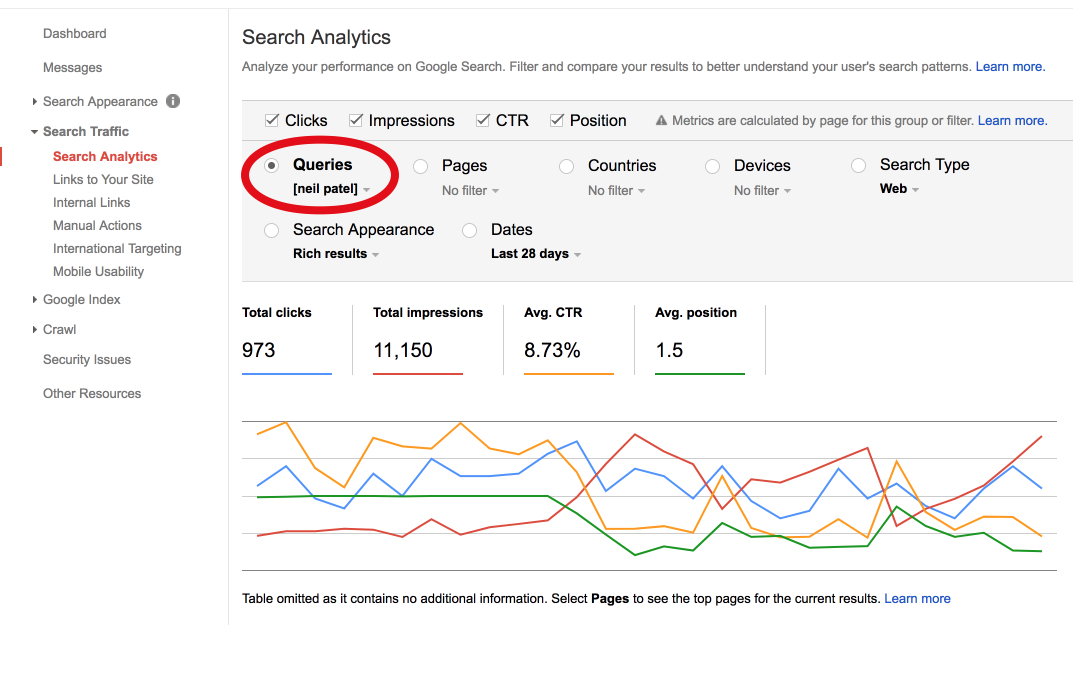
This will give you a great idea of how each keyword is performing with a high amount of detail.
Remember, you’re looking for keywords that have a high impression count, a low CTR, and a low number of clicks.
Try to find 5-10 keywords that meet these criteria. I suggest recording these in a spreadsheet.
At this point, I like running a search of my own.
You can just open Google in a new tab or window, or you can even use an incognito window in Google Chrome or change your IP address so Google gives more general results.
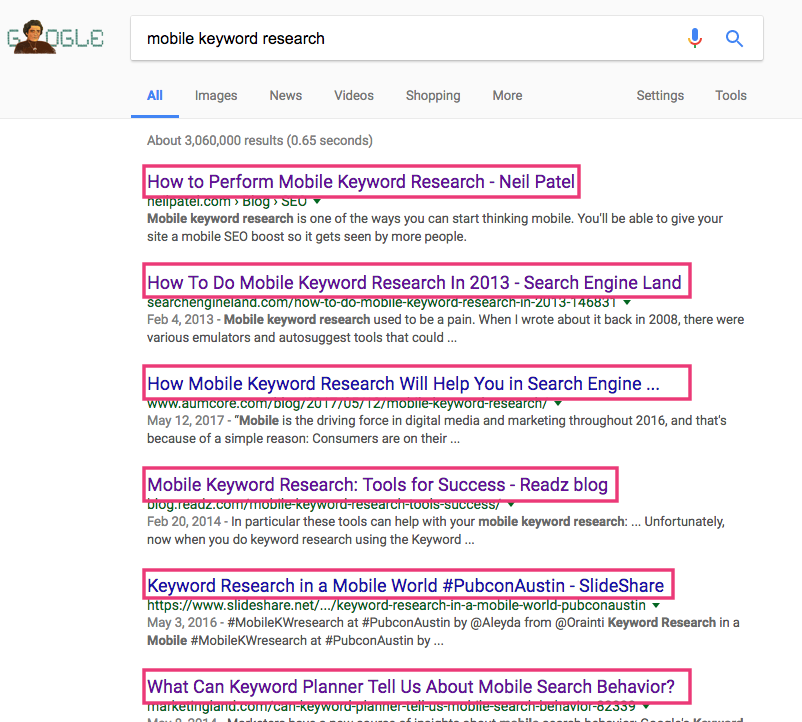
Search each keyword and take a look at the SERP result.
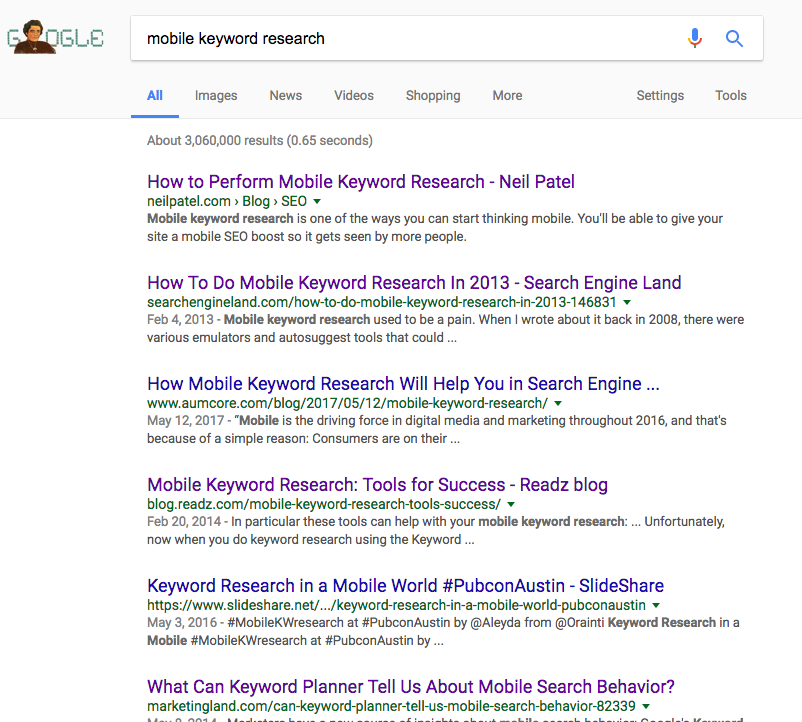
Try to step back and look at these results objectively. Ask yourself why these aren’t getting that many clicks.
There could be several culprits here. The most common causes are a bad title tag or a bad meta description.
Let’s look at title tags first.
Tweak your title tags
Your title tag will often convince people to click on your SERP result.
It’s the biggest and most obvious part of your result.
Your title tags have to be SEO friendly, but they also have to be compelling.
Think about it. You’re on a SERP with 8-9 other results. What’s going to help make yours stand out? An awesome title tag, that’s what.
A good title tag is well formatted and specific. You also don’t want it to be too long or else Google will cut it off.
Here’s a role model for title tags. I found this on page 1 of the SERPs for the query “best title tags.”
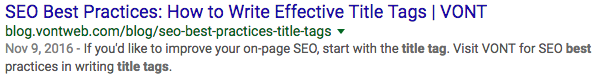
Right away, you know if you want to check out the content or if you’d rather pass it up.
It’s short and super descriptive. You already know what the content will be like just from reading the title tag.
That’s what every title tag needs to do.
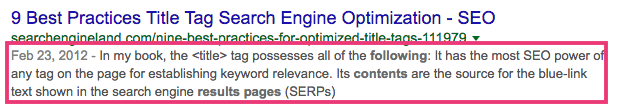
Now look at this title tag, also from page 1:

This is a little…confusing.
Sure, it’s about title tags. But what about title tags? It’s unclear.
And 50% of the title tag is the brand name. Honestly, it feels like bad SEO to me.
I know what you’re thinking: “But Neil, it’s on page 1! It has to be good, right?”
Not necessarily. That’s why you need to consider both clicks and impressions.
Your page 1 result can get all the impressions in the world, but if your CTR is 0, that link is effectively worthless.
That’s why improving your title tag can be a game changer. In fact, I recommend you look at all of your title tags and see if you can make them better.
So go back to all your SERP results. If the title tags don’t seem awesome to you, work on them until they’re irresistible.
Maximize your meta description
If your SERP links are performing poorly, it could also be your meta description.
The title tag is where users go to see what your content is all about. They check out the meta to learn all of the juicy details.
Unfortunately, some meta descriptions can disappoint. And that almost always causes people to decide to not click on a link.
I’ve written about writing meta descriptions before, so I won’t go through every detail. I’ll just cover the important points.
First, make sure your meta description is clear.
Your meta description should summarize your content for people who are scanning the SERPs.
If your title tag reels someone in, your meta description needs to convince them to check out the content.
This description from VerticalResponse is exactly what I’m talking about:

It leaves you with zero questions.
If a friend asked you what VerticalResponse is, you’d be able to answer.
But you don’t know everything about VerticalResponse. That’s critical for this next step.
Second, make readers curious.
Don’t make your meta description vague to create “curiosity.”
Instead, hype up your product and make your user wonder, “Hmm, what’s this all about?”
That VerticalResponse meta description does an excellent job of this:

It makes you think, “Is it really that good? Why not check it out?”
Third, keep it short.
Google will cut off long meta descriptions. The right length is around 160 characters. When in doubt, make it shorter.
Find your mobile keywords
Mobile keyword research is a field of its own.
If you’re serious about enhancing your SEO, I recommend putting some time into it.
That being said, Search Analytics is great for a quick fix to your mobile SEO strategy.
Search Analytics can show you which keywords are being used for mobile.
To see this in action, look at the Devices option. You should see small text that says “No filter” below it.
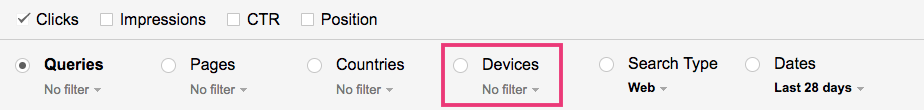
Click on that. You’ll see a few options. Click on “Filter devices.”
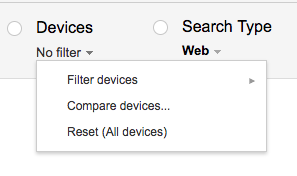
You should see options for Desktop or Mobile. Select Mobile.
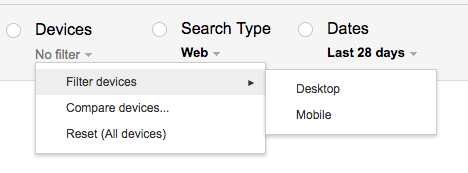
Now you’ll see all of the keywords that mobile users are searching to find your site in the SERPs.
Once you know these keywords, you can implement them into your mobile SEO.
Find performance drops
Here’s something about Search Analytics that’s not obvious.
By default, a Search Analytics report will only cover the last four weeks.
That means all the data you’re seeing is pretty fresh. But it also only represents one timeframe.
This can hide some issues.
For example, if one of your keywords is at position 11, you’d probably think it’s doing well.
But that keyword could have been at position 8 a couple of months ago.
To get the most out of Search Analytics, you need to get comfortable with adjusting dates.
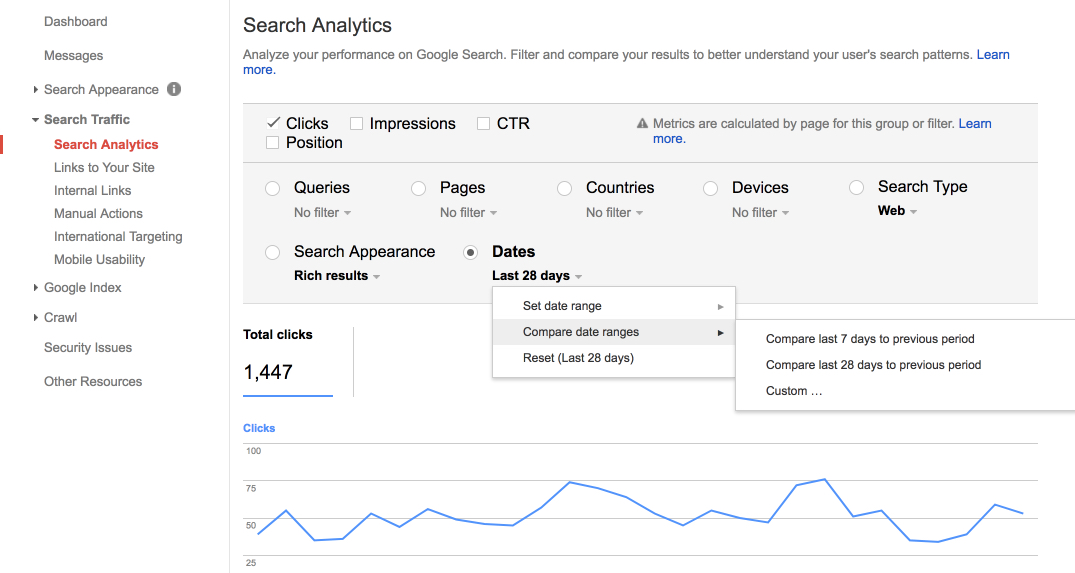
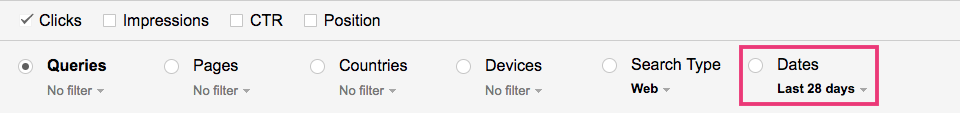
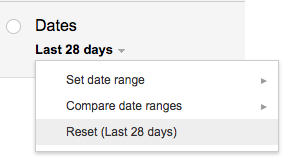
It’s all in the Dates option. Right now, you’ll probably see that it says “Last 28 Days.”
You can take a look at older dates, but what I really like to do is compare date ranges. This is one of SA’s handiest tools.
Click on the “Last 28 Days” text. You’ll see a box pop up:
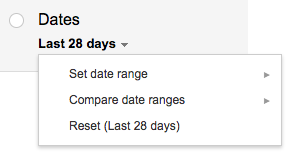
Click on “Compare date ranges.” Then you’ll see this:
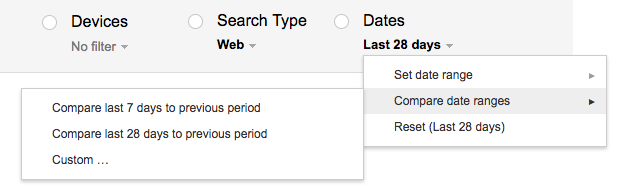
You can go with one of the preset options if you want. However, if you click the “Custom…” option, you get the ability to specify exact date ranges.
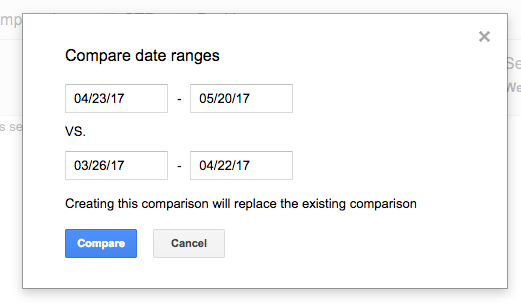
I like this option because it’s super flexible.
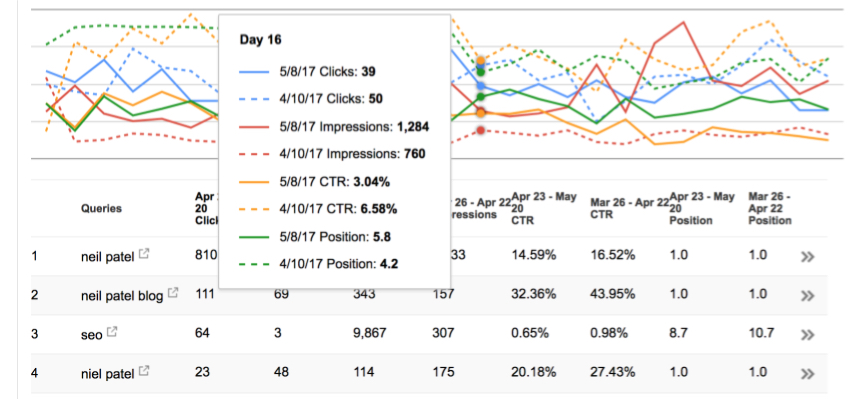
Once you’ve set your date range, you should see something like this:
In the first section, you can see how all of your metrics have changed:
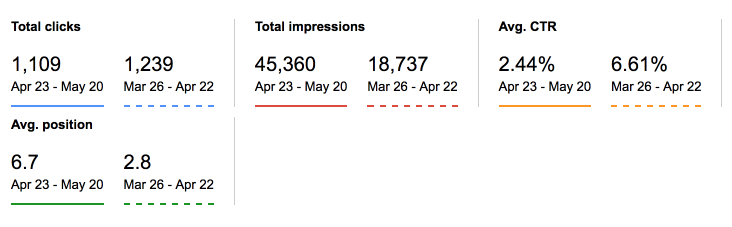
And the graph provides an interactive, visual analysis of your performance.
Here’s the really cool thing about the Dates feature.
When you change a date, you can change anything else you want, and the dates will stay the same.
I love this about Search Analytics. It’s really flexible and does everything you tell it to.
And if you want to return to the default view, just go to Dates > Last 28 days > Reset (Last 28 days).
One thing I should mention: The furthest back in time Search Analytics can go is 90 days.
That means it is inherently a short-term analytics tool. But that doesn’t mean it’s not useful. Quite the opposite!
So let’s talk about how you can use all of this information.
Let’s say you’re comparing the last week to the last 90 days and you see a recent drop in impressions.
That means fewer people are seeing your search results.
So you could run a Google search yourself and see if you’ve been pushed down a few positions.
If you have, you know you need to recover your ranking.
That’s just one way to use these results.
You can use the Dates function to find any sort of drop in performance. That way, you’ll know where to start fixing it.
What do you do if nothing’s working?
Let’s say you’ve reworked all your title tags and meta descriptions. You’ve optimized for mobile keywords too. But you’re still seeing poor performance.
Or maybe you’re getting more clicks, but you’re seeing high bounce rates.
What do you do next?
It’s simple: Improve your content.
I’ve always said that content is the most important part of any strategy. At the end of the day, if your content is bad, no amount of SEO will make people love it.

Source: Squaretreemarketing.co.uk
If nothing else is working, try identifying problems within your content.
Is it not comprehensive enough? Is it lacking data? Find what’s making users bounce and fix it.
It’ll take some critical thinking, but it’ll help make your content better.
Even if your Search Analytics results are good, I still recommend constantly improving your content. It can make a world of difference, and your metrics will reflect that.
Conclusion
You might be tempted to think of Search Analytics as a “beginner’s” tool.
While it’s great for beginners, it’s also great for everyone.
It’s all in how you use it. If you’re just selecting all the filters and briefly reviewing the report, it’s not going to help you.
The point? Don’t be afraid to dive deep into the data.
Explore each filter and grouping option. See exactly where your performance is poor and ask yourself why that might be.
You also need to use Search Analytics consistently. You can’t use it once a month and use that information to drive thousands of people to your site.
Make Search Analytics a regular part of your SEO strategy. It’ll take some time to get results, but if you make improvements based on your reports, you’ll get more traffic within a few weeks or so.
It doesn’t matter if you’re refreshing a decade-old site or if you’ve just started. Taking an in-depth look at your Search Analytics metrics will help you create a better experience for your users.
How do you use Search Analytics?
Comments (68)