
Is your business making as many sales as it could?
I doubt it.
See, the majority of prospects aren’t ready to buy your products on the first exposure to your brand. So, you need to slowly build a relationship with them, by sending educational content and then making them aware of your services/products.
This process is called filling sales funnels.
Even if you’re generating an ample number of leads and nurturing each potential customer, there might be quite a few leaks and cracks in your sales funnel.
In 2015 research by Forbes, only 22% of marketers said they have data-driven marketing initiatives that are achieving significant results. Seems strange to me to design any marketing effort without understanding how sales funnels are affected. Data drives results.
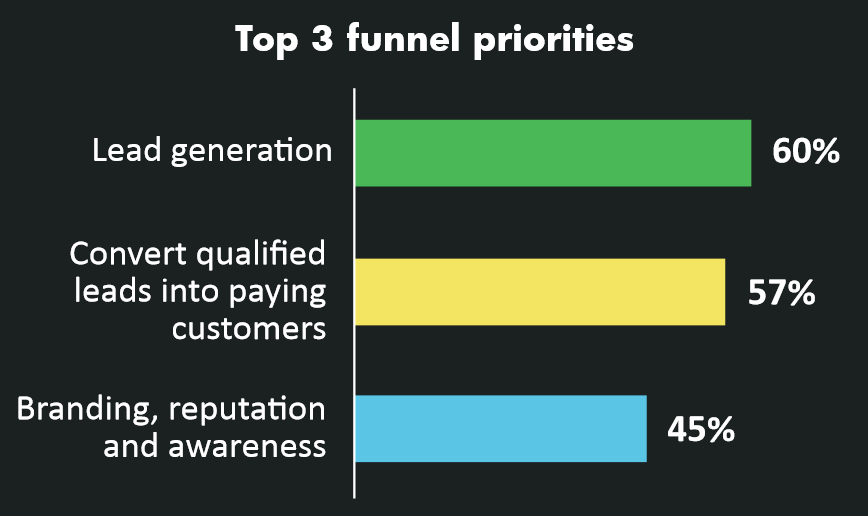
If you zoom into the marketing stats, you’ll get a clearer picture – only 50% of marketing leads are ready to buy. And, 57% of businesses feel that converting qualified leads into paying customers is a top funnel priority.
You need to walk through the process your customers go through and remove friction at every stage of your marketing funnel.
To help you carefully monitor your customer interactions and analyze their behavior, I’ve compiled a list of 5 fantastic analytics tools.
Why should you rely on tools?
-
- Marketers are expected to spend 11% of their total budget on analytics. Yet. in another survey, only 36% of companies were found to use analytics to drive customer acquisition.
- 54% of marketers are not sure if their marketing technology investments are producing tangible business value.
These 5, hand-picked, tools will make you aware of the places where your customers get stuck and thereby streamline your marketing funnel to keep a potential customer moving along. Here goes number 1.
1. Supercharge your website’s qualified traffic with these Google Analytics (GA) reports
Google analytics reports can significantly boost your content marketing campaign. It’s the most popular choice as an analytics tool for businesses and shopping websites. It powers over 67.4% of the top 10k websites.
Let me quickly show you 3 of its amazing reports to help your web site.
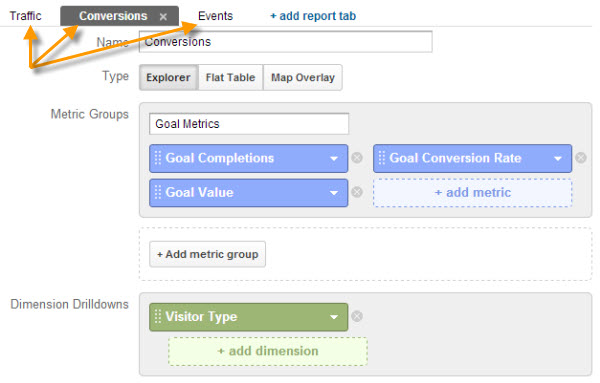
1. First, I want to share an amazing custom report that shows you the behavior of your returning visitors against your first time visitors.
You’ll use 3 categories as columns: Events, Conversions and Traffic. And, view the report as a pivot table and use Visitor Type as the pivot. You can get the report here.
What if you find a striking difference between new vs. returning visitors (like in the example below)?
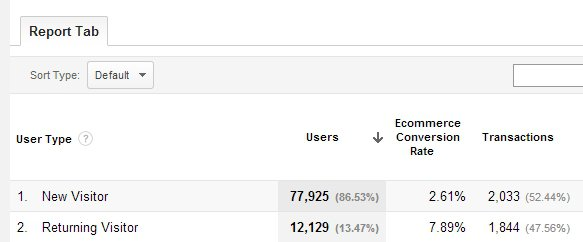
Then, set up lead opt ins and persuade new visitors to give you their email. Marketing automation helps onboard them. Once you nurture the leads, you can slowly put your services and products in front of them.
2. Hopefully, your web site already has a funnel in place. Here’s my article to help you build your funnel, if you don’t.
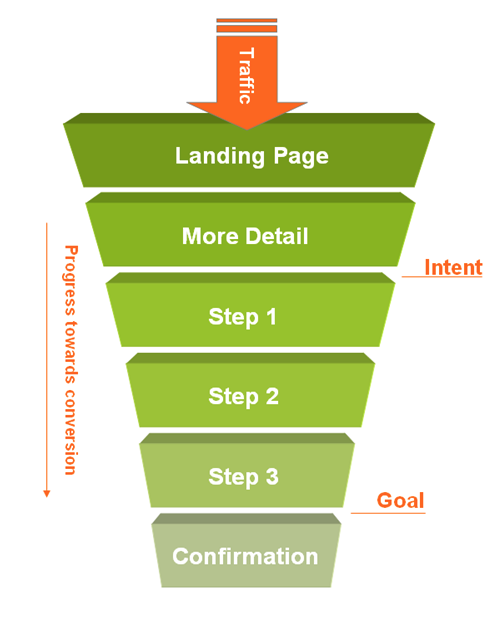
Once you’ve built a web site funnel, you’ll also need to set it up inside GA, by setting goals for email marketing. Here’s a great GA funnel guide by KISSmetrics to help you. You can also watch the video tutorial below.
All done?
You might face difficulty in looking at a data sheet and recognizing the problem areas. But, don’t worry, GA has handy funnel visualizations.
Navigate to Conversions >> Goals >> Funnel Visualization.
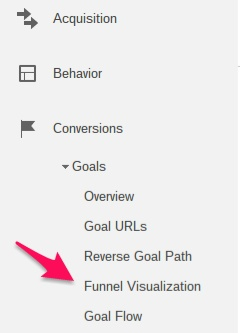
You’ll get a report showing how much traffic is leaking out at every step of the marketing funnel.
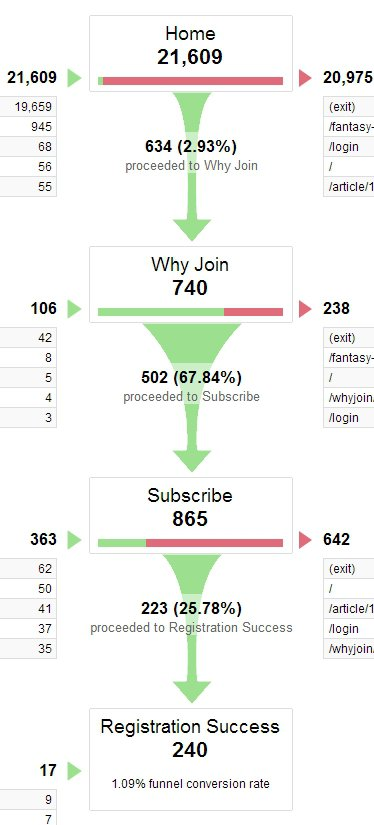
Leaks occur at pretty much every step. But, identify the step where you’re losing the maximum amount of money.
In the above case, the first step converts at only 2.93% and is the biggest leak. But, since it’s the home page, there’s a possibility that you’re driving mostly irrelevant traffic (over 95%).
The actual culprit might then be the subscribe page, as it only converts at 25.78%. That’s a terrible checkout conversion rate, because if your visitors have taken the effort of going through the 2 steps – it means they are interested in your offer but haven’t given you their credit card for some reason.
So, focus your conversion optimization efforts in this step.
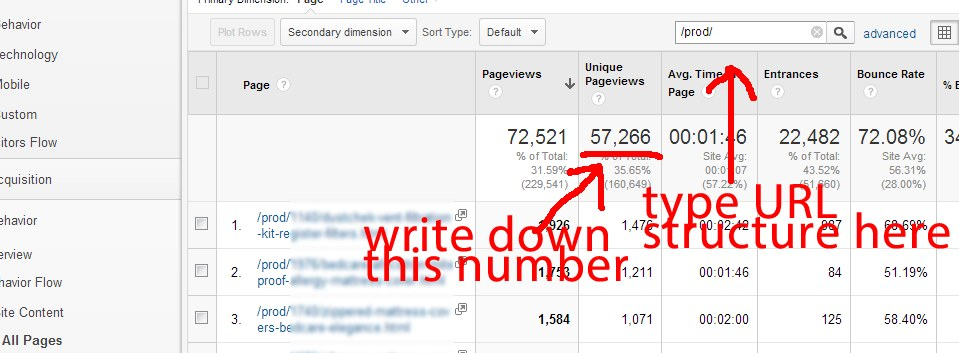
Warning: Double check that all of your funnel steps are correctly configured inside GA. It’s not possible to get 0 leaks and 100% conversion.
It’s advisable to perform a manual walk-through of the URL in every stage of your funnel. Also, cross-check the pageviews for each layer by logging into your pages report at Behavior >> Site Content >> All pages.
3. What if your web site doesn’t work well with particular older versions of Internet Explorer or Firefox?
You’ll get conversion drops on these browsers – GA can help you identify them.
Just navigate to Audience >> Technology >> Browser & OS from the left hand side of your menu. And, add “Browser Version” as a secondary dimension.
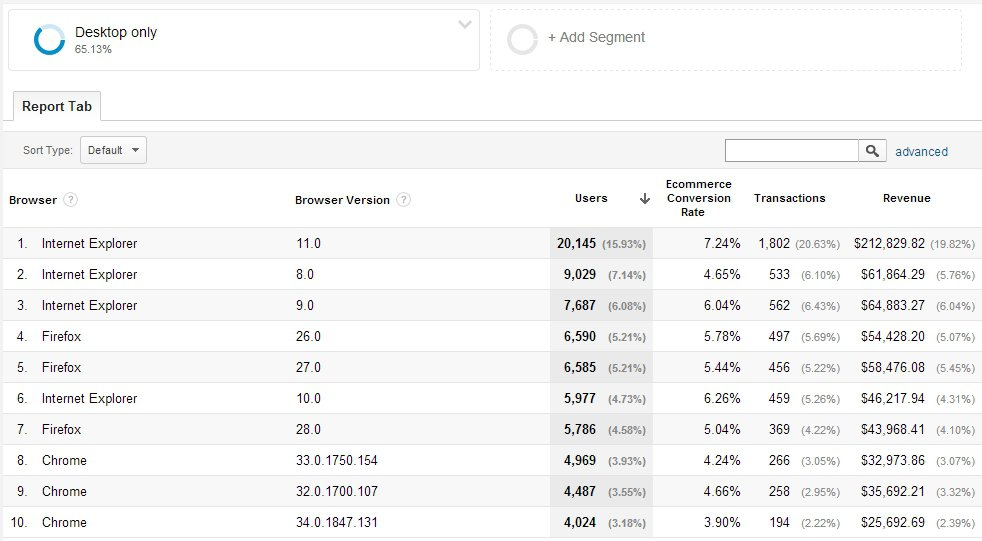
If you find a few thousand users of a browser version facing compatibility issues, then your developer will need to fix them.
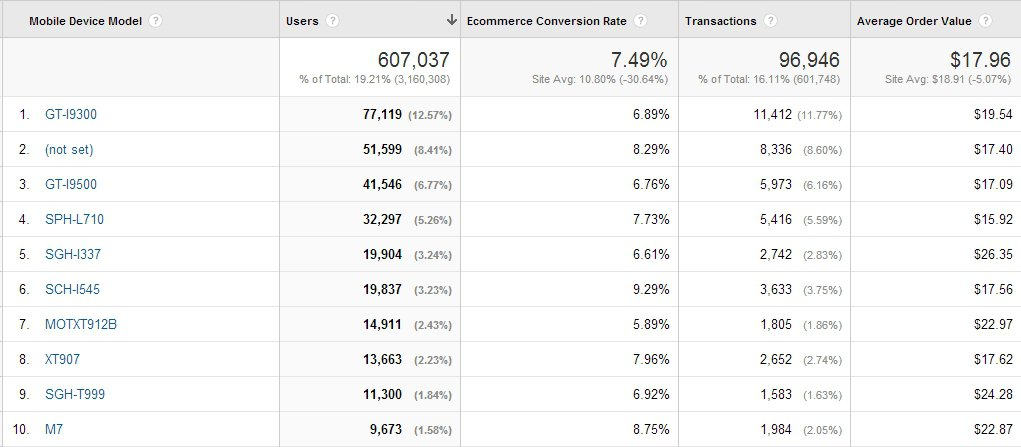
Similarly, you can also access the variation of your conversions across devices. Navigate to Audience >> Mobile >> Overview to see a simple report like the one below.
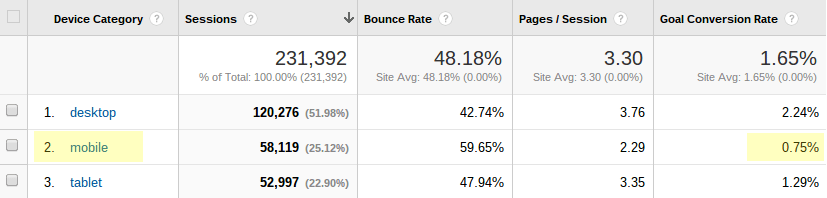
From the devices menu, you can break down the report even further.
If fixing your design for a particular underperforming device appears to offer a positive ROI, then go for it.
Alternative: KISSmetrics
KISSmetrics is a great tool to measure your engagement metrics and its especially helpful for commerce businesses where there is a lot of marketing automation in emails, upsells and re-sells.
Using it, you can map out the common steps a user might take, from first appearing to completing your conversion goal. The best part is that you get data visualizations sans the hassle that GA requires.
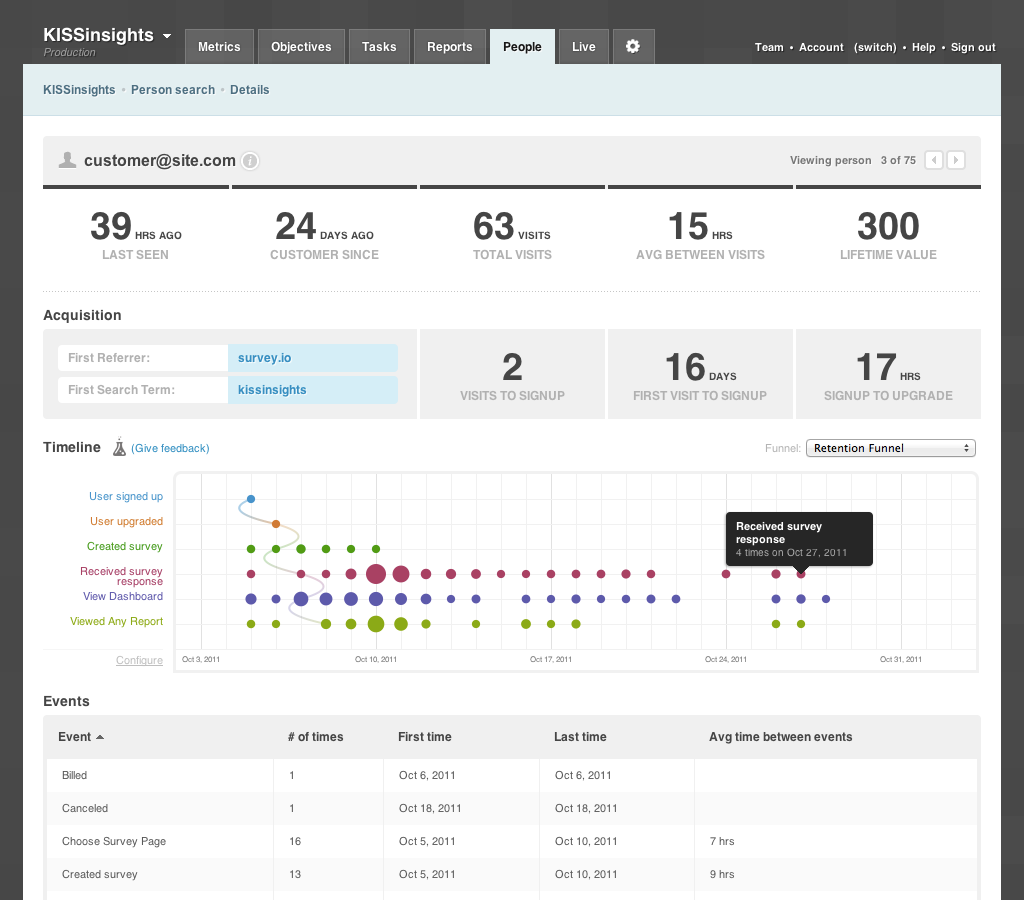
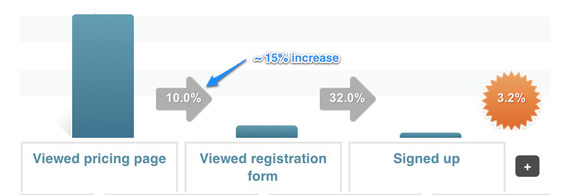
Let me share a case study of how a startup increased conversions with the tool. Officedrop created a conversion funnel visualization using KISSmetrics to find where it was leaking prospects.
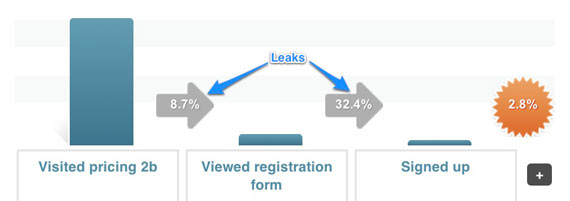
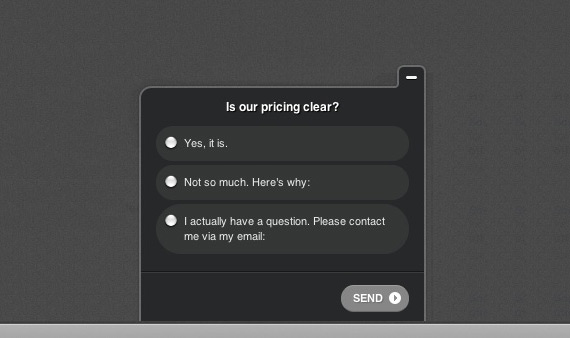
They found that both the pricing page and the signup form were losing people. They installed KISSInsights (in conjunction with KISSmetrics) to find the problem with their pricing page and got over 20 potential customer responses suggesting that their pricing wasn’t clear.
So, they tested a new pricing page and increased their conversions by 15%.
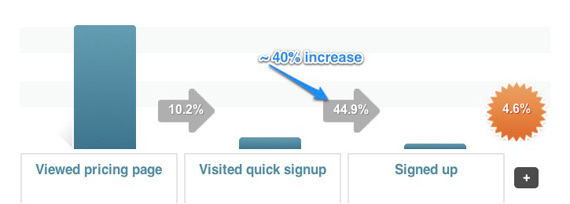
Then, they reduced the number of fields on their signup form and improved its design to blend with the website. This resulted in an additional 40% increase in conversions for their funnel.
2. Explore your website’s usability by finding where your users click using CrazyEgg
Do you want to be aware of the places where your visitors are clicking on your web site?
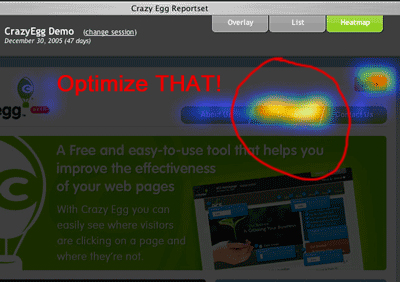
Then, you would love CrazyEgg. It generates scroll maps and heatmaps, based on the click behavior of your website visitors.
Getting started is simple. You’ll just need to insert the CrazyEgg tracking code in pages that you want to track. Then, the tool does its magic and measures all of the clicks on your specified URL.
With every mouse click, you’ll also get valuable information including the referrer, country and device type. Here’s an example heatmap by the tool, showing how visitors are engaging with the website. This helps my marketing effort because I can now target more effectively.
Softmedia used heatmaps to identify the problematic sections on their website and increase conversions by 51%.
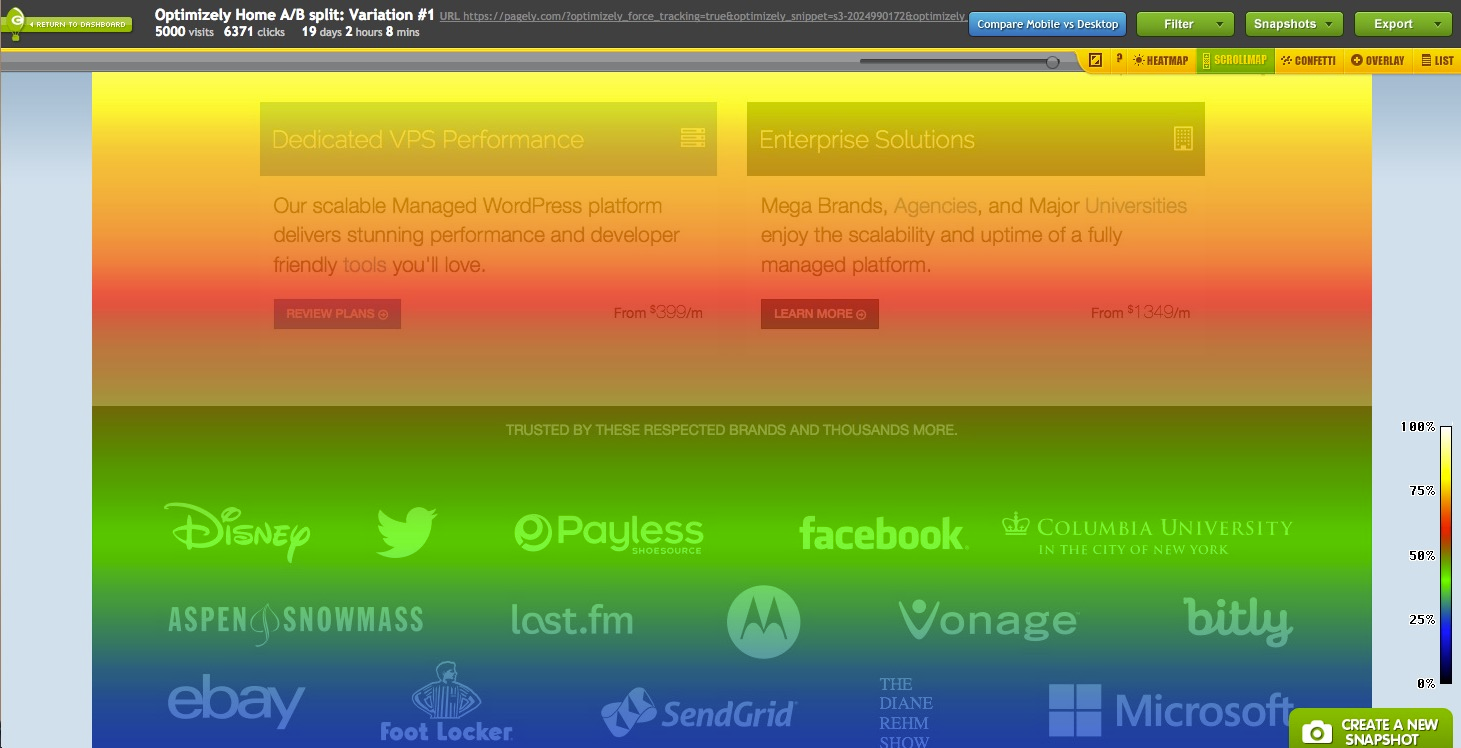
You can also get insightful scrollmaps representing the sections on your website where the visitors are spending the most time. Is it on a blog post or one of your sales funnels?
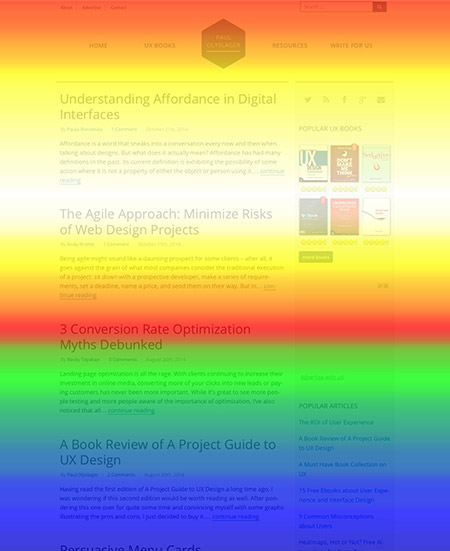
You can also compare the scrolling of different devices (desktop vs. mobile) side-by-side.
Pagely used scrollmaps to find that fewer than 25% of their website visitors were scrolling beyond 600px. So, they changed their page layout to ensure that their audience sees the most important information.
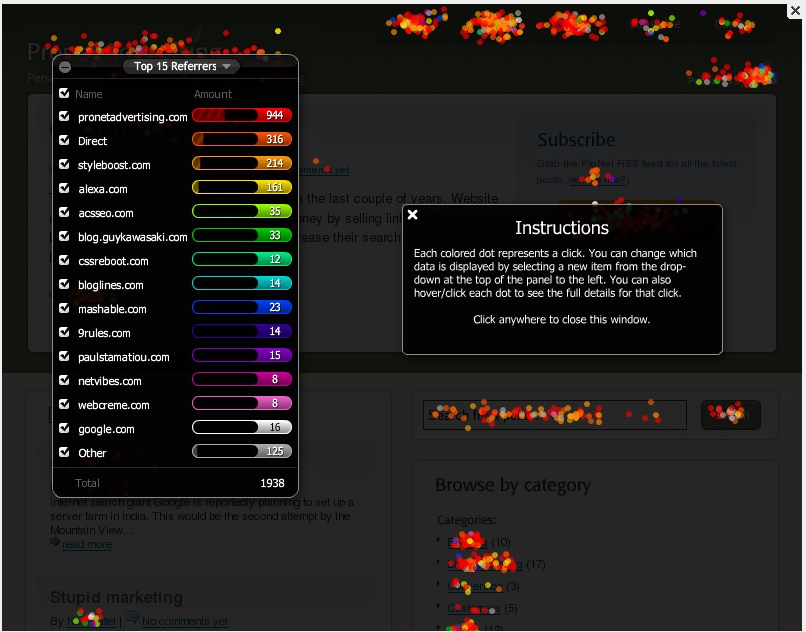
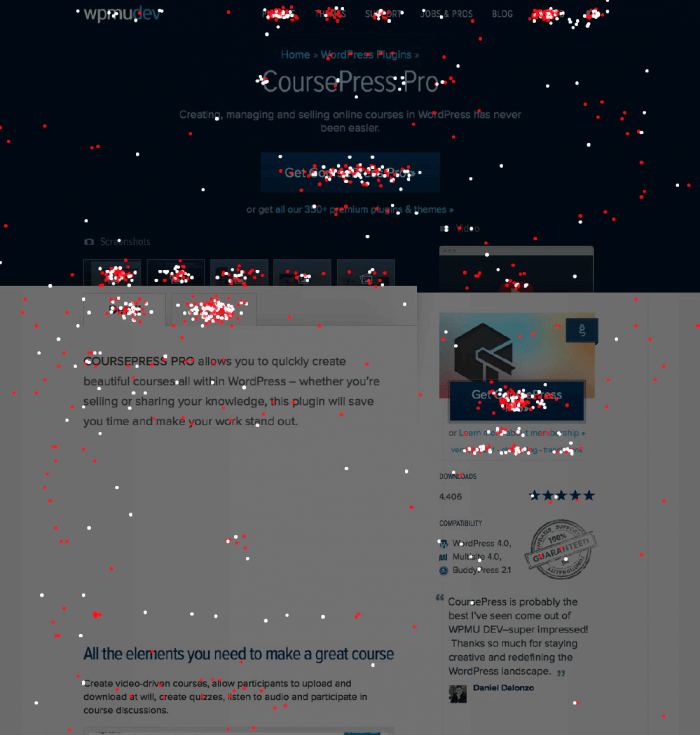
If you want to see each click individually, then switch to the Confetti View. Based on the traffic sources from where these visitors arrive, they might behave differently. And, by analyzing them, you can create separate landing pages for each of them.
WPMU Dev improved their product pages using this view and realized that they had too many calls-to-action that their visitors weren’t clicking.
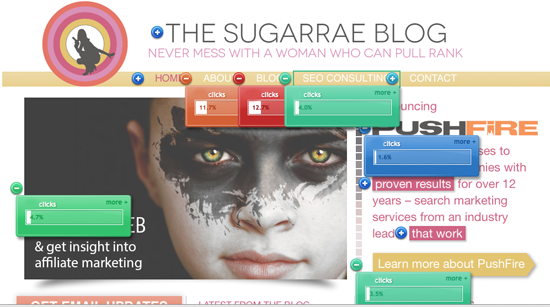
There’s also an overlay view to see the number and percentage of clicks each link on your page is getting. You can also extract information around the clicks, including the referral source, keywords, etc.
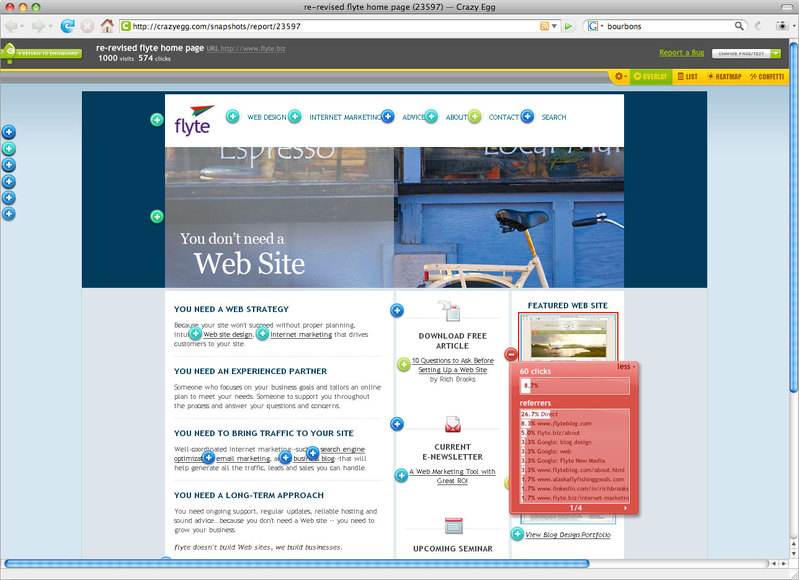
SugarRae used this view to find the content that’s the most appealing to the visitors through the navigation labels that get the most clicks.
Once you find the exact website elements where your users are clicking, you can specially focus on their copy and design. This will help in diagnosing your user experience issues and thereby lifting your conversion rates.
3. Conduct A/B tests to improve your conversions with Optimizely
If you want to run an A/B test or perform multivariate testing, Optimizely is a great tool.
It’s an incredibly user-friendly tool that allows you to drag/drop elements and edit A/B pages in real-time. So, even email marketing beginners without coding know-how can start testing and improve their web site.
Here’s a quick review of the tool, by Phillip Dyhr Hobbs who increased his client signups by over 10%
Paul Olyslager used the tool to perform multivariate testing and increase his pages per visit.
How?
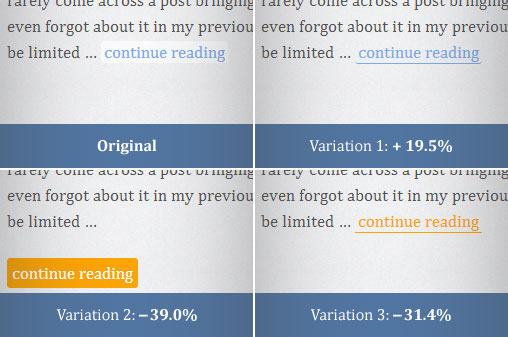
By improving the CTR of the calls-to-action on the home page that encourage reading, like the links to a blog post in the sidebar.
Here are the results for the ‘Continue Reading’ button variations.
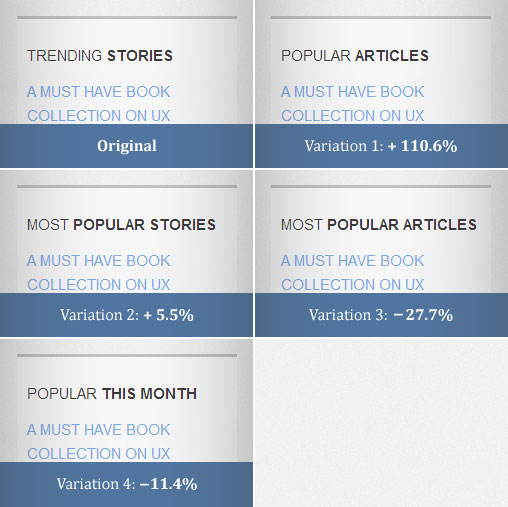
And, here’s how the text variation of the articles section in the sidebar went. The original ‘Trending Stories’ version was trumped by ‘Popular Articles’ by 110.6%.
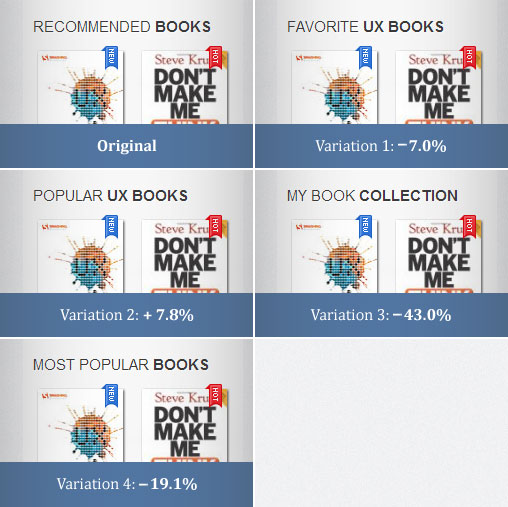
He also managed to increase clicks on his affiliate links.
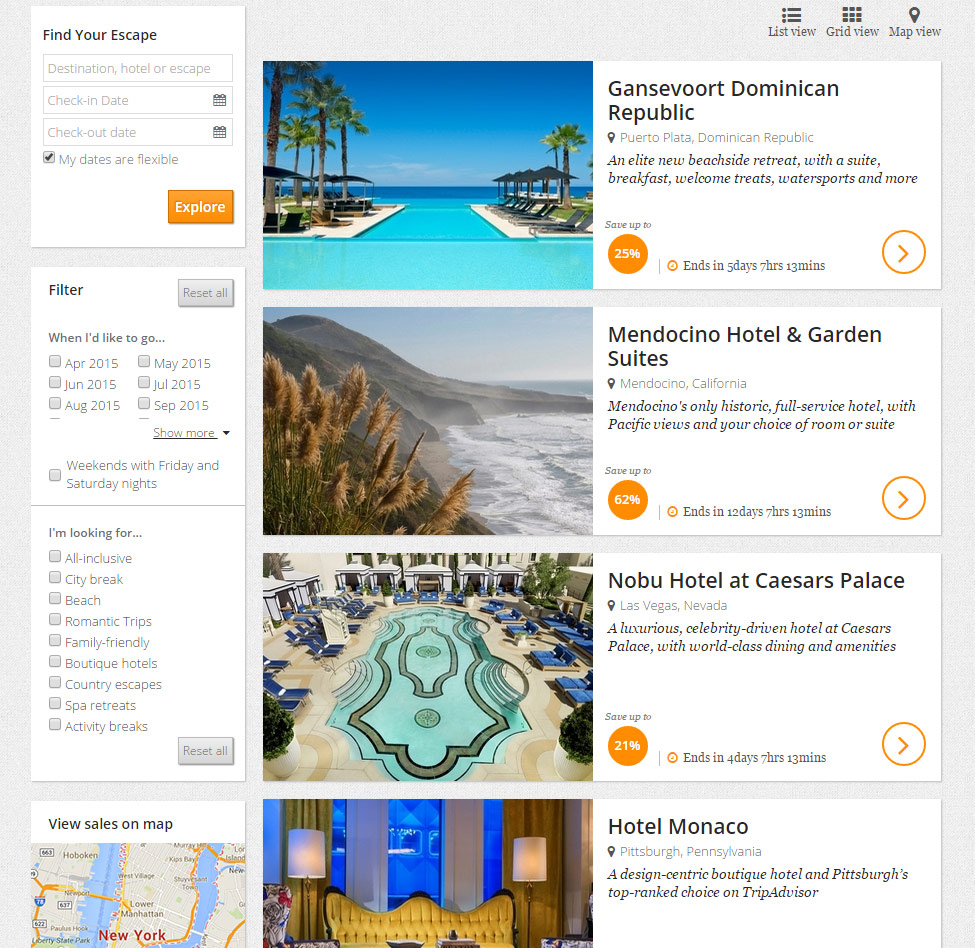
Luxury travel company, Secret Escapes, personalized experiences for their PPC traffic and were able to lift conversions by 32%.

They also tried personalizing the experience for the logged in users, by using the searched data to show vacation listings. After 140 days, they saw a 210% increase in completed credit card purchases.
4. Access real-time consumer insights with GoSquared
If you’re looking for a live entry into your consumer’s behavior, without any buzzwords, then you’ll like GoSquared.
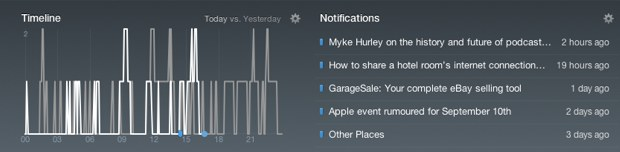
Its “Now” panel shows where your current visitors are located and the pages that they are viewing.
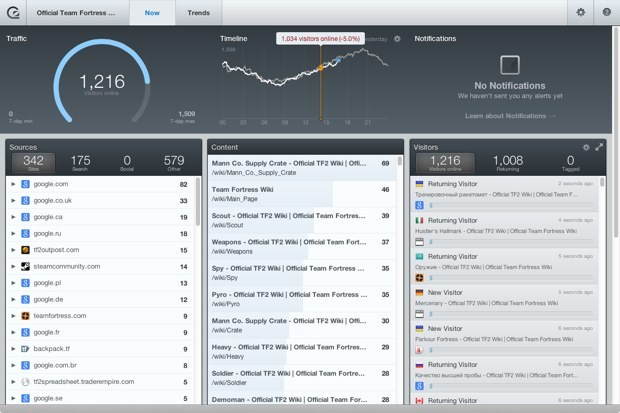
You can also see the traffic timeline as a line graph, showing your busy traffic times.
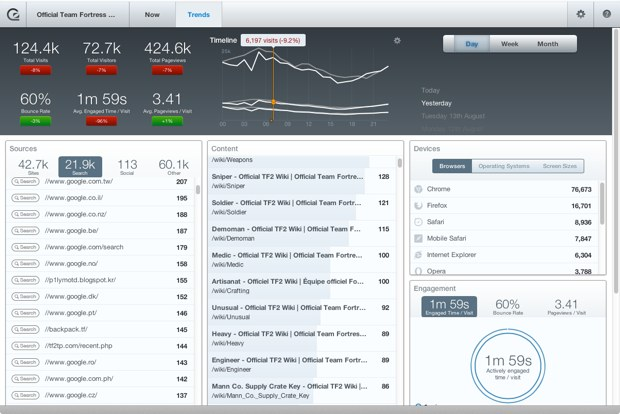
Under Trends, you’ll find historical stats on your traffic sources, engagement of the visitors and the devices that they used.
Car Throttle used the GoSquared API to show the ‘Trending’ section.

And, Ghost used the tool to judge the impact of PR events and launches.
As per John O’Nolan, the founder of Ghost, the tool gives valuable insights in a short amount of time.
We’ve been able to spot downtime before it happens or see a spike of interest before it’s really huge.
5. Get video customer insights of real people through UserTesting
If you like the idea of getting paid to test a website, then you’ll love hanging out at usertesting.com.
As a business, it’s a valuable resource to optimize your website. While all tools plot visualizations and feed data, UserTesting gives you insights into ‘the why.’
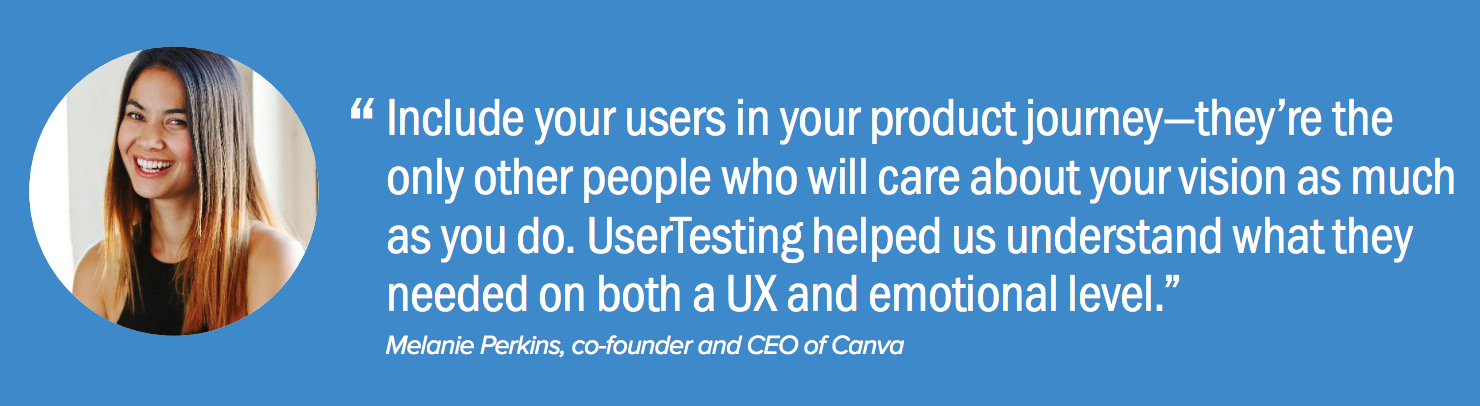
Canva, for example, was ready to launch their graphic design tool in 2014. But, they wanted to test how users would use it. So, they conducted exploratory research through UserTesting.
The feedback was loud and clear, “I’m not creative enough; it’s too hard.”
People had preconceived notions that design tools are hard to use and require special talent or skill.
So, they paid special attention to delivering a smooth onboarding experience. They attacked at the emotional level by busting the myth that people who don’t have creative ability can’t design.
They even created a short introductory video to show how easy it was to use Canva. They created interactive challenges to build people’s creative confidence and persuade them that graphic design can be fun and easy.
After giving people the confidence to trust in their creative abilities and making it simple to understand how Canva works:
Canva reached 10 million users in a little over 2 years.
Similarly, headsets.com found that they had high bounce rates off secondary pages (through GA reports).
So, they decided to investigate the why. On setting up UserTesting.com tests, they found that they had designed a complex navigation. It didn’t even help their returning visitors to make a headset technology choice.
So, they redesigned the navigation and saw a 10% lift in conversions.
Conclusion
Analytics tools are a great value-addition to understand your user behavior and eliminate guesswork. Most of the tools that I listed will require an investment. But, you’ll reap a great ROI from the marketing automation convenience and insights they give for improving your business.
Only if you understand your website’s usability and how your changes affect the users can you make informed decisions that earn you more revenue.
Are there any other analytics tools that you’ve used to fix your sales funnels? I would love to hear your results in the comments.
Comments (21)