
Social media is a huge opportunity for growing your business.
From organic reach to paid ads, social media gives you the ability to build traffic, engagement, and sales.
The problem is that even when you follow all the steps to create profitable campaigns, how do you really know they’re working?
Only 43% of B2C marketers measure their ROI.
Why?
The main reason given is that it’s just too hard. They say they need an easier way.
You could pay for a social media tool or service to do it for you.
Or you can use these 12 different hidden reports I’m about to show you.
This way you can see for yourself, for free, if your social media marketing strategy is working.
But first, let me ask you a question.
Why is social media analytics so important?
More than 3 billion people are using social media and close to 3 billion use mobile social media.
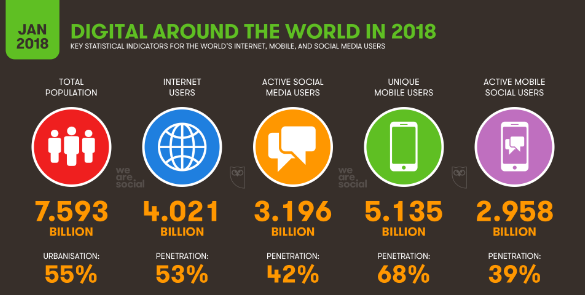
This means that roughly 2 out of every 5 people on this planet have an active social media account, and most of them use it on their phone.
Not only are we online, and on social media, but we’re on it a lot.
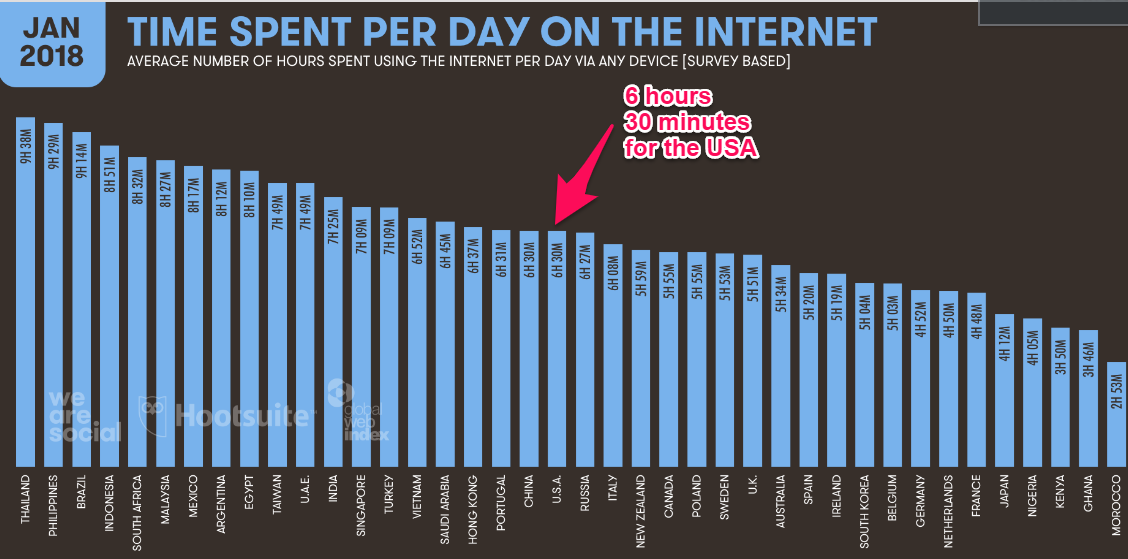
The average amount of time spent on the Internet every day is 6 hours and 30 minutes just here in the US.
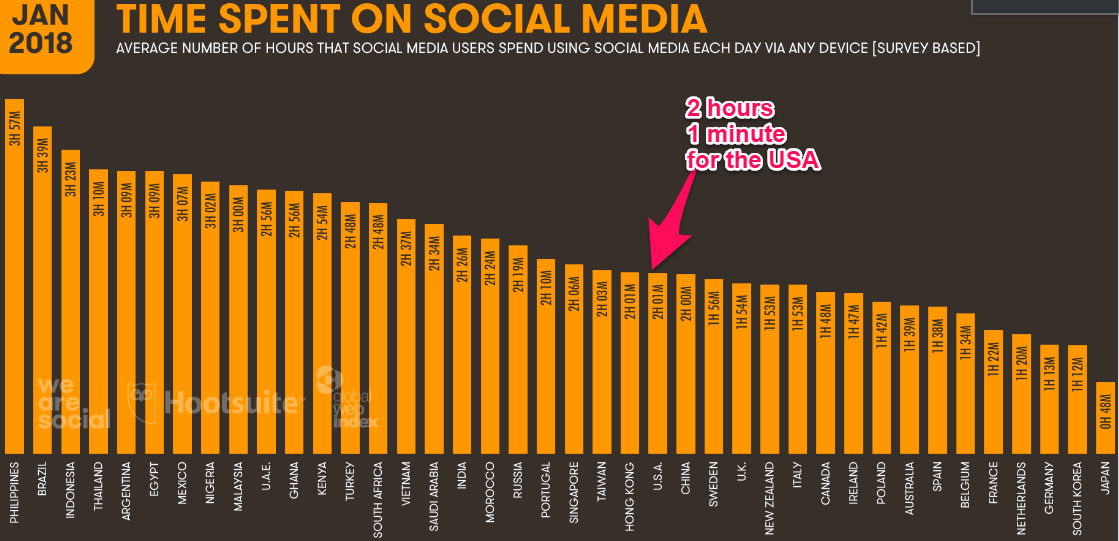
Out of that, close to a third is spent on social media.
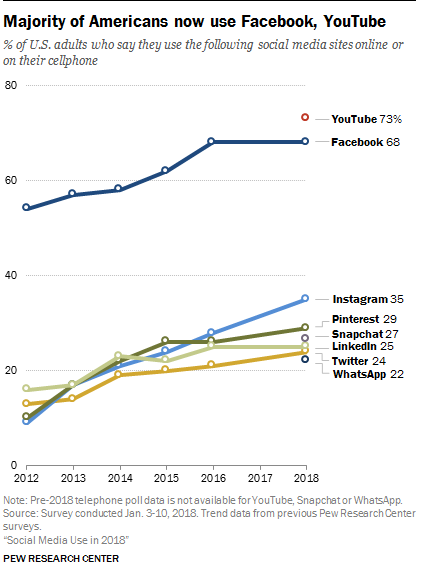
It’s not just one social media platform either.
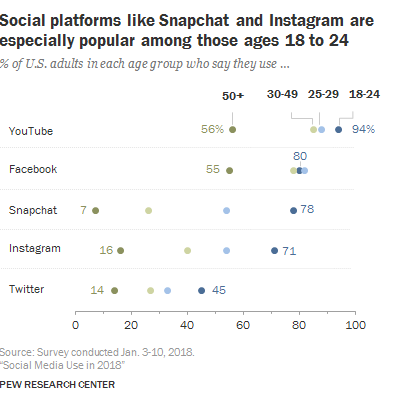
73% of US adults now watch YouTube and 68% are on Facebook.
If your target audience is teenagers, your social media analytics are even more important.
94% of teens are on YouTube, 80% are on Facebook, and 78% are on SnapChat.
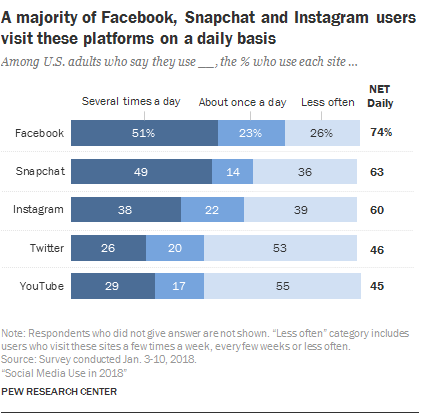
People are using social media platforms multiple times a day.
With such widespread use, social media presents an incredible marketing opportunity.
If you’re not succeeding at social media marketing, you’re going to lose in the long run.
But how do you know if you’re succeeding?
Only 6% of B2C marketers feel that the metrics that they’re using are an excellent way to measure their progress towards their goals.
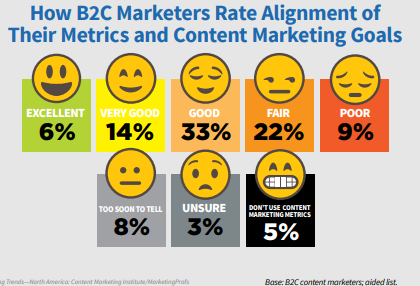
Add this to marketers who feel their metrics are at least good, and you still only have 53% of people.
That means almost half of respondents are not properly and successfully measuring their success.
If you can’t tell if your latest Facebook Ad is tanking or knocking it out of the park, how do you adjust?
You can’t improve your business if you can’t measure your results.
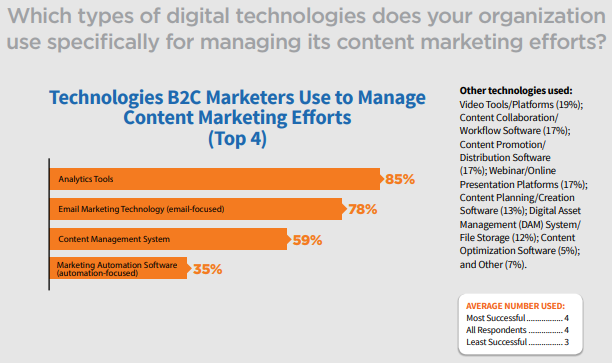
85% of marketers are already using analytics tools. But almost half still have no idea if their strategy is working.
This is why not just any analytics tool will do.
The following are the 12 reports you should be using to make sure your social strategy is succeeding.
Google Analytics Custom Reports
Google Analytics offers a ton of ways to monitor how your social media efforts are paying off.
Unfortunately, the default dashboard on your homepage doesn’t give you a lot of valuable information.
It can tell you how much traffic is coming from social media.

However, the more valuable information can only be gathered through custom reporting.
Here are the top 5 Google Analytics custom reports I recommend using in 2018:
1. Attribution Monitoring Report
One of the first things you’re going to want to understand is exactly how customers are arriving at your website.
If you want to understand how your social strategy is working, you need to isolate the traffic coming from social media.
The default way Google Analytics tracks conversions can be very misleading.
Currently, it defaults to the Last Interaction Model.
Here’s an example of how this Attribution Model works:
- John is researching affordable sedans and finds your website via Google Search. He browses around and likes some of the cars you sell, but he’s not ready to buy yet.
- John clicks to “Like” your company’s Facebook profile and then leaves your site.
- Your company writes a blog about how happy one of your customers is with their new affordable sedan purchase. You post a link to your Facebook page. John clicks on the link and reads the article on your site. Then he once again leaves.
- John’s back researching on Google and this time he sees a pay-per-click (PPC) ad for your website. He clicks on it and buys a sedan.
The last interaction model would attribute the sale entirely to the PPC ad.
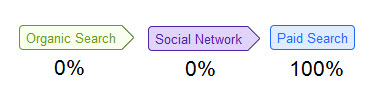
You can see how this is a bit misleading when it comes to the success of each marketing channel.
John twice interacted with your company through social media. This report wouldn’t let you see that your social strategy was in fact working.
Thankfully, there are other options.
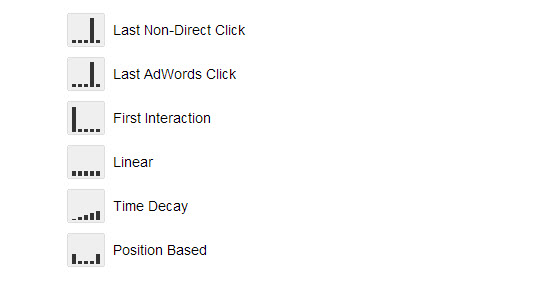
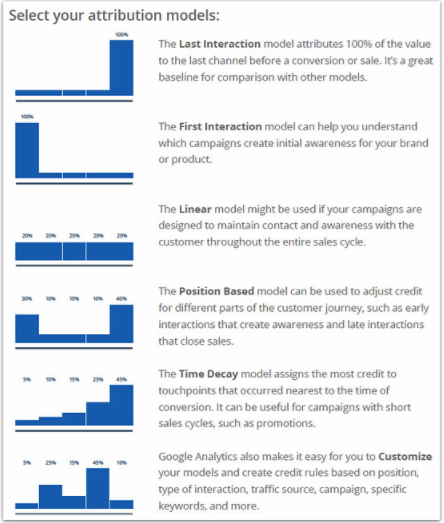
Here’s a look at the other available attribution models:
In the example above, the First Interaction Model would look like this:
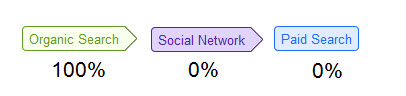
It gives the first interaction with the customer all of the credit.
This is useful if you want to know which channels are driving awareness.
For more information about different types of attribution models, read this.
The Last and First Interaction Models are fairly straightforward.
Time Decay is a model that gives more attribution to recent interactions and less to those further in the past.
Be aware that analytics aren’t perfect.
Any report can be skewed by people switching devices, deleting cookies, or blocking javascript.
This particular report also only looks back 90 days. If your customer’s first interaction was more than three months ago, the report won’t catch it.
I recommend trying a few different attribution report models to see where and how social media is showing up.
Which one you find most useful will depend on your goals.
If you primarily use social media to target CTAs at consumers who are ready to buy, then the last interaction model might suit your purposes.
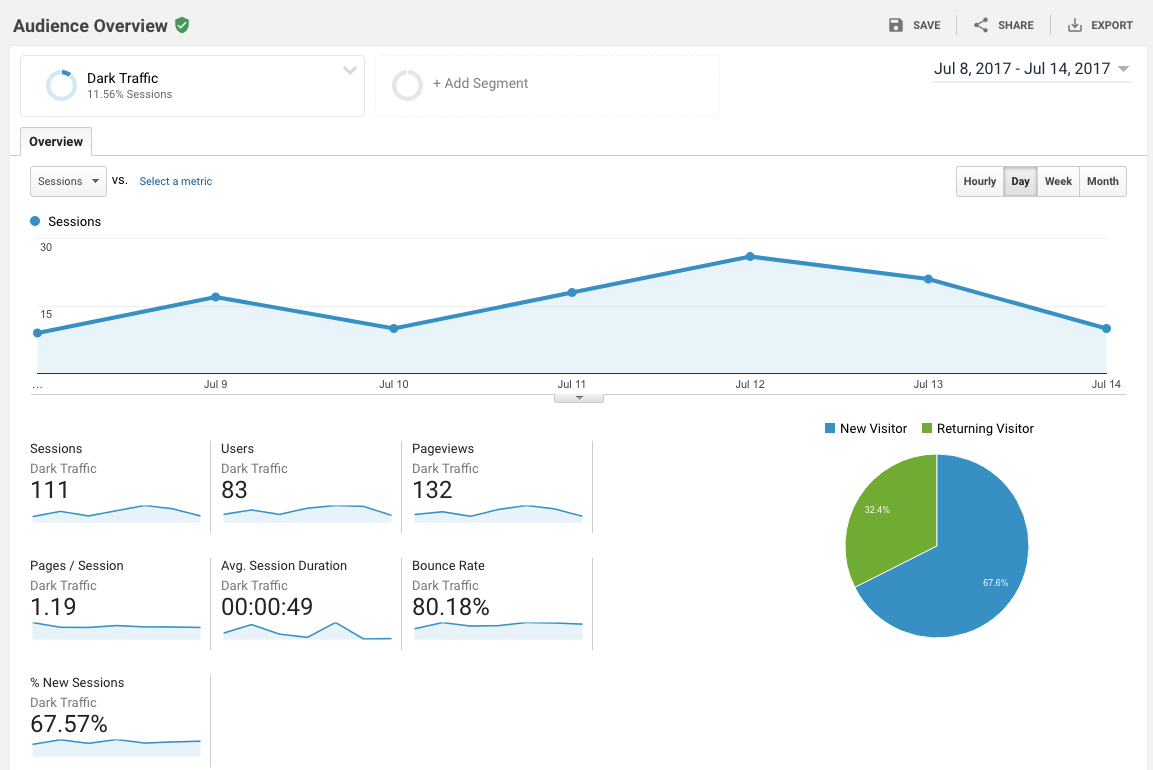
2. Dark social media traffic reporting
If you share a link through social media, such as on your Facebook profile page and a consumer clicks it, that interaction gets attributed to social media.
Let’s say that consumer then visits your page and reads something they think is awesome.
Instead of using your social share buttons on your site, they copy the URL and paste it into a Messenger conversation with their friends.
Any friends who click that link won’t be attributed to social media by the default Google Analytics reports.
They’re “dark social traffic” since GA can’t tell where they’re coming from.
Being able to track this type of traffic is more important than ever in 2018.
Social messaging is now more popular than social media. More and more people will choose to share info through messaging apps over social platform sites.
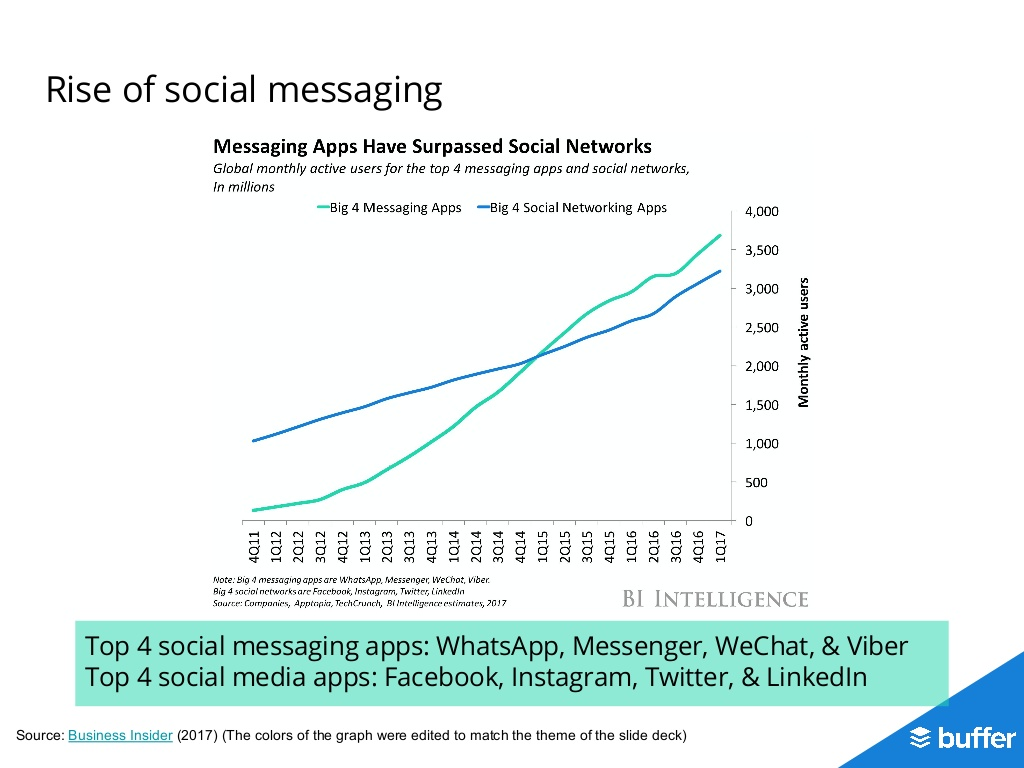
In fact, if you’re adopting the use of chatbots, you’ll be increasing the volume of dark social traffic.
To identify dark social traffic, you need to create a new segment inside Google Analytics to isolate it.
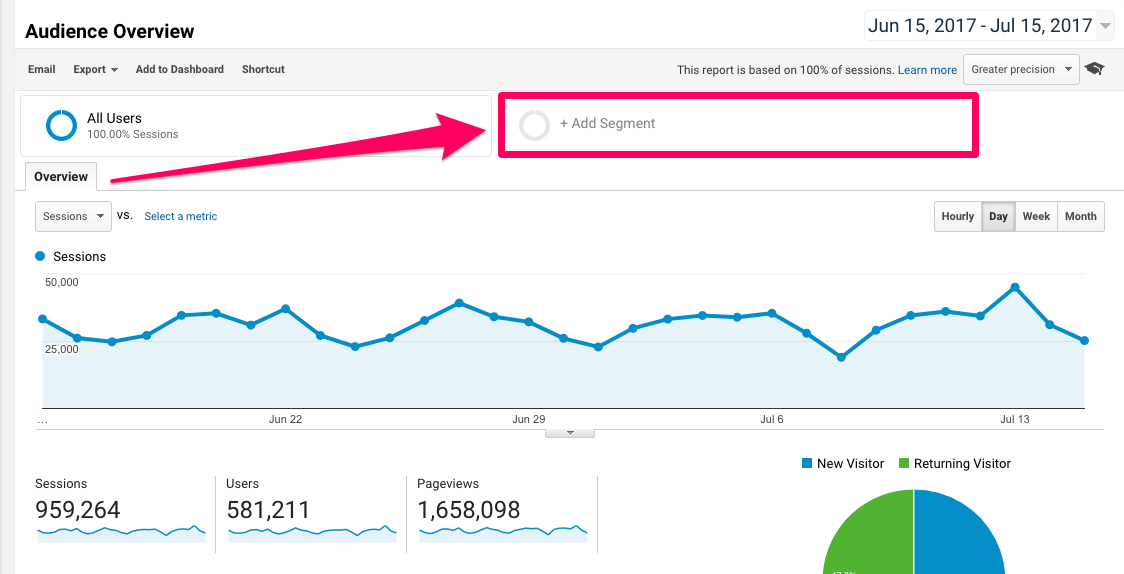
Now drill down into “Audience” and “Overview.” The next thing you’ll want to do is select “Add Segments,” followed by “New Segment.”
You need to create a new segment of traffic for people who are currently being reported as Direct but are actually likely dark.
The first thing you need to do is identify all of your visitors that Google currently believes are Direct traffic.
In Google Analytics, on the left-hand side, select Traffic Sources.
Then under ‘Source’ select contains (direct). 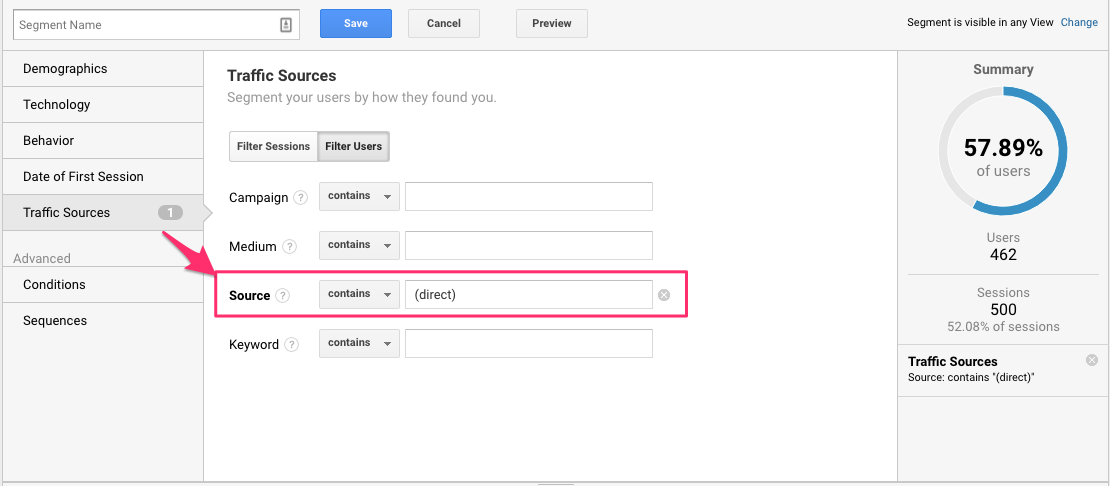
Now filter out the ones who may actually be typing in your URL directly.
Start by ruling out your homepage.
Since your homepage is generally your shortest and most well-known URL, it is the most likely one to actually have direct traffic.
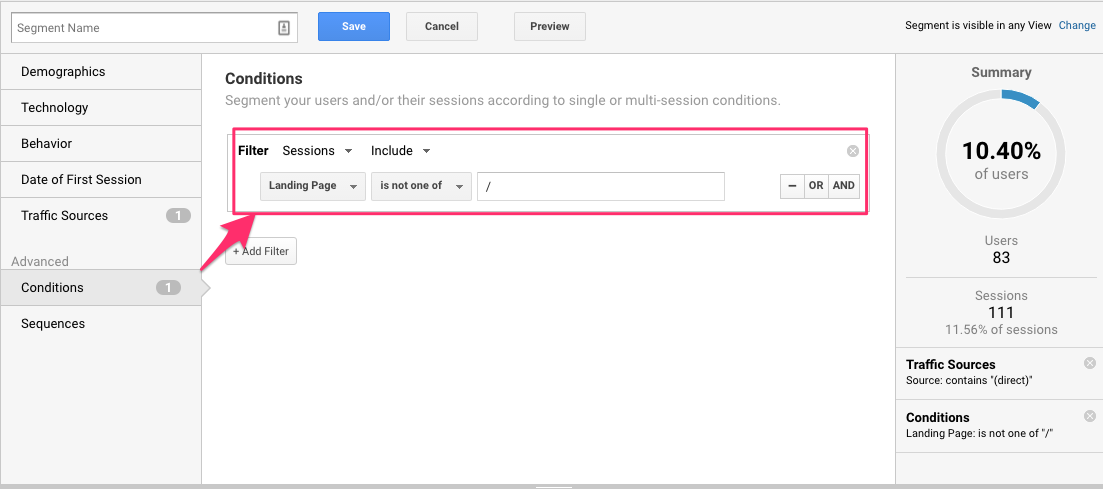
To exclude it from this dark traffic report choose ‘Conditions’ on the left, under the advanced section.
Then go to the ‘Landing Page’ filter and select “is not one of” or “doesn’t contain” and then add a forward slash “/.”
Now you can save this segment, and you will be able to track all traffic that is likely “dark.”
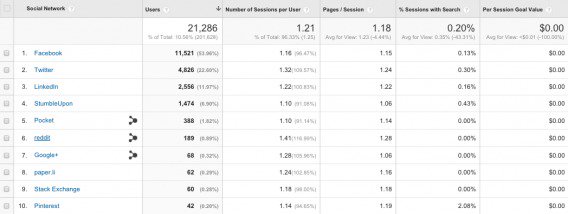
3. Social media performance analysis reporting
You can download this report here, rather than building it yourself.
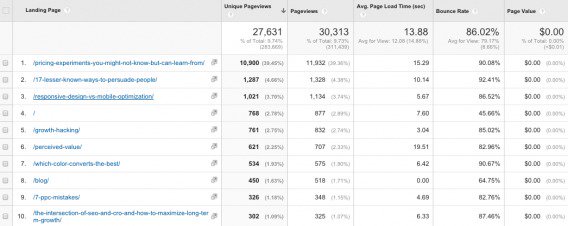
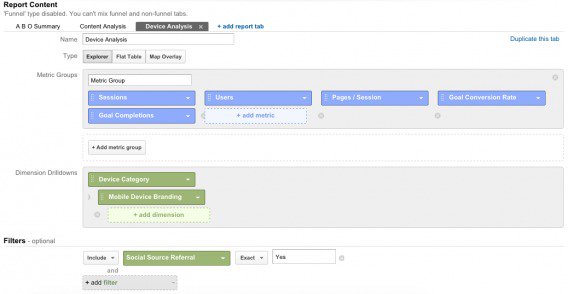
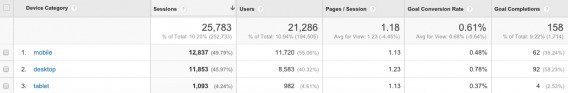
The report has three tabs: summary, content analysis, and device analysis.
The summary will tell you where social media traffic is coming from, how often, if they find what they’re looking for, and if they purchase.
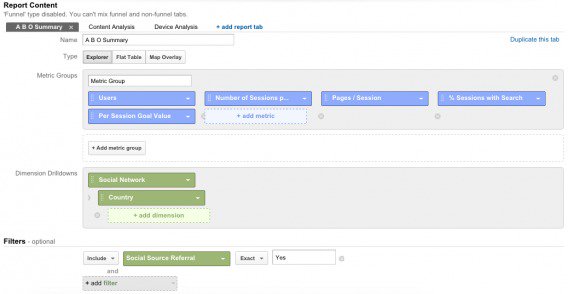
The content analysis report will tell you what landing pages are most popular and which types of content are most valuable.
You can drill down to see what social networks tend to lead to which landing pages. 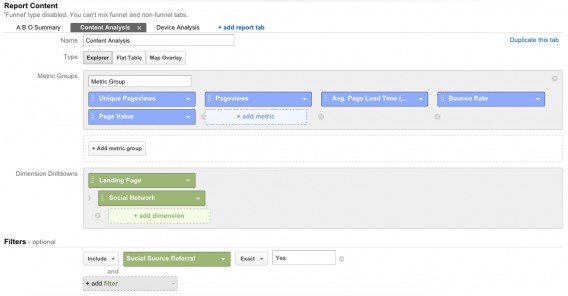
The device analysis tab tells you which devices people are using when they come to your site through social media platforms.
4. Google Cohort Analysis
Cohort simply means a grouping of similar people.
It compares what a group of similar customers bought now compared to last week or last year.
Tiny changes can have a big impact on the bottom line.
This report helps analyze trends and patterns to help show you which changes resulted in different results.
Comparing traffic or time spent on a page from now compared to a year ago might not be very relevant if it has undergone a huge visual change in the meantime.
Cohorts can help add context.
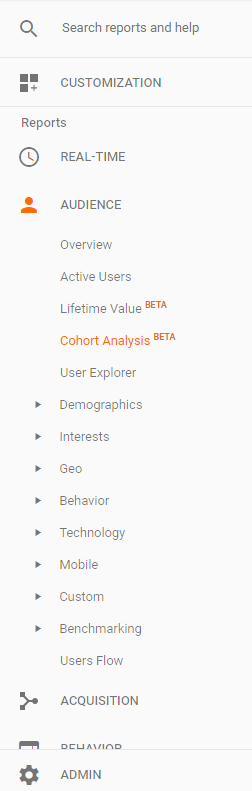
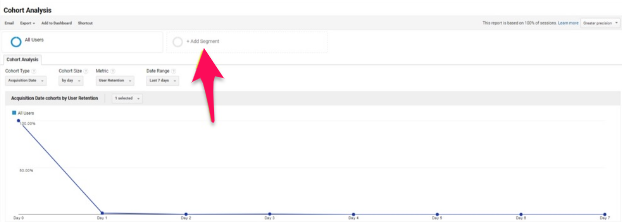
Pull up Google Analytics, click the Audience drop-down in the left-hand sidebar and look for Cohort Analysis:
Here’s how the Google Analytics cohort analysis report will look like at a glance:
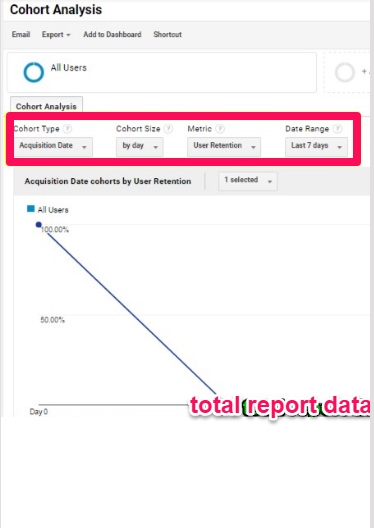
I selected Acquisition Date for this cohort type, so the graph sorts it that way.
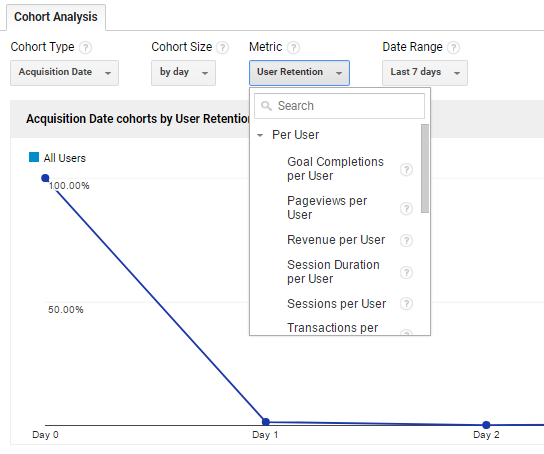
Here are the main factors you can analyze using cohort reports:
- Acquisition Date
- Metrics by category
- Goal completions
- Pageviews
- Revenue
- Session duration
- Sessions
- Transactions
- User retention
- Total users
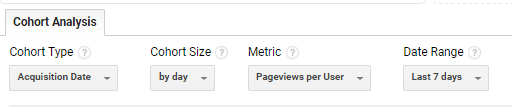
If you want to know how many pageviews each user had by day for the last seven days, you simply enter the following into the drop-down menu:
Which brings up the related graph:
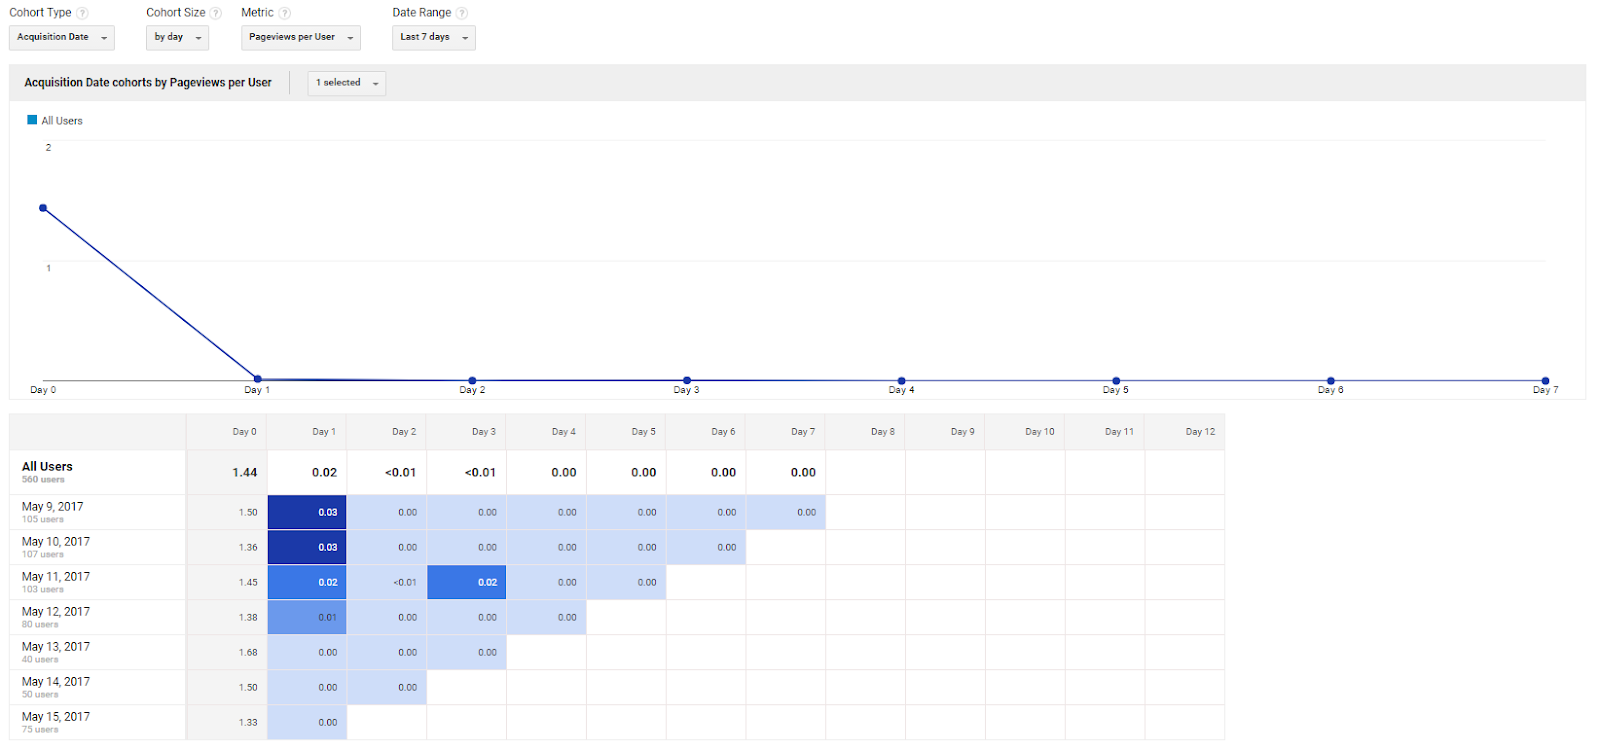
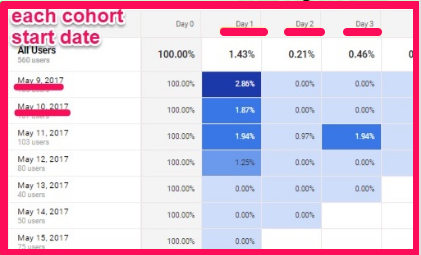
You will see:
- The May 9th cohort of users had 1.5 pageviews per user
- That same May 9th cohort also had an average of 0.03 pageviews per user the next day (Day 1)
This means only a tiny percent of first-time visitors are returning the next day.
You’re probably wondering what you can do with this info.
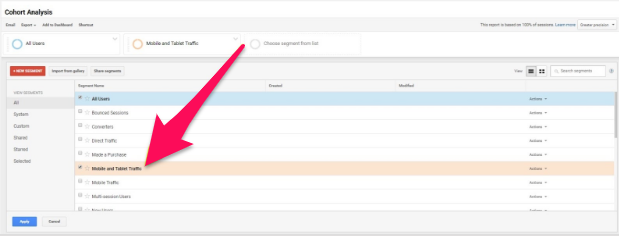
To obtain actionable data from it, Google Analytics allows you to break it down further.
At the top, you can add different segments to break down our report further:
You can select Mobile and Tablet traffic, for example.
Now you can see a comparison from your original dataset vs. the Mobile and Tablet traffic:
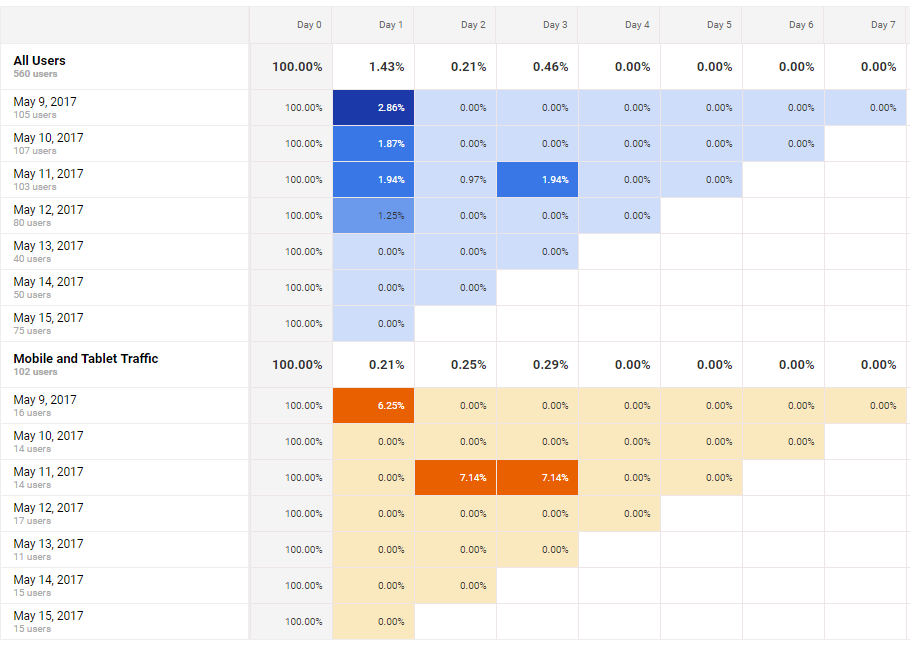
You can see that the report is now showing groups or cohorts of people by date, and it has separated out mobile and tablet traffic.
It illustrates the percentage of visitors that came back to your site the next day, broken out by device.
This may indicate that your site is mobile friendly or is appealing to the mobile crowd in some way.
Of course, our conclusions are limited because it’s a tiny sample of a small date range.
Hopefully, you can see the potential here.
5. Daily eCommerce Traffic Report
This report is essential for e-commerce sites.
It gives you a complete at-a-glance overview of your performance per source.
You can import this report directly.
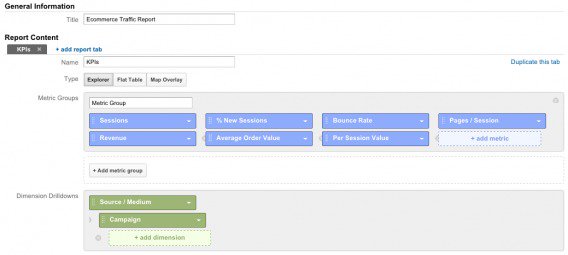
You can also add the conversion rate metric.
When you drill down, you’ll be able to see specific campaign information.
Here’s how your report will look:
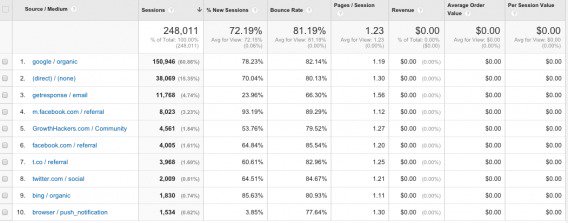
“Average Order Value” and “Per Session Value” are very powerful.
They allow you to measure how buying behavior changes depending upon the traffic source.
This way you can see how your social media traffic is performing and make sure your social efforts are being rewarded.
Social Media Custom Reports
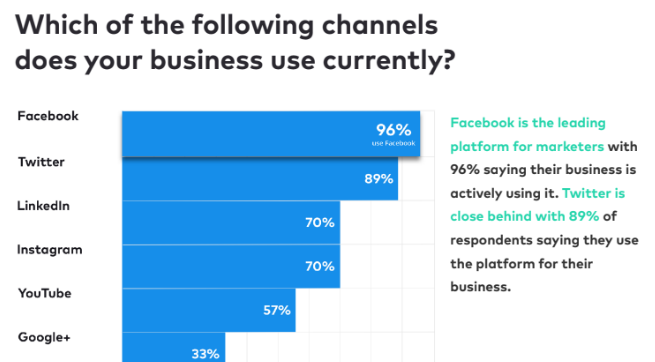
The largest social media platforms are now offering their own free analytics reports.
Facebook is currently boasting the most powerful analytics reports.
It’s not really surprising since they’re the leading platform for marketers.
I’m going to walk you through 5 social media reports you can use to monitor your social strategy on each individual platform.
I’ll use Facebook as an example but keep in mind that other platforms such as Twitter and Pinterest offer similar reports.
6. Real conversions
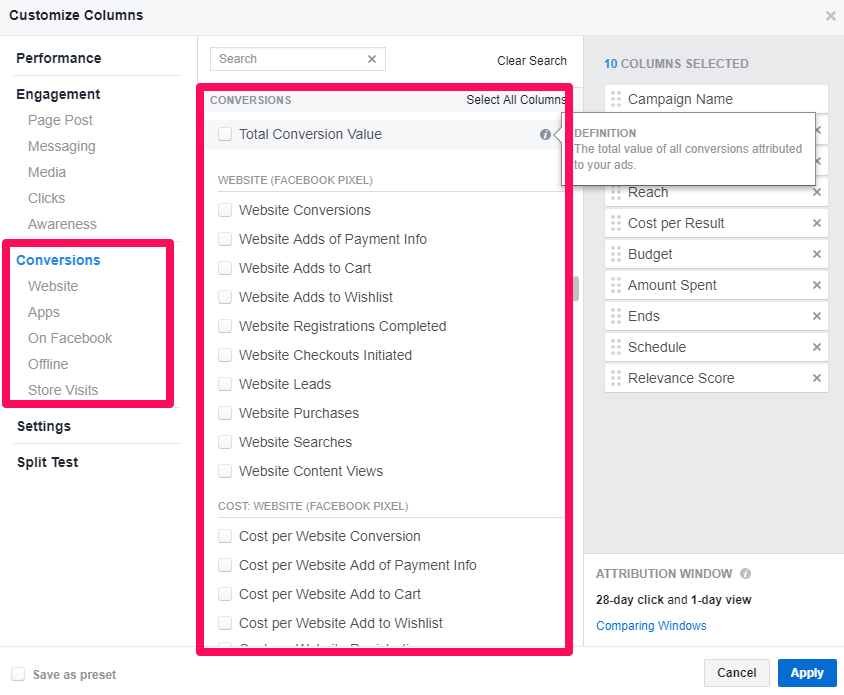
Your Facebook Ads Dashboard offers a ton of potential metrics you can report on.
You can find them all under the ‘Customize Columns’ option.
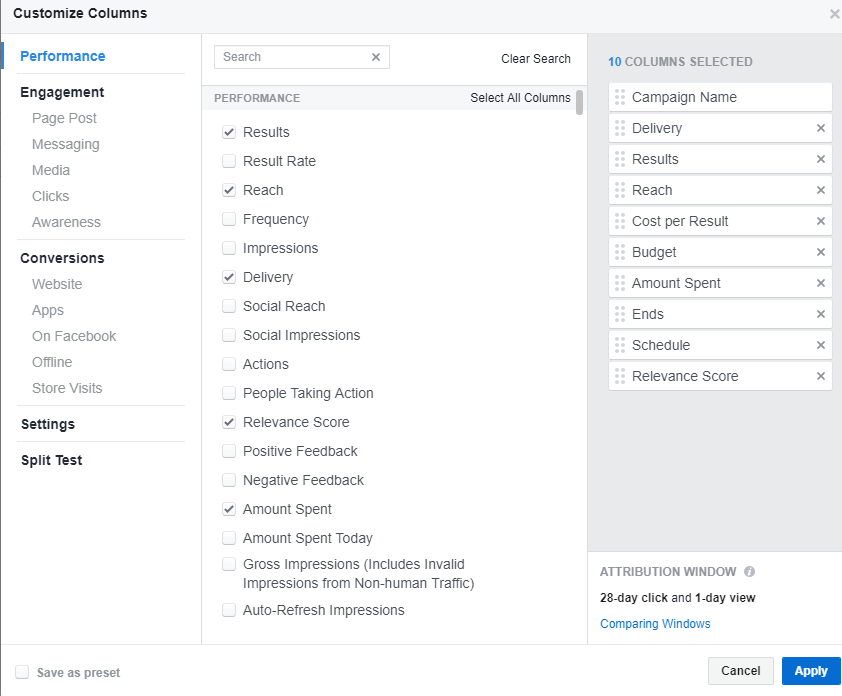
If you tried to run reports on all of these, you wouldn’t have any time left to run your business.
I recommend you just focus on the main reports. Don’t get sidetracked by vanity metrics.
The first one you should be reporting on is conversions.
This should be your main focus.
Conversion reports tell you how often your ads are making people complete the action you wanted them to.
Remember that conversion rate is more important than conversion number.
5 clicks and 5 conversions is incredibly more significant than 1,000 clicks and 5 conversions.
Conversions are also one of the only metrics that you can easily tie back to ROI to understand Ad performance.
Conversions on Facebook are diverse and not every metric gives the same value.
For example, the Ads Manager allows you to track tons of different conversion-style metrics:
You want to focus on conversion metrics that tell you end-goal results.
Depending on your goals, you should be tracking metrics like website leads, website purchases, and website conversions:
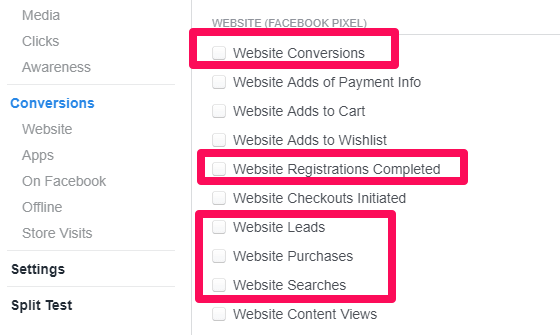
These all tie back to sales and ROI so you can easily tell if your social strategy is working.
7. Cost Per Result (CPR) Report
Conversions should be your starting place, but they’re not enough on their own.
You can’t just base your efforts on how many sales your campaigns bring in.
The problem with looking at just sales is that it can easily lead to you spending too much.
What happens if you spend $1,000 to promote your product and it only brought in $800 in sales?
Even though you increased your sales, you actually just cost yourself $200.
Cost per result helps you understand how much you’re spending on each conversion.
When you log onto your Facebook Ads Manager, the report will look like this:
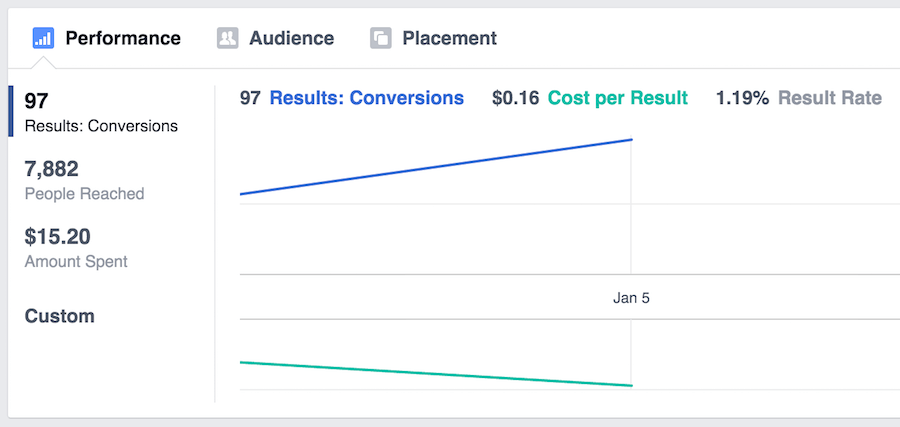
The lower your CPR is, the more efficient your ad campaigns are.
High CPRs tell you that you are spending too much money on acquisition, which hurts your profits.
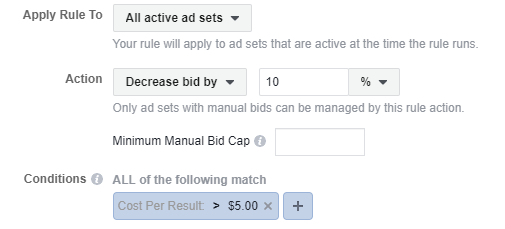
You can monitor your CPR and prevent it from getting too steep by creating a new rule in your Facebook Ads dashboard.
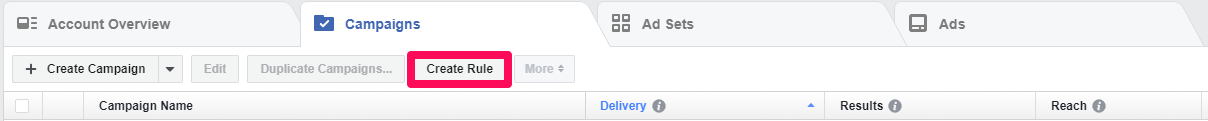
Go into your Campaigns, then ‘Create Rule.’ Then select ‘Conditions’ and change your chosen action to be ‘Cost Per Result.’ 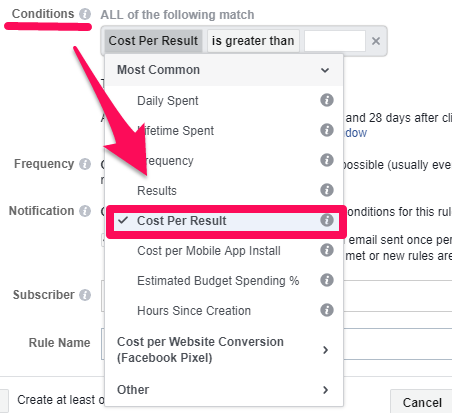
Once you’ve done that, choose a value for your condition criteria. 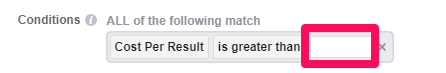
This number should be whatever amount you’re not willing to spend more than per sale.
If your product costs $50, you wouldn’t want your cost per result (conversion) to be greater than $50.
Then decide what the action will be if your cost per result is greater than that specified number:
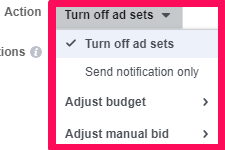
For example, if your cost per result goes too high, you can do any of the following:
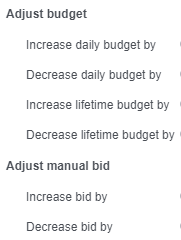
Once you’ve selected your appropriate response, here’s what it should look like:
Cost per result is just as important as conversion metrics.
It warns you if you are spending too much to acquire conversions and can help you manage your ad spend.
8. Ad frequency reporting
If you have a daily Facebook Ad spend of $50 or more, this metric is definitely one you should track.
Your Ad frequency is how many times a single consumer sees your ad over the course of the campaign.
This is something you need to track since no one wants to see something too many times.
Your audience can actually get annoyed by you and react unfavorably if they feel like they see your ads too often.
According to Ekaterina Konovalova, a frequency of 10 results in the lowest possible relevance score.
This means that if a single viewer sees your same ad 10 times, they will respond negatively.
The more you show them the ad, the more annoyed they can become, resulting in a lower relevance score and higher costs.
AdEspresso found similar data on how devastating ad frequency can be:
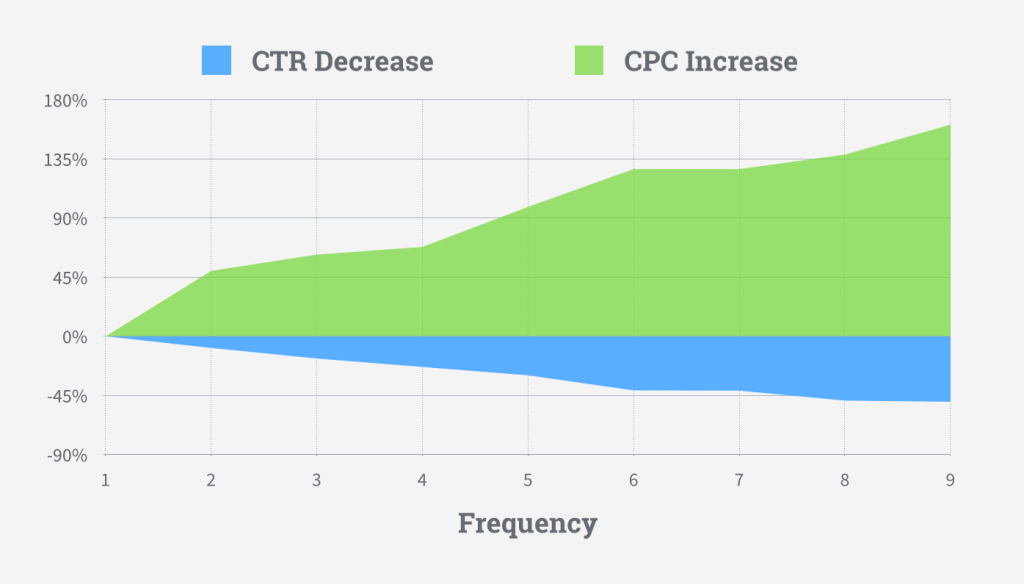
As frequency increases, CTR decreases and cost per click increases.
According to AdEspresso’s results high frequency leads to a steep increase in CPC and a nosedive in CTR after just four views.
To get started, navigate back to your Facebook Ads Manager and create a new rule:

From the dropdown list select “Frequency” as your new condition:
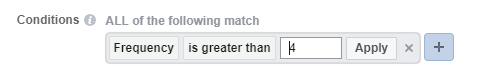
Apply “4” as the greater-than value.
This will guarantee that once your frequency passes 4, your end action will automatically kick in.
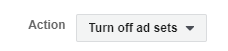
For the action, I’d recommend pausing the ad set:
Frequency reporting and control is crucial for lowering ad costs, staying in the good graces of your customers, and increasing conversions.
9. Click-through rate (CTR)
Click-through rate (CTR) is a simple yet critically important metric.
Facebook describes it as the number of people who clicked your ad, relative to impressions.
It is calculated by taking the total number of clicks on your ad and dividing it by the total impressions.
Why is CTR so important?
A high click-through rate tells you that a high percentage of the people seeing your ad are taking the desired action.
This means you’ve put the right content in front of the right people and you’ve done it in such a way as to make it elicit responses.
You know your offer is good enough to get people to drop what they’re doing and click your ad.
If your ad CTR is low, it’s telling you that something just isn’t working.
CTR packs tons of data beneath the surface of what seems to be a vanity metric.
According to WordStream’s 2017 Facebook Ad CTR Study, the average CTR in Facebook Ads across all industries is .90%:
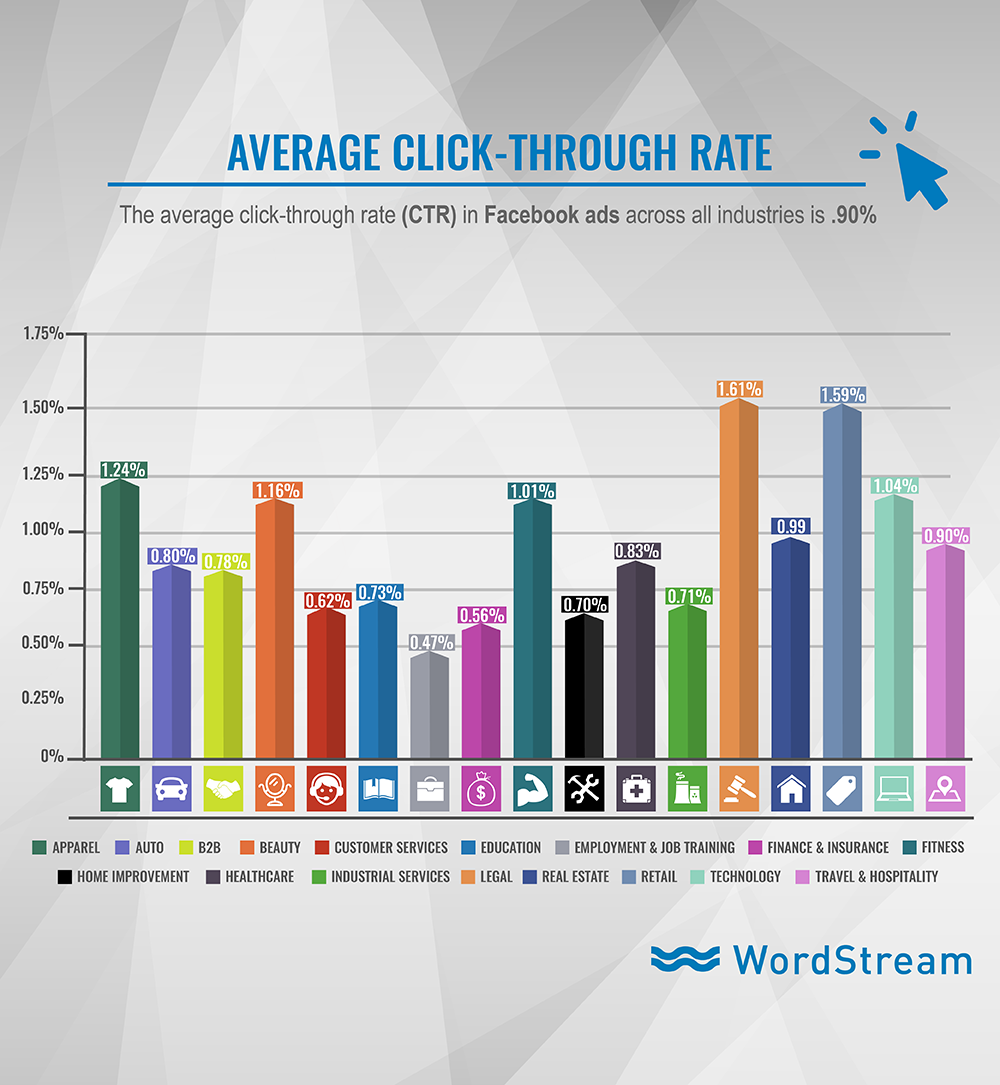
If your CTR is even in the 2-3% range, you have struck gold.
Keep in mind that the average CTR for e-commerce and retail ads is under 2%.
This means that a ‘high’ or great CTR is 2% or more. Don’t expect click-through rates in the double digits.
If one of your campaigns suddenly starts showing CTRs of 2% or more, you need to take advantage of it.
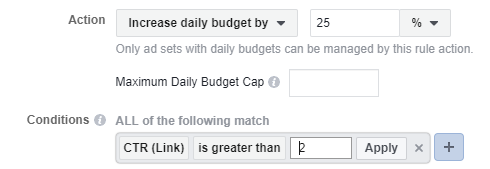
We know 2% or more is good.
So, for example, you can create a rule like this one that will automatically increase your daily spend by 25% if your CTR jumps over 2%.
Why increase your budget?
You know this ad is working and a higher than average amount of the people seeing it are taking action. You don’t know why.
Since you don’t know why there is no guarantee that extending the campaign will extend the CTR rate.
CTR is extremely informative for understanding how well your ads resonate with your audience.
Be sure to track this in your next advertising report.
10. Focus on PPC
When you shift from “more is better” to “being more specific is better,” you start to drive more sales with less traffic.
To do this, perform a basic audit of your current pay-per-click platform and campaign.
The goal is to look for indicators of wasted ad spend or a focus on the wrong metrics.
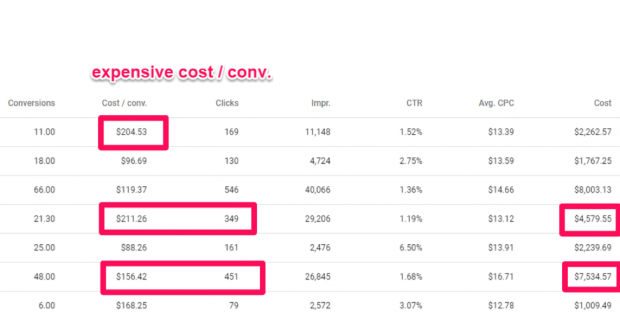
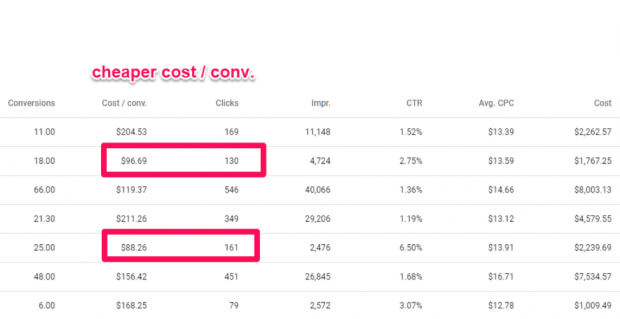
Look at your overall campaign dashboard for current keywords or ads and look for trends in traffic and sales:
Do you notice any trends?
Is there anything glaring that jumps out at you?
One thing I noticed in the example above is that some ads are generating conversions, but they are crazy expensive compared to others.
This might point to poorly targeted traffic.
In other words, you’re getting a lot of people to see your ads, but they’re not the right people.
Let’s say your audience size is 100,000 people, but your target market was poorly defined.
Since most of those people aren’t going to be interested in your product, you may end up spending $1,000 on an ad campaign, and only 500 people (0.05%) end up converting.
This gives you a PPC of $2.00.
Now let’s say you had an incredibly well-defined target market. Your audience size is only 50,000 but 2% convert. This means you have 1,000 conversions.
Assuming your campaign cost the same, now your PPC is halved (1,000 / 1,000 = $1.00 PPC).
If you see that some of your campaigns have higher PPCs, consider either retargeting them or pausing them.
Focusing on the right analytics can generate significantly more sales with less traffic.
Conclusion
Having a successful social media strategy is critical for business success.
But almost half of all marketers struggle with properly measuring the success of their campaigns.
I’ve now shown you ten different types of reports you can use to see if your social strategy is working the way you planned.
You can start with modifying Google Analytics to make it more powerful. Take advantage of their custom reporting options around attribution, dark traffic, behavior flow, and custom funnels.
Track where people are coming from to your site, understand what’s driving your real conversions, and what your click-through-rates and cost-per results are.
Measure the frequency your audience is seeing your campaigns and how your pay-per-clicks are trending.
Don’t forget the free analysis tools provided by social media platforms.
Use all these little known, free analytics tools, and you’ll see results in no time.
What hidden reports do you use?
Comments (14)