
Google Analytics is constantly lying to you. That’s especially true when it comes to last touch attribution and conversions on your site.
In fact, it’s telling you blatant lies directly to your face.
Those precious conversions and goal completions aren’t what they seem.
Your social media channels are working. Direct visits aren’t really the cause of your top conversions.
Regular conversions don’t tell the whole story.
Merely looking at the end of a buyer’s conversion journey will lead you astray.
You can’t look at the goal completions tab and assume that some mediums performed well while discrediting others.
Reallocation of resources based on this data could, in fact, destroy all of your conversions.
So what do you do?
You need to look deeper and further than last touch conversions. You need to look at the entire conversion process from start to finish.
You need to determine which mediums played the biggest and most important role in really pushing that user over the edge.
Otherwise, you risk dumping money into platforms that don’t actually play a large role, even though they were the “last touch” platform.
You have to remember that last touch conversions aren’t always what they seem.
Here’s why last touch attribution is lying directly to your face and how you can dig for the truth.
What is last touch attribution and does it matter?
Last touch attribution is pretty much just what it sounds like:
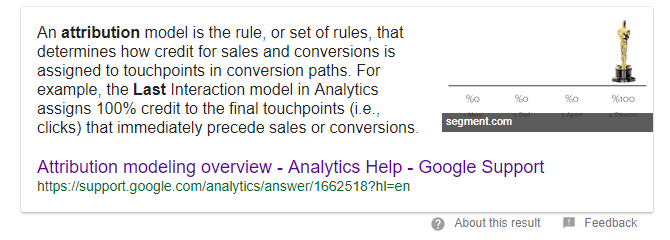
Simply put:
Google Analytics will give conversion credit to the last platform or medium that a user converted from.
Here’s a great graphic that shows how last touch attribution works:
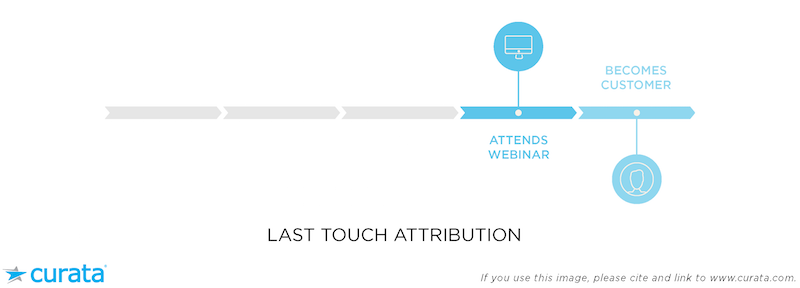
Notice how the graph doesn’t even mention all of those previous steps in grey? Only the webinar will get conversion credit here.
For example, let’s say that you have been running tons of organic campaigns.
You’ve been producing dozens of blog posts every week, which drive huge amounts of traffic.
It has skyrocketed your traffic 10x in the past six months, but Analytics is showing 0 conversions.
You think all that hard work was for nothing. It seems like you wasted tons of money on a failing medium.
You check out Google Analytics and your conversions are all “direct.” In other words, they typed your link directly into their browser and converted.
In this model, it appears that none of your efforts to drive traffic had any impact on your conversions. That’s how last touch attribution works in practice.
So now that you know what last touch attribution means and how it works, why does it matter so much?
Well, take a look at the typical conversion funnel or buyer’s journey:
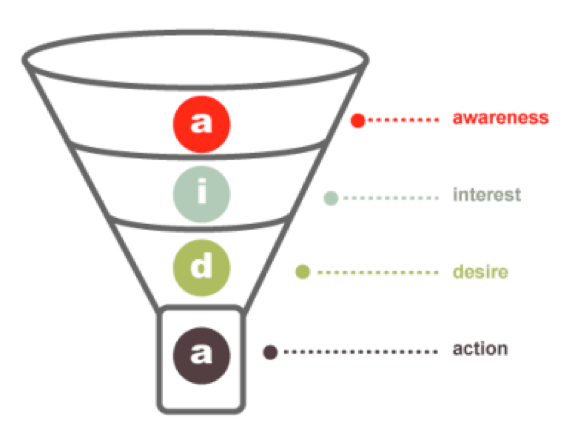
The usual conversion funnel has multiple steps. It takes awareness of a problem, interest in finding the solution, a comparison of solutions, and a final conversion action before you see any real profit.
Even the most basic, simplest buyer’s journey has multiple steps:

Multiple steps mean multiple touch points.
Notice how it’s not as simple as discovering your brand and instantly converting?
Someone doesn’t just do a basic Google or social media search for “SEO agency” to find your brand and instantly buy your services, right?
That means that multiple touch points were involved in their decision.
They probably landed on your site first from a basic Google search or a shared blog post on social media.
Next, they probably read a few more posts and got remarketing ads. Maybe they filled out a form to download your lead magnet.
Finally, after all that time and effort spent investigating your company, they converted via a direct link.
They didn’t conduct a Google search or click an ad or social media post. They typed your URL directly into their browser and converted.
Here’s a typical conversion funnel that I see:
Step 1. The user finds my content via a social link or share or retweet.
Step 2. The user reads that content multiple times.
Step 3. I remarket them with Facebook Ads.
Step 4. They come back and fill out a lead magnet form.
Step 5. They attend a webinar.
Step 6. They convert on a final product.
People often take weeks to convert, during which they’ll land on your content possibly dozens of times.
That’s why you need to look beyond last touch attribution. Otherwise, you only see a small piece of a very large, complex process.
Thankfully, there are a few ways you can overcome the last touch attribution lies. Here’s how you can uncover the truth.
Six ways to overcome last touch attribution
Last touch attribution isn’t the best way to measure conversions. If you do, most of the conversion credit will go to direct visits.
Thankfully, Analytics provides us with more than one attribution model to choose from if you don’t want to use the last touch.
Here are the top attribution reports that Google Analytics offers beyond simple last touch attribution:
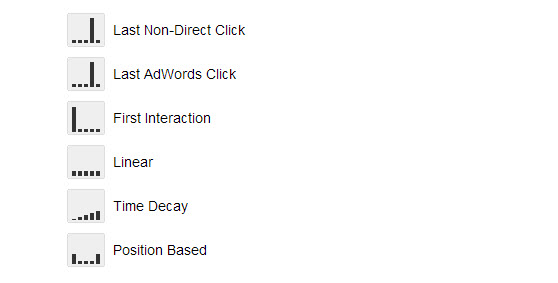
Before we dive into the top four models to use, let’s talk about one model that we should avoid like the plague:
First interaction model.
The first interaction attribution model looks like this:

It’s almost identical to the last touch interaction model:

The only difference is that it flips the attribution.
The first touch interaction is simply the first touchpoint a user makes.
So if someone first discovered you via a paid search (PPC) ad, that channel would get the credit when it comes to a conversion.
On the other hand, last touch attribution would be the last channel.
So we definitely want to avoid both of those, as they are too general and are two sides of the same coin.
Now that you know which models you should avoid, let’s dive into the top four models to focus on.
Here are a few ways to bypass last touch and first touch to find out which mediums are the real drivers of conversions.
1. Linear attribution
Linear attribution modeling is one of my favorite ways to uncover the truth about how your mediums and platforms play a role in the conversion process.
You can’t simply give credit to one platform based on first or last touch. It really doesn’t tell you anything about the buyer’s journey.
It only tells you the introduction or conclusion of a story, leaving the rest as guesswork.
That’s where linear attribution comes into play. It will give you a clear picture of how you’re spending your marketing dollars and how they’re performing.
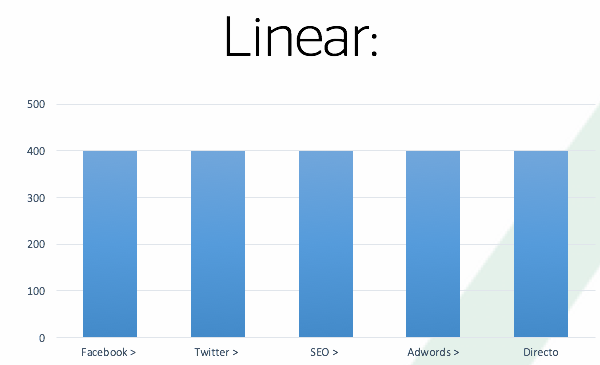
Linear attribution looks like this:
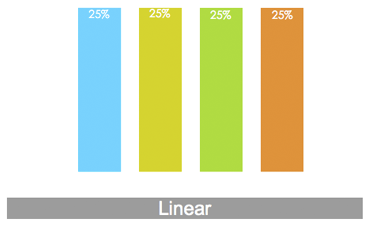
The model gives every user touchpoint in the conversion journey an equal share of the conversion credit.
In this system, your PPC, organic email, and social media would each get a portion of the credit for a conversion:
This model makes the most sense when you think about how a conversion fits within the buyer’s journey.
Every touchpoint that a user makes plays a critical role in their conversion process.
If they didn’t like your social media posts or they weren’t a fan of your blog, they simply won’t convert.
Each medium helped inch that user further and further along until they finally buy something from you.
You’ve always heard it said that social media doesn’t drive sales.
But they’re wrong. They’ve fallen into the last touch attribution trap that doesn’t account for all of the times someone engaged on social before using a different medium to convert.
Think about it:
How often are you asking fans on Twitter to convert? How frequently do you ask them via a Facebook post to buy your product or service or sign as a new client? Probably not at all.
Heck, I never do. Twitter isn’t the place for that.
But that doesn’t mean it can’t play a critical role in the process.
That doesn’t mean that social media won’t be a driving force in brand impressions.
Linear attribution makes the most sense to me.
It shows me every platform that a prospect used in their path to conversion. It shows me what worked to keep them on that path.
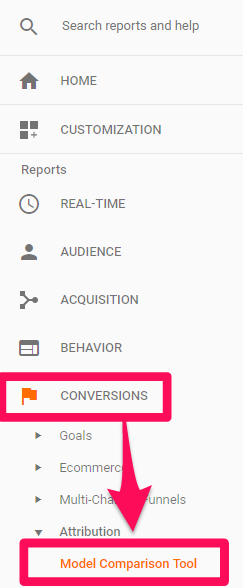
To get started with linear attribution, open up your Google Analytics dashboard and navigate to the “Model Comparison Tool” under the conversion report section:
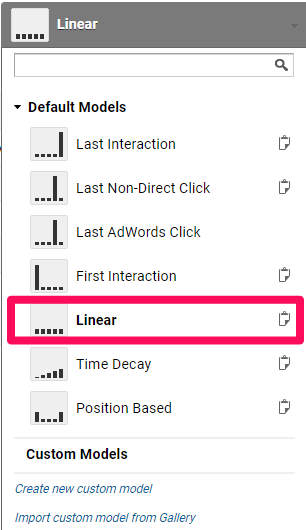
From here, select “Linear” as your interaction model:
Scroll down to the table below, and you can start to analyze the entire conversion path with the top performing channels:
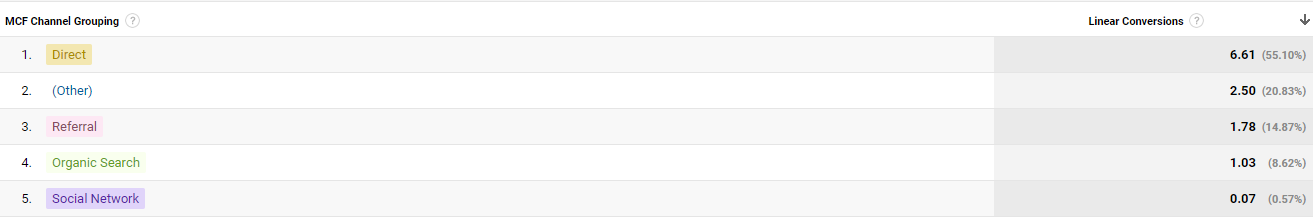
Notice how “Direct” is still getting the most credit? Can you imagine what my last touch interaction model would look like?
It would be entirely direct. Why? Because when people start to know your brand, they don’t search on Google or click on social media.
They type in your link directly!
If you want data that’s more clear-cut, you can change the primary dimension for your table:

Linear is a great way to examine multiple channels to see which helped a conversion.
But linear also falls short in the sense that it still includes direct attribution.
Here’s a second way to overcome last touch attribution and direct attribution at the same time.
2. Last non-direct click attribution
To solve the issues that arise with linear attribution or last touch, you need to be using last non-direct click modeling.
Last non-direct click attribution is simply a model that ignores all direct traffic.
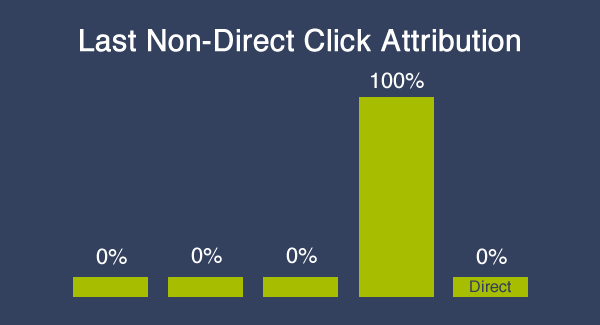
Here’s what it looks like in Analytics:

This is a great model to filter out direct conversions that could be dominating your reports.
It essentially grabs the last touch that isn’t direct:
Direct conversions don’t tell you much.
They only tell you that brand-aware users are converting. They typed in your direct link to purchase your product.
But how did they become brand aware? What steps did they take? What conversion actions besides direct played a role in the process?
That’s what last non-direct click helps you discover.
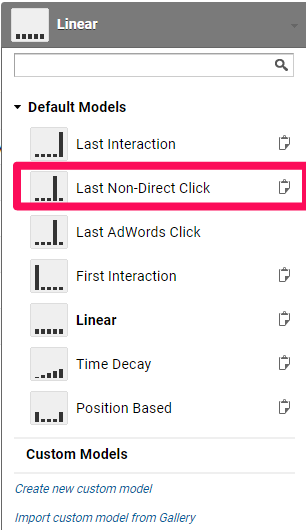
To get started using it, head to Google Analytics under the Model Comparison Tool. This time select “Last Non-Direct Click:”
Check out what happens to my conversion modeling when I choose this attribution method:

Organic searches are now driving the majority of my conversions!
How do I know this? Well, I know that if I chose “Last Interaction,” my conversions would be almost fully direct.
But I need to know what channel came before direct to understand how they became brand aware.
I want to see the actual medium that pushed them over the edge before directly converting.
That’s where last non-direct click comes into play. It shows me that my organic traffic is loving my content and is truly bringing in conversions.
3. Position based attribution
Position based attribution from Google Analytics is another great tool to uncover more data about how your mediums and channels played a part in the conversion process.
With last touch lying to your face, you can’t settle for anything less than a deep data dive.
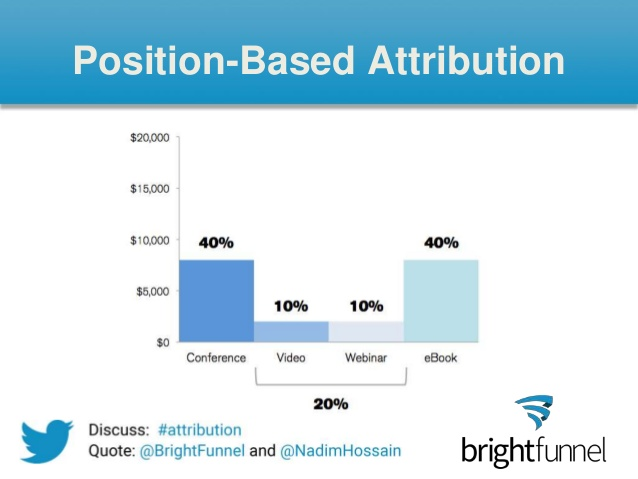
Position-based modeling works by assigning 40% of the credit to the first interaction, 40% to the last interaction, and 20% to the middle touchpoints.
Here’s what it looks like in practice:
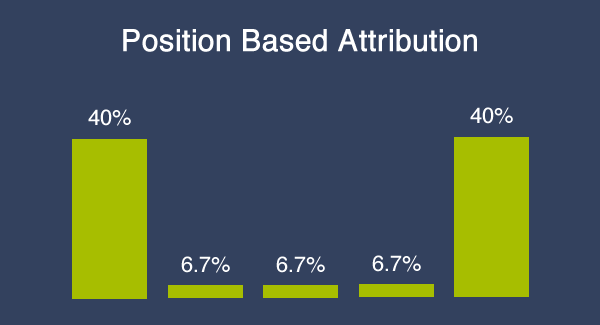
For example, let’s say that someone first interacted with your business through paid search network ads.
That would get a 40% stake in the final attribution process.
Next, they found you via social media and organic search. Those would receive 10% each, which totals 20%.
Lastly, they converted from a drip email campaign that you ran. That would get 40% of the conversion credit.
In the end, you get an even picture of how each channel played a role in bringing you profit for your business:
To get started with position based modeling, select it in your attribution model on Google Analytics:
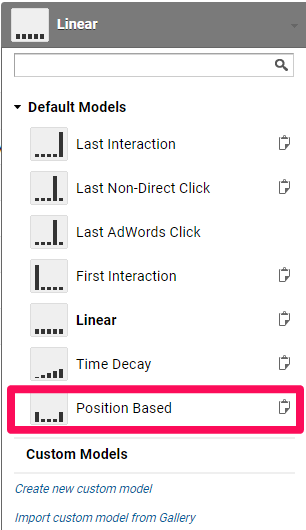
From here, you can examine which channels were first and last touches for conversions:
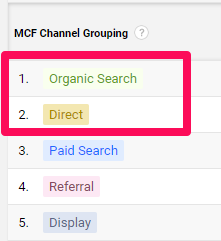
In my case, organic search and direct traffic were the first and last touch points.
Paid search, referral, and remarketing were all in-between points with equal weight in the process.
While my display remarketing ads didn’t convert on their own, they still played a role in building brand awareness.
Referrals didn’t drive immediate conversions, but they helped inch users down the right path.
The whole point of this model is to see the two driving forces of conversions (first and last touch) while still understanding that multiple other platforms helped in the process.
Try using this model to get Google Analytics to tell you the real story behind your conversions.
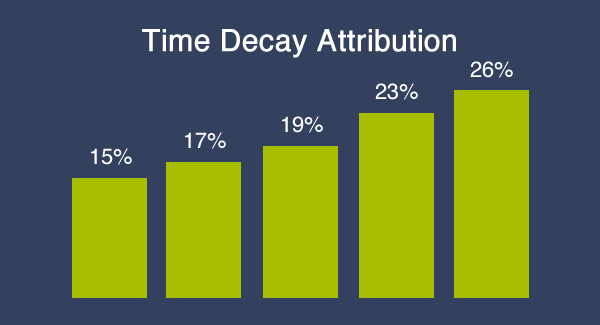
4. Time decay model
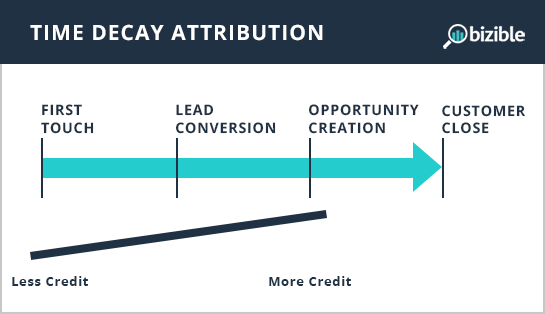
Last, but definitely not least, is the time decay model.
Time decay attribution gives the majority of credit to the touch points that were closest in time to the sale or conversion.
It will give the most credit to those touch points while still giving credit to other channels.
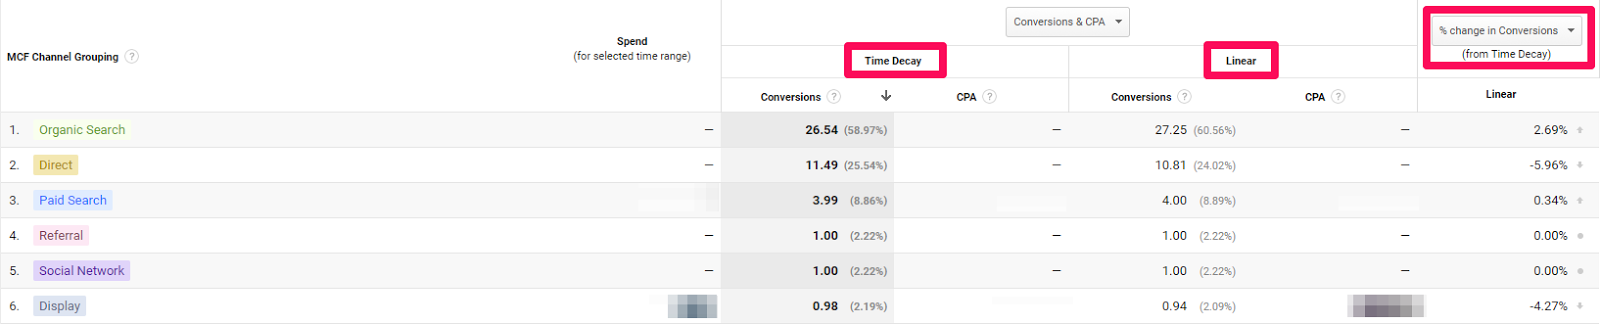
Here’s what it looks like in when you compare the data:
Let me explain this with an example:
Let’s say that you drove tons of organic traffic at first. People were reading your blog posts like crazy.
Next, you remarketed those visitors on Facebook with lead ads. You collected tons of emails to send sophisticated email marketing messages.
A few weeks go by, but nothing happens. You have no conversions, no final sales, and no new clients from this work.
But then, out of nowhere, those users find your brand on social media and convert via a direct visit to your site.
In this scenario, direct and social media traffic would get the most credit, but without neglecting each channel that assisted those conversions over time.
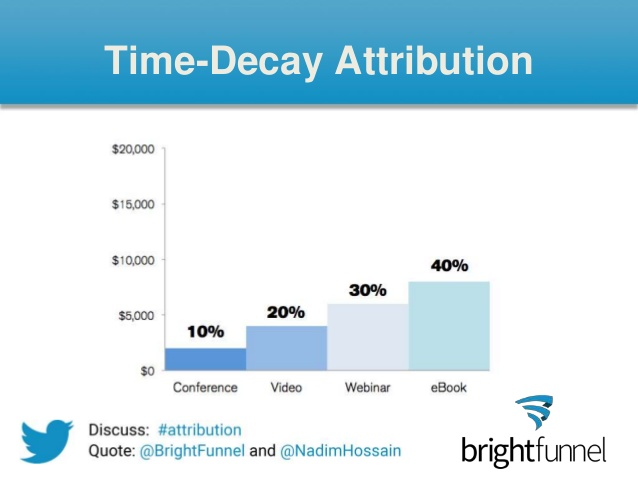
It’s a great model that is a little more sophisticated and in-depth than a typical last touch attribution model because it gives increasing credit at the end:
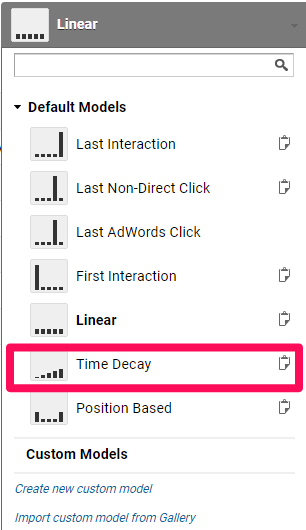
To run a time decay report, select “Time Decay” in Google Analytics to pull up the report:
Here’s what my time decay report looks like:
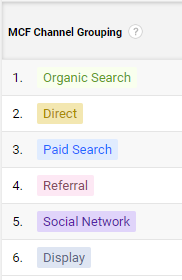
Organic search and direct traffic get the most credit because prospects used them at the time of conversion.
But paid search, referral, social, and remarketing all receive credit along the way, too.
It’s a well-rounded attribution model that can give you more data on where your budget is working.
For example, if you just followed last touch or first touch, you’d start to think that remarketing, social, and PPC weren’t working.
They weren’t the end drivers of sales, so you’d likely stop investing money in them, only to find that they were actually critical to the entire process.
Give time decay modeling a try if you want to understand how people interact with your brand over time.
5. Compare multiple models
Once you’ve explored these four models, it’s time to put them all to the test.
These attribution methods are great for uncovering more data, but they don’t always work.
They aren’t perfect, so you can’t keep using all of these models at the same time. You’ve got to cross-reference the data to find out which models are showing the most accurate picture.
To do this, head to your Google Analytics dashboard under the “Model Comparison Tool” report and select two models to compare:

In the table below, you can see comparison data on each source/medium for both models:
Notice how my data looks pretty similar in time decay and linear?
These two models accurately attribute the conversions over time and in regards to credit.
So, that’s not enough. I need to analyze all of these attribution models at the same time.
Next, add a comparison for position based attribution and last non-direct click too:

Here’s what the data shows me:
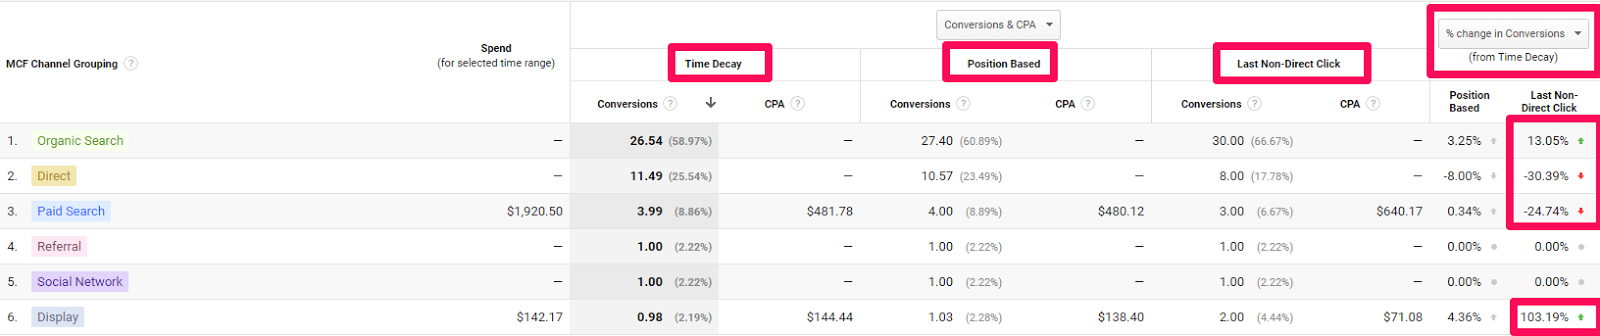
Let’s translate this into English. We can see that, when I factored in last non-direct click and position based, I noticed more conversions for organic search and display remarketing.
Without direct clicks in my conversion data, remarketing and organic conversion credit jumped.
This tells me that both of these mediums are playing a critical role in my conversion funnel.
Though some mediums get less credit in some models, when you compare models together, you start to realize the importance of factors that you couldn’t see before.
It’s one of the best ways to really dig deep with Google Analytics to find out which channels are worth the time and money.
If you run these models and still find that a channel isn’t performing, don’t spend money on it.
If it’s not getting any credit even in a linear attribution model, it’s not producing a profit for your business.
Always remember: Google Analytics isn’t telling you the truth with last touch attribution. You need to push past the surface-level data if you want real results.
6. Use a CRM for full-funnel data
If all else fails and you still can’t figure out which conversion actions helped the user convert, you have one last shot:
Implement a CRM like HubSpot.
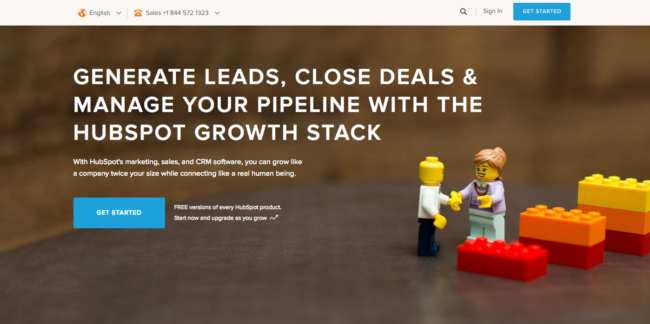
HubSpot is the gold standard when you’re looking for full-funnel explanations.
It tells you every step that a user took to convert on your site.
Instead of just saying that your lead magnet drove conversions, it tells you all of the steps that led up to a lead magnet conversion.
It’s the holy grail of customer management and attribution.
It doesn’t make sense to run a pay-per-click campaign and wonder why your conversions are low when, in fact, they probably aren’t.
Think about it:
If you’re running a hotel advertising campaign via PPC for a client, can you rightfully expect tons of conversions fast?
No, of course not. How many hotels do you explore before finally making a decision?
For me, I browse at least five, and many times 10 or even 15 options.
I’m clicking on a PPC ad but not converting on the first visit. But I may come back and convert later with a direct site visit.
Can you see the point? You need to understand the full funnel, and HubSpot is a great way to do that.
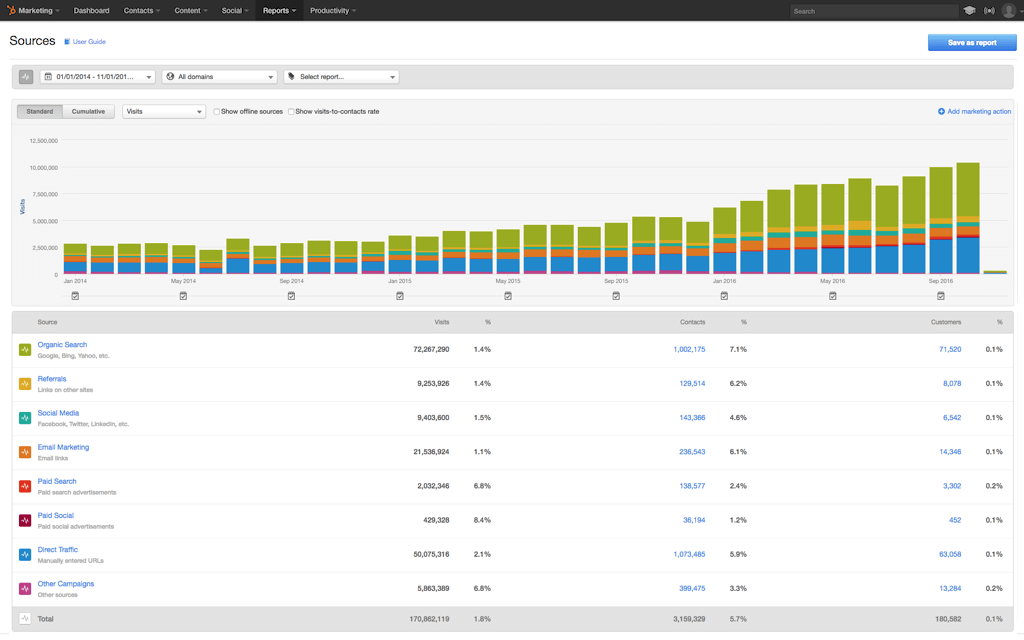
For example, check out the detailed reports you can create when it comes to lead attribution:
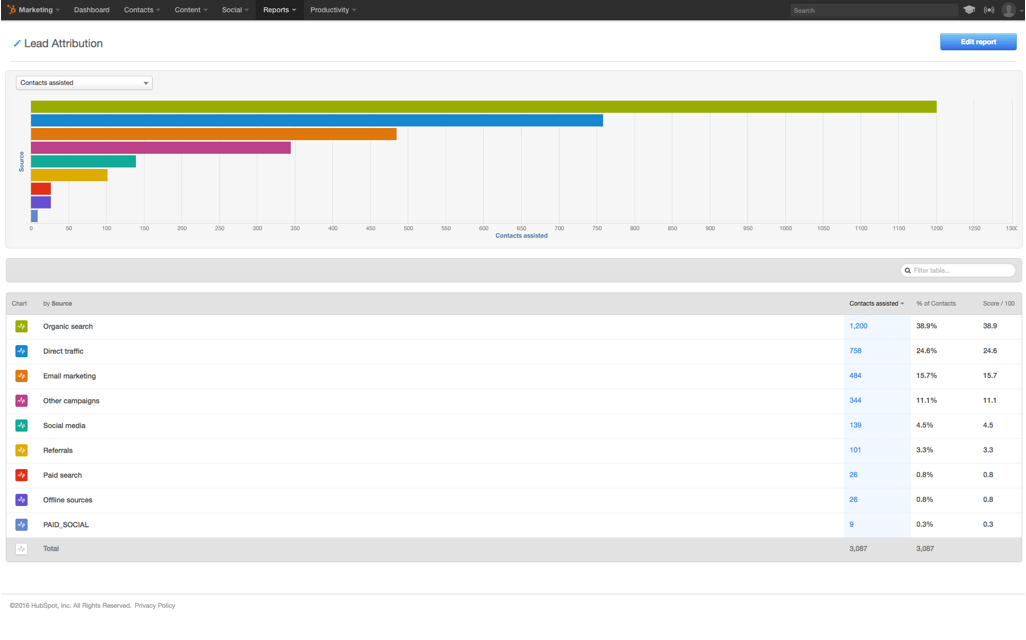
You can see how organic search, direct traffic, email marketing, and more play a role in the process.
It’s a one-stop shop for accurate and precise data.
On top of that, you can explore how specific sources and mediums played a role in the sales journey too:
And that’s not all. One of my favorite features with HubSpot’s CRM and attribution tool is being able to see how specific links helped drive conversions:
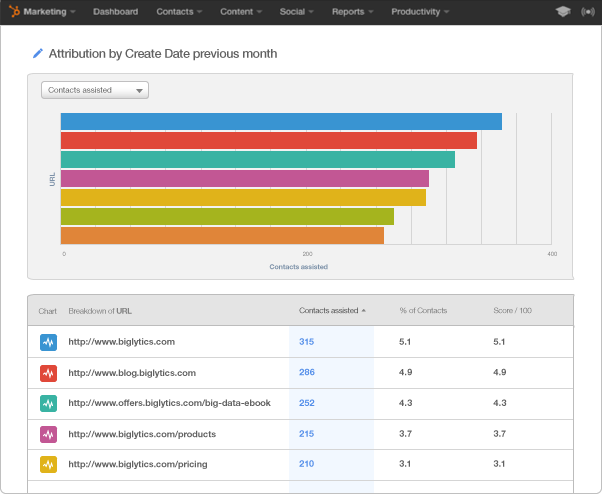
For example, I can see if certain blog posts are key in getting someone to convert on my page.
If a specific long-form post is driving conversions, I can see how that played a role in the final sale when compared to other mediums.
If you can’t seem to find good data on Analytics, I’d recommend trying a CRM like HubSpot (or any other alternative).
It’s nearly impossible to get specific customer data without a CRM. You can usually only get surface-level data, but with a CRM, you can analyze each customer sale.
Go beyond Google Analytics to get key data on how sales arrived.
Conclusion
Google Analytics is a sneaky tool that often lies directly to your face.
That’s not just for traffic and engagement data, either. We’re talking about final conversions too.
Google Analytics gives conversions and goal completions credit by referring to the ‘last touch’ that a user took before converting.
This data can be dangerous. Think of it this way:
Let’s say you ran tons of PPC ads and invested almost no money into social media.
You find that your PPC ads have low conversions. But Analytics shows that direct links and social media are driving conversions.
Based on this data, you take money out of PPC and invest it into social, only to see that your conversions all but disappeared.
Why? Because those conversions were only credited via the last touch, ignoring the fact that PPC drove the best traffic that converted in the end.
Google Analytics is lying to you, especially when it comes to last touch attribution.
Thankfully, you can dig for the truth.
Start by using the linear attribution model. This will give equal credit to each channel that played a role in the conversion process.
Next, use last non-direct click modeling to filter out direct clicks from your conversions.
Be sure to use position-based attribution to give more credit to the first and last touch points while still giving credit to the middle points.
Try using the time decay model to give credit to the channels that were closest in time to the conversion.
If all else fails, compare multiple models in Google Analytics or use a CRM like HubSpot to get full-funnel attribution data.
Uncovering the secrets behind last touch attribution can help you breakthrough deceptive data to see the marketing mediums that help your business consistently grow.
What are the best ways you’ve uncovered the truth behind last touch attribution?
Comments (4)