
I don’t know about you, but I’m always looking for ways to enhance my SEO.
I’ve been in digital marketing for more than 10 years now. I’ve heard thousands of people say, “SEO is dead!”
And it’s still a super important part of any website’s health.
That’s why I like finding new, interesting, and/or little-known methods to improve SEO.
Today, I’m going to share an SEO technique that I don’t hear about often, but it’s done a lot for me.
It’s the Crawl Stats feature of Google Search Console.
You probably know that Google Search Console, or GSC for short, is one of my favorite tools for managing a website.
You’ve most likely used it before. You might even be a GSC expert.
But I’ve realized that with GSC, there’s more than meets the eye.
It has a lot of features that I use, but I don’t see other people using them that much.
In particular, the Crawl Stats feature doesn’t get enough praise.
It’s a tiny page––it only has three graphs and some numeric data. But don’t underestimate it.
It tells you a lot about your site is reacting to Google’s search engine crawler. If you’re looking to maximize your SEO, that’s important information to have.
So I’m going to show you how to use Crawl Stats to beef up your SEO and get insights you might not get anywhere else.
What is Crawl Stats?
First, I’ll give you a rundown on what Crawl Stats is.
To access it, head to Google Search Console and select the right property.
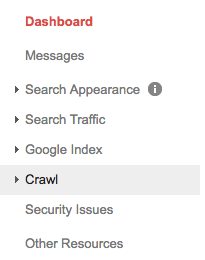
In the sidebar on the left, click on Crawl.
In the menu that pops up below, click Crawl Stats.
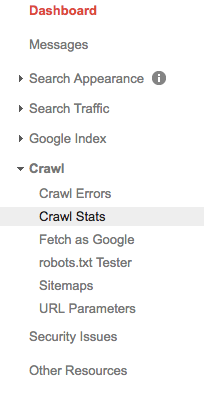
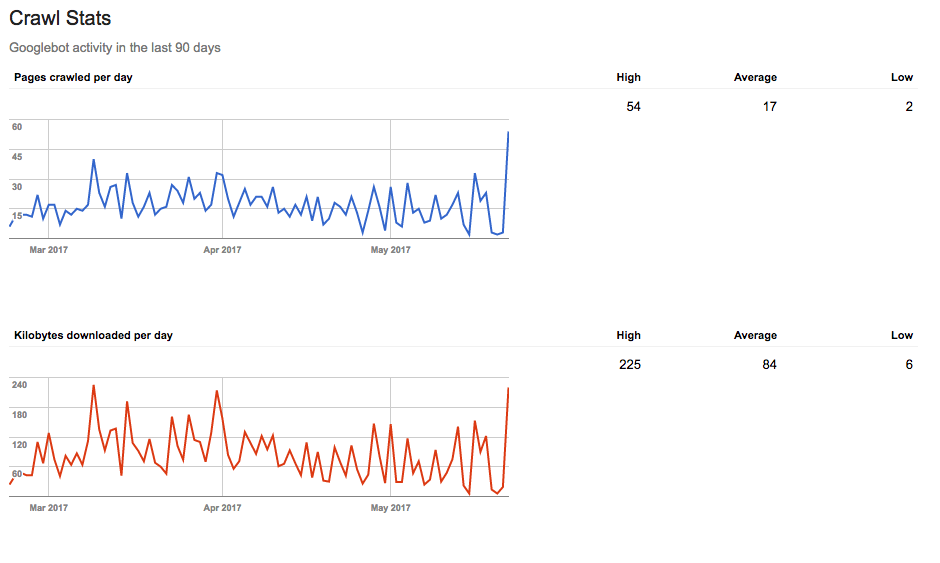
You’re now at your Crawl Stats page! It should look something like this:
I’ll admit that at first glance it doesn’t seem too helpful. It’s not obvious how this data will make your SEO better.
So let’s talk about what these results actually are.
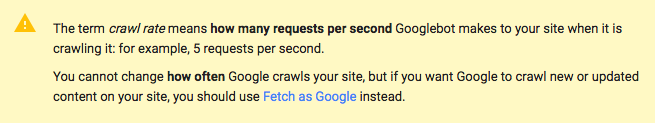
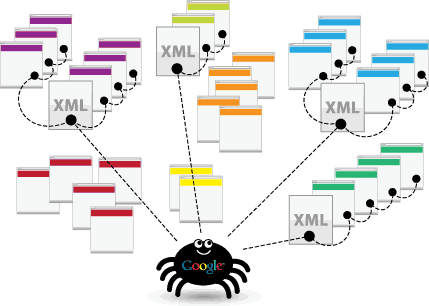
Basically, this data is measuring your crawl rate.
Crawl rate is how often search engine robots crawl your site. In this case, Crawl Stats is showing Googlebot’s (Google’s search engine robot) activity.
A fast crawl rate is almost always desirable. That means the bots can index your site more easily and more quickly.
And if your site gets more attention from Googlebot, you’ll likely earn a higher SERP ranking.
In a nutshell, that’s why the Crawl Stats data is so important. If your crawl rate is low, your SEO is taking a hit.
On the other hand, if your crawl rate shoots up all of a sudden, something could be wrong with your site.
The point is, it’s important to monitor your crawl rate.
That said, these graphs might not make sense to you at first, and that’s okay!
So let’s look at how to interpret them.
How to read the graphs
There are three main sections of the Crawl Stats page:
- Pages crawled per day
- Kilobytes downloaded per day
- Time spent downloading a page (in milliseconds)
They’re all important to getting the most out of Crawl Stats, even though it might not seem like that. So you really should consider all three every time.
I’ll tackle each section separately.
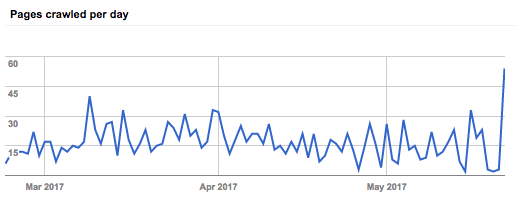
Pages crawled per day
This section shows you how many pages Googlebot crawls every day. You’ll see results from the last 90 days:
If you want to find a specific point in time, you can hover your mouse over the graph and view results for a particular day:
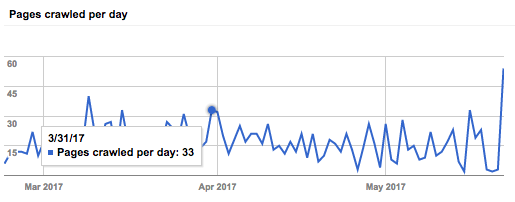
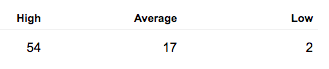
On the right side, you can see your high, average, and low crawl amounts.
Here’s the tricky part.
Crawl rate is different from a metric like Domain Authority. That’s because you can’t change how often Google crawls your site.
What you can do is understand why there might be fluctuations in your graph, especially if it goes from really low to really high in a day or two.
Because crawl rate depends heavily on how fast and bot-friendly your site is, crawl rates are good indicators of whether or not your site is easily crawlable. (And you want it to be!)
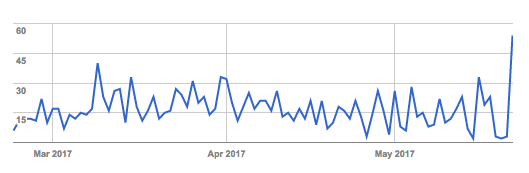
That means you want consistent crawl rates. That should look roughly like this:

There are some ups and downs, but it stays right around the same spot on average.
If you see something that looks more along the lines of this:
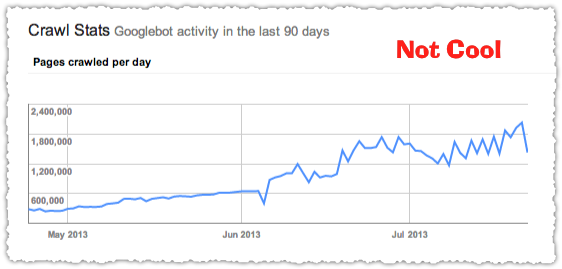
Then there’s a problem.
Generally, your graphs will all look relatively similar. However, the pages crawled per day graph is the one you want to focus on for crawl rate.
Super sudden drops or spikes are both signs that something’s probably up with your site.
You might be looking at that right now. What should you do?
Let’s look at each scenario.
If you see a sudden drop, one of the following things could be happening.
1. You might have broken code (like HTML) or unsupported content on one or more of your pages.
If you’ve recently added new code, this could be the problem.
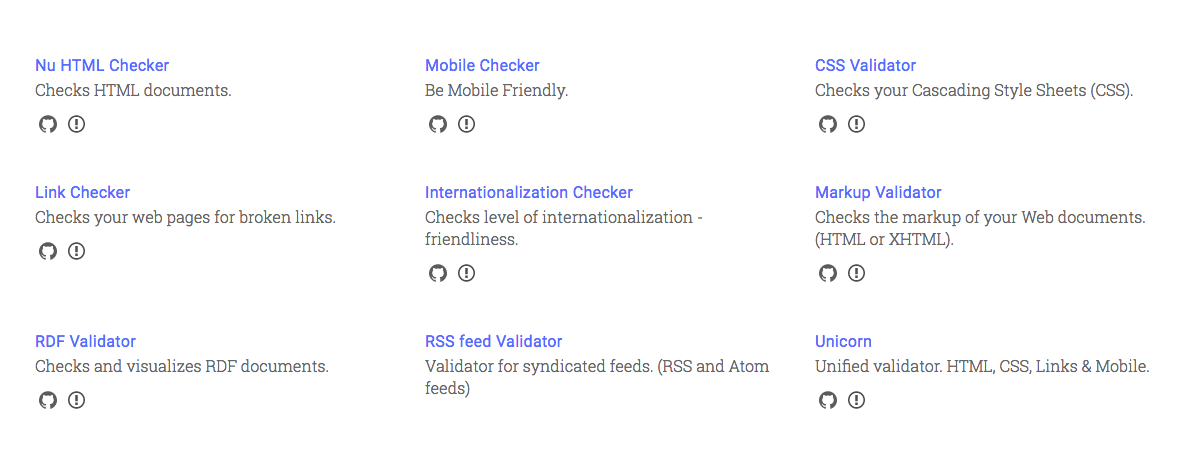
You can run your code through one of W3’s validators to see if it’s working correctly or not.
2. Your robots.txt file might be blocking too much.
It’s a good practice to carefully modify your robots.txt file, but you can actually block resources that Googlebot needs to crawl your site.
If your robots.txt file is huge like this one:
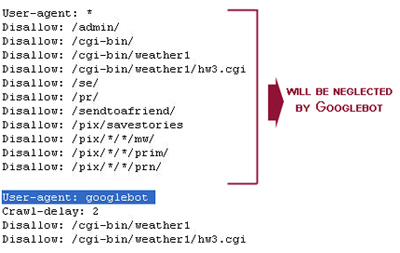
Then you might want to revise it.
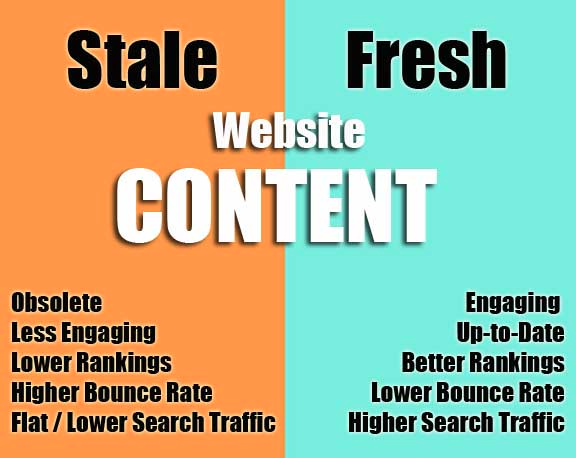
3. Your site has stale content.
It’s no secret that Google loves fresh content.
Here’s how it works (in theory, at least): When you make a change to a page on your site, Google is alerted of that change and recrawls your page.
Every time Googlebot crawls one of your pages, it reindexes your page.
And if your page is super high quality, you’ll likely get a ranking boost from it.
But if your site has old content, it’s not going to get crawled as much, and your crawl rate will go down.
Trust me, you don’t want that.
There’s no reason you shouldn’t be constantly updating your site with new and helpful content.
If your site has old content, I’d be willing to bet you’re getting less frequent crawls and less views and clicks on your site.
Remember, maintaining your site isn’t just for search engines. It’s for your users too.
So keep publishing new content, and you’ll be rewarded with more consistent crawls and more eyes and clicks on your site.
If you see a sudden spike, one of the following may be happening:
1. You just added a bunch of new content or code to your site.
Even if you’re not actively trying to get crawled, you just might be, especially if you added a lot of something to your site.
That something could be content or code.
So if you see your crawl rate go through the roof right after a site upgrade or something similar, that’s probably why.
2. Your robots.txt file is allowing bots to crawl a lot of your content.
If you’ve never made a robots.txt file, you either don’t have one or have a very basic one.
In both situations, that means search engine bots are crawling all of your content.
Is that desirable? Yes and no. It all depends on what you want the bots to do. See my article here for more details.
Those are the main reasons for crawl rate drops and spikes.
Like I said, in general, a consistently high crawl rate is a good thing.
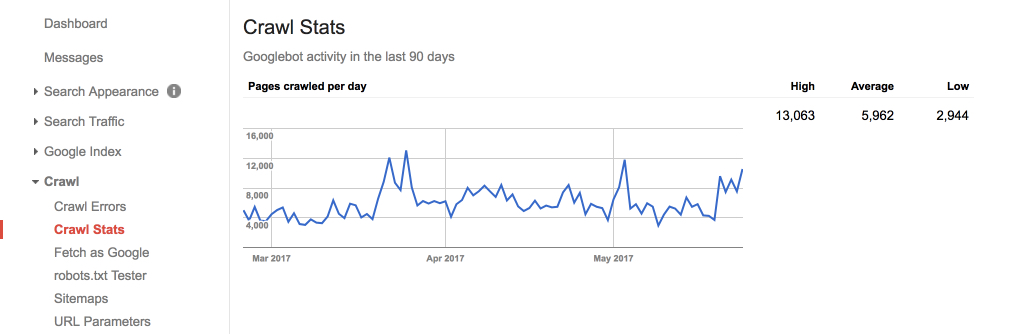
Your graph should look something like this:
If you have more peaks or valleys, don’t worry about it.
But if you see extended periods of inactivity…
…or a gigantic and dramatic change…
…that means something’s going wrong, and you should troubleshoot.
One last thing: Use the averages on the right side to find your site’s specific average.

There’s no specific formula; it’s something you have to look at over time.
Since Crawl Stats only fetches data from the last 90 days, you can test compare 90-day periods to see a big picture overview and calculate your average.
It sounds funny, but here’s what I’m talking about.
Let’s say you record four 90-day periods, and you have high averages of 40, 52, 49, and 45.
That means your overall high average for the year is about 46.5.
You need to monitor your crawl rate during individual 90-day periods and over several 90-day periods.
My current average for this 90-day period is 5,962.
My site is content-heavy because I publish several times a week. Don’t be discouraged if your numbers aren’t close to mine.
If your site is newer or has fewer links, it’ll probably get crawled less. That’s okay. As your site grows, so will your crawl rate.
In conclusion, the Pages crawled per day graph is one of the most useful parts of Crawl Stats. In fact, I’d say it’s the most important.
How should you optimize your crawl rate?
If you notice your crawl rate is slow or just plain inconsistent, you need to create a plan to ensure a solid crawl rate.
You still need to fix crawl rates that are too fast or too slow, but more importantly, you need to optimize your site for a good long term crawl rate.
I’ve already touched on one way to do crawl rate optimization: Fresh content.
The more content you publish, the higher crawl rate you’ll have.
But that’s not enough.
Google’s bots use complicated algorithms to determine the quality of your site.
So the better your content is, the more likely Googlebot will give you an advantage on the SERPs.
One way to ensure this is to create long, comprehensive content. It’s proven to rank better, and your flesh and blood users will love it too.
But there’s also a couple of tricks you can use.
One comes from Brian Dean of Backlinko.
His idea is to republish your old content. It’s a genius idea because you get more mileage out of content you’ve already created.
Your users will see your content like it was just published:
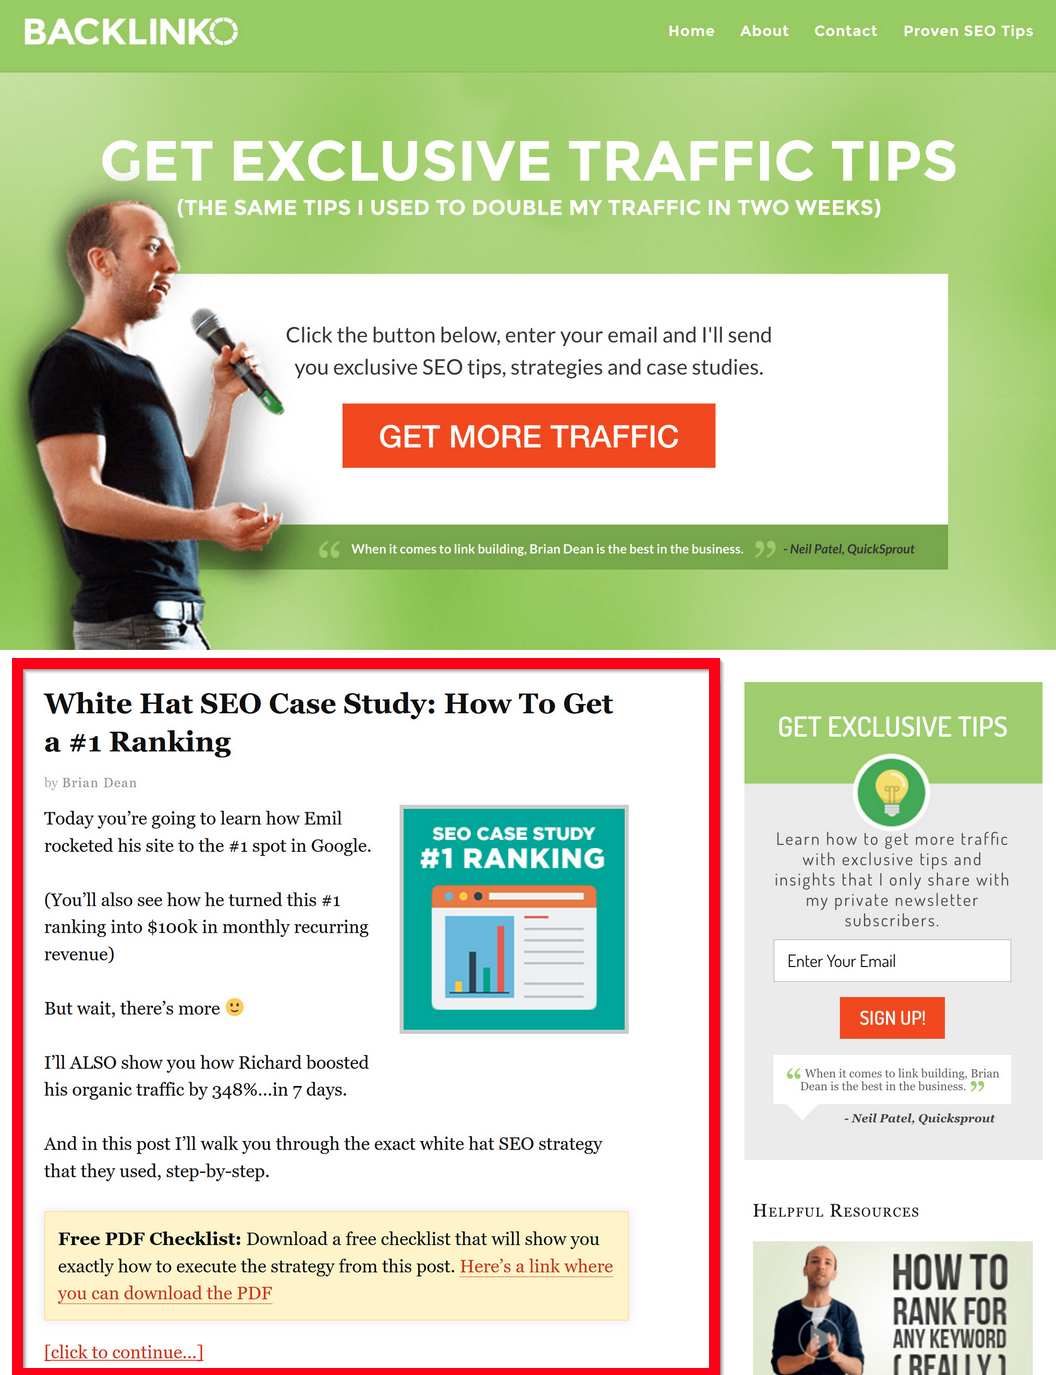
But it’s actually old content.
Because you’ve updated it, Googlebot will crawl it again, and your crawl rate will naturally go up.
Most of the time, fresh content will solve all your problems. But if you’re not seeing the results you want, try refreshing and republishing your older content.
Kilobytes downloaded per day
You’re probably wondering what the heck this even refers to. Kilobytes of what?
Well, every time a search engine robot visits your site, it downloads your pages during the indexation process.
This metric reflects how much Googlebot downloaded in kilobytes.
This number depends entirely on how big your site is. If you have a smaller site, it won’t download as much, and vice versa.
This is probably the least useful part of Crawl Stats, but you can draw some conclusions from it that actually help analyze your site’s performance.
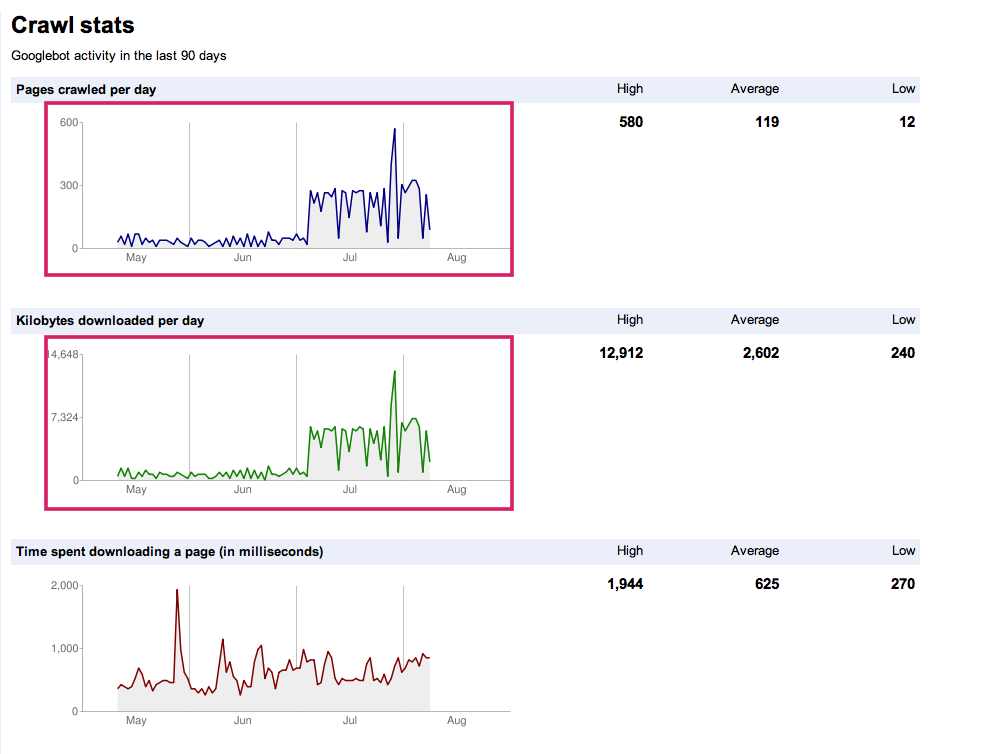
If your graph is consistently high and you have high averages:
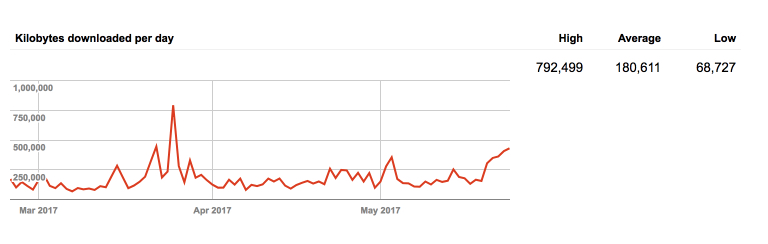
That means Googlebot is crawling your site often.
Since Googlebot downloads your pages every time it crawls your site, a high number here means that Googlebot is crawling your site quite a lot.
However, having a high average here is a bit of a double-edged sword.
That’s because it also means it’s taking awhile to crawl your site. On the other hand, having short download times means your site is lightweight and fast to crawl.
That’s why I recommend using this graph with the Time spent downloading a page graph to see how fast Googlebot is crawling and indexing your site.
You also can use this graph in conjunction with the Pages crawled per day graph to see how much Googlebot likes your site overall.
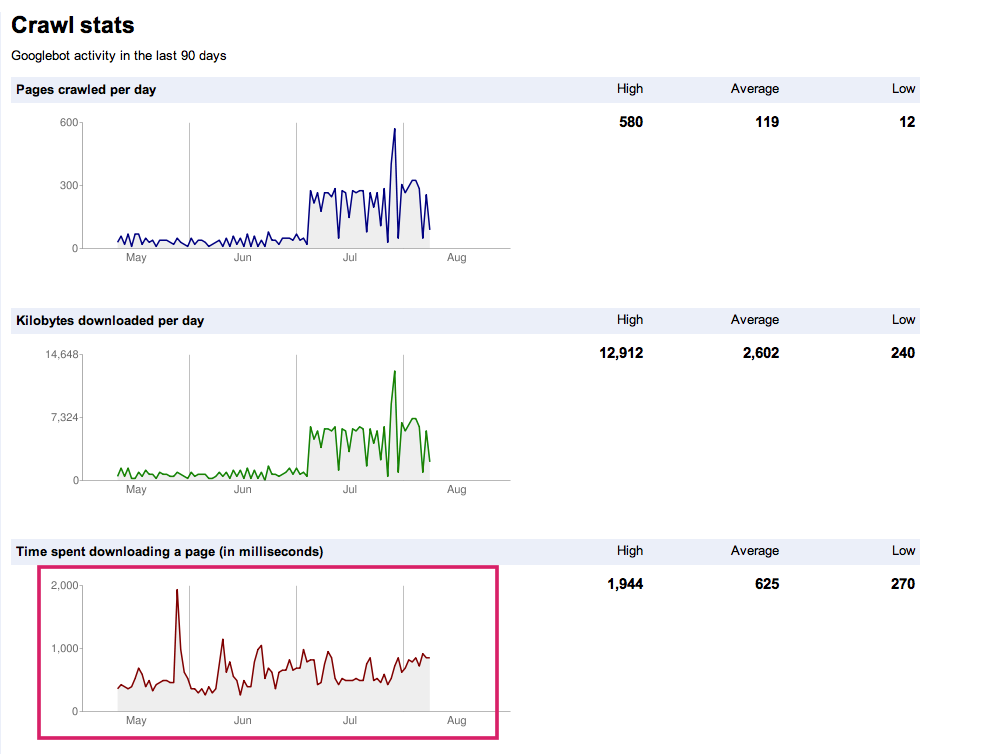
Time spent downloading a page (in milliseconds)
This one is a little bit misleading.
You probably think it has to do with how fast your site speed is.
Site speed is definitely important, but that’s actually not at all what this section measures.
According to Google’s John Mueller, all this section tells you is how long Googlebot takes to make HTTP requests to crawl your site.
Pretty anticlimactic, I know.
But you can still use this information.
You want to shoot for low numbers here.
Low numbers mean that Googlebot isn’t spending a lot of time on your site and thus crawling and indexing it at a faster rate.
There’s not really anything you can do to change this metric, but it’s a good reflection of how quickly Googlebot is indexing your site.
I mentioned using this together with the Kilobytes downloaded per day graph. Here’s how to do that.
Take a look at both your Kilobytes downloaded per day and Time spent downloading a page graphs and averages.
Let’s say you have these two graphs:
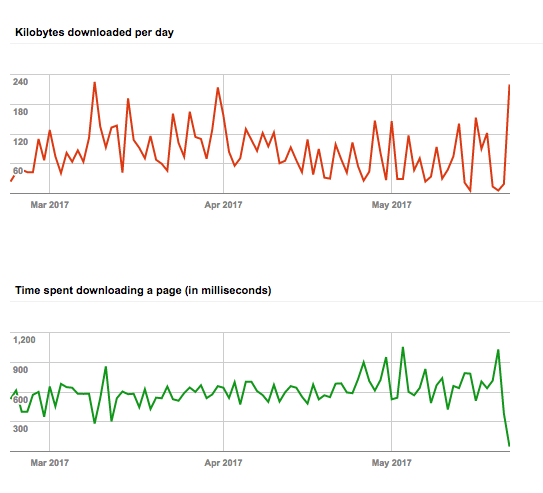
You have to think about how these graphs relate to each other.
If both graphs are pretty high, that means Googlebot is spending a lot of time on your site, and that’s not ideal.
Since you can’t change how long Googlebot spend to make HTTP requests, you’ll have to change how much it downloads.
One way you can do this is by blocking unnecessary pages from being crawled. You can do that by modifying your robots.txt file. (Again, see this article for reference).
You can also cut any unnecessary content or code from your site. You need to be super careful with this, since all of your content and code is contributing to your SEO.
It’s not the end of the world if Google is downloading a high amount of kilobytes, so don’t lose any sleep over it.
Conclusion
I’ll be honest with you.
When I first came across the Crawl Stats page, I thought, “Is this it?”
It didn’t look like much to me.
You might have clicked on it accidentally and thought nothing of it. It’s tucked away in a really obscure location, so you probably haven’t explored it.
But once you realize what it does, your eyes go wide. You think about all the possibilities.
It really is a surprisingly powerful page when you consider how short it is.
There’s only three rows of data, and yet there’s a goldmine of information here. If you do SEO at all, this is a page you need to check out.
And what’s more, it’s free. So if you aren’t using Google Search Console yet, this is a great place to start.
If you use Crawl Stats reports as part of a long-term SEO strategy, you’ll get ahead of your competition and leverage some unique advantages.
That’s because Crawl Stats allows you to understand the relationship between your site and Googlebot.
Think of Crawl Stats as relationship therapy for your site and Googlebot. You can see how things are going and make changes if you need to.
I also encourage you to explore more parts of Google Search Console. Start with Crawl Stats, but don’t be afraid to poke around in GSC.
Have you used Crawl Stats before? Are you going to start?
Comments (38)