
I get this question a lot:
Neil, how do you know that your content is performing?
I like this question because I can give a concrete answer.
So often, people working in content marketing think that it’s subjective.
It’s not.
There are very real, specific metrics that show you how well your content is performing.
But be careful. There are also vanity metrics out there that can be more distracting than worthwhile.
That’s why in this post I’m going to give you the most valuable metrics for evaluating the performance of your content.
The 7 Most Important Metrics to Track Your Content’s Performance
Metric 1. Traffic
No surprise here.
If you’re a regular reader of my blog, you know that I’m all about traffic.
Traffic is the most important metric because it enables everything that comes after it: engagement and conversion.
But traffic by itself is not a clear indicator of your content’s performance.
The real metric that you should be paying attention to is the increase in traffic over time.
Every site or blog will have different levels of traffic.
Some are better at SEO than others. Some have been around longer. Others have marketing budgets that can boost traffic numbers.
You should read my post about creating an organic traffic pipeline to get up to speed on the basics of traffic acquisition.
There is no definite amount of traffic that you should have. Each blog and website will have different objectives and a different threshold of traffic before people start to convert.
All websites do share a common goal, however, and that is to increase traffic.
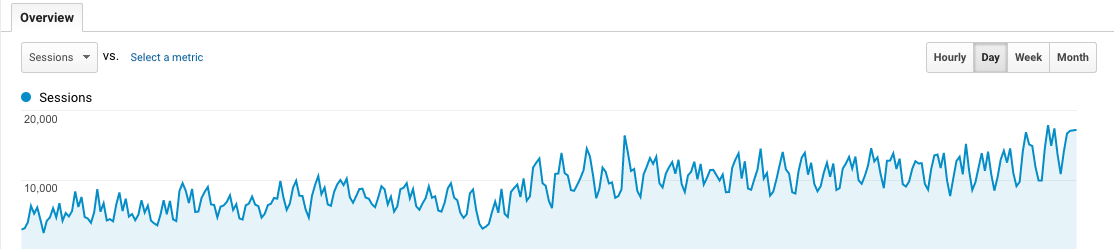
If you’re properly executing your content strategy, you should see an increase in traffic over time.
That change in traffic is a clear indicator of performance. You should keep a record.
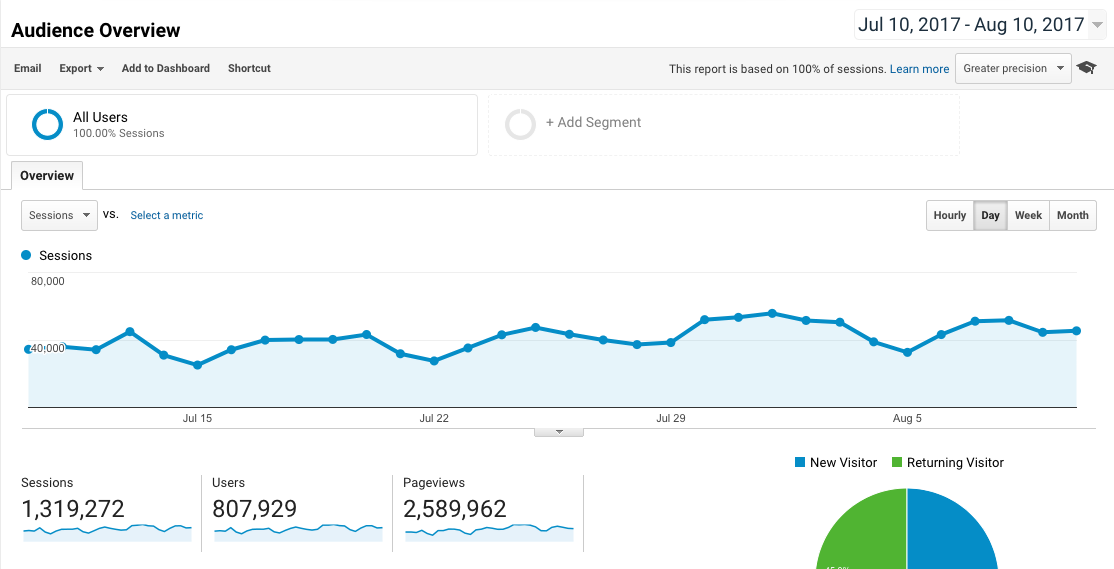
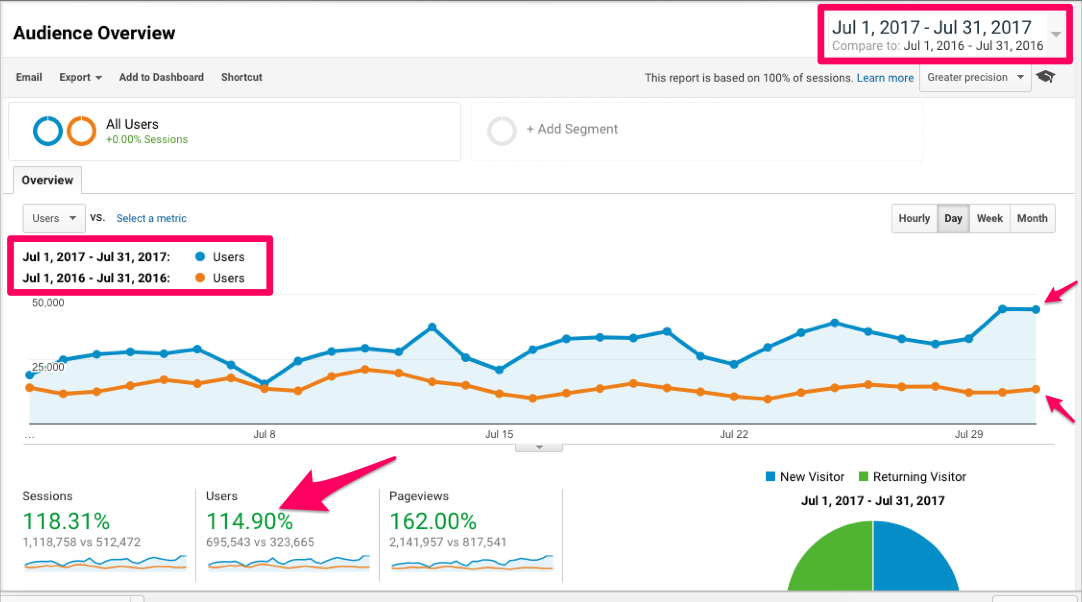
In Google Analytics, traffic is divided into two different categories: users and sessions.
Users are the unique visitors. Unique visitors only count someone once during a timeframe. For example, people who visit my blog every day would only be counted once when I add up the users for the month.
Sessions count each time someone comes to your website regardless of if it’s their first time or not.
So, if you come to read my blog once a week, that would add up to 4 sessions per month.
Both measures have value for different types of reasons. What we are really concerned with is the change in traffic over time.
Keep your record every month and see how it changes.
Line that up with the content that you posted.
Then, isolate months where things went really well and look to see what you did.
When something works, you should do more of it.
You can learn the best practices and start to adopt them as you progress, while at the same time cutting out things that you did that didn’t make your traffic increase.
Metric 2. Your SERP ranking
SERP stands for search engine results page. Your ranking is where you show up when someone searches for something relevant to you.
This is the view when I search for Neil Patel.
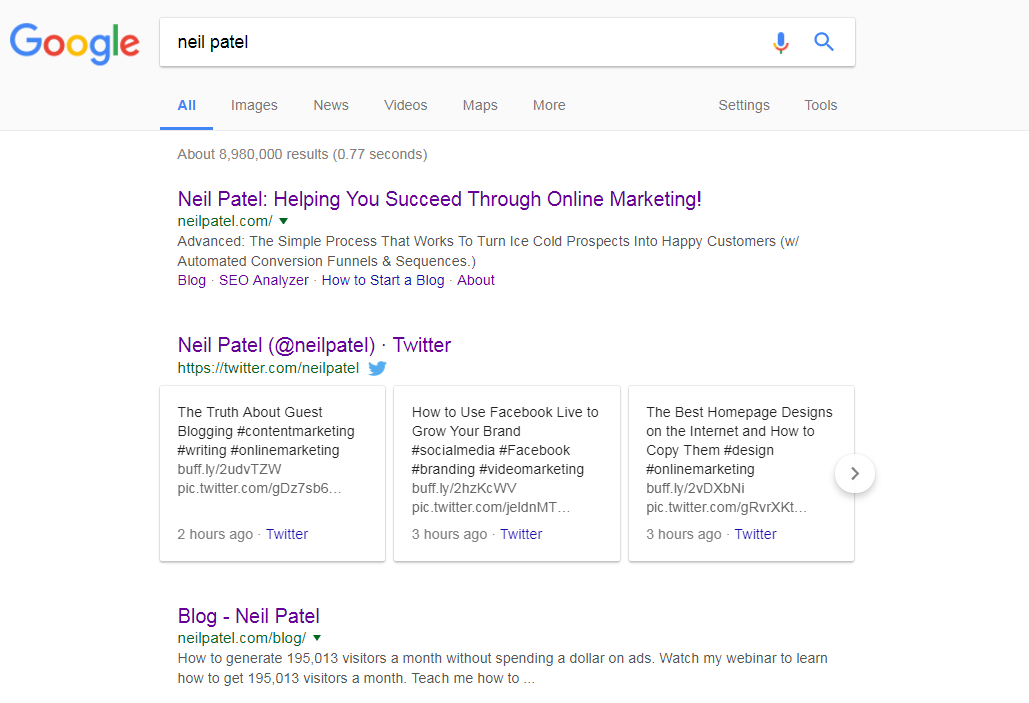
While your SERP ranking is not really a metric that you can calculate, it is one of the clearest indicators of how well your content is performing.
If Google likes it and references it highly, you’re doing it right.
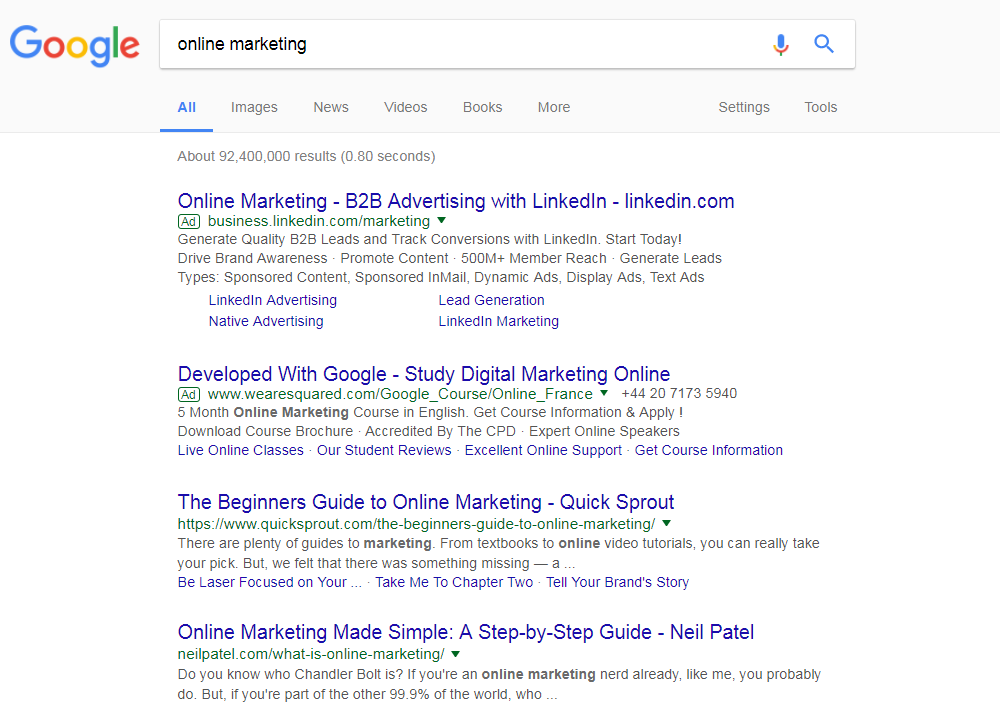
Try searching for a few different combinations to see which of your posts or pages show up.
I show up as the 2nd organic result when I search for “online marketing.”
For the term “SEO guide,” my step-by-step SEO guide is the 4th organic result:
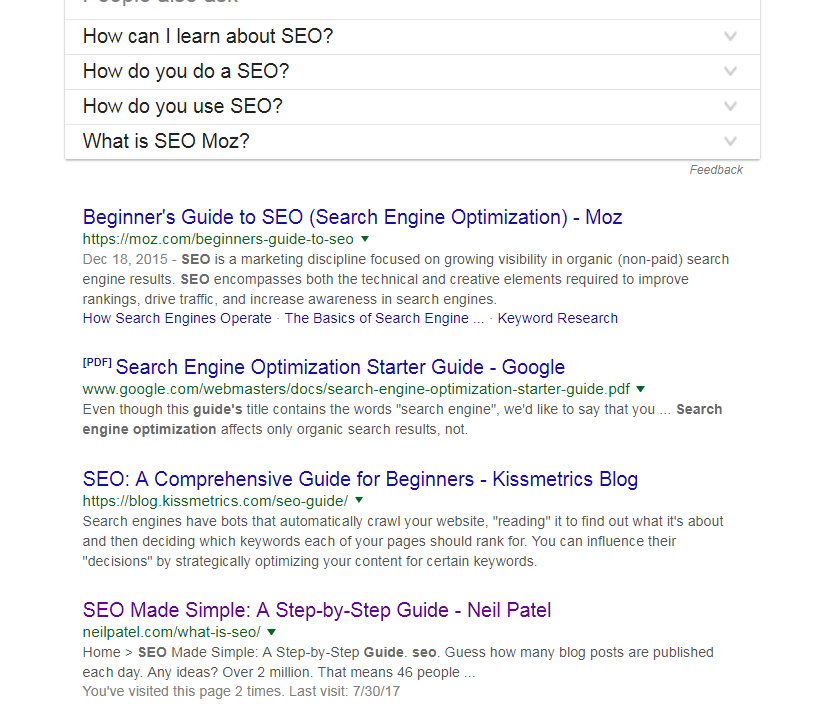
Over time, you can see if those pages go up.
If your content is good enough, you can eventually get to having your content delivered in what’s often called the “#0 result” in Google SERPs in the form of a snippet.
As you test and optimize for search, the direct result should be an increase in your ranking.
Here’s how you test SEO tactics:
Metric 3. Time spent on site
Have you seen the counters on Medium that show how long it takes to read the post in minutes?
It’s right at the top of the article.
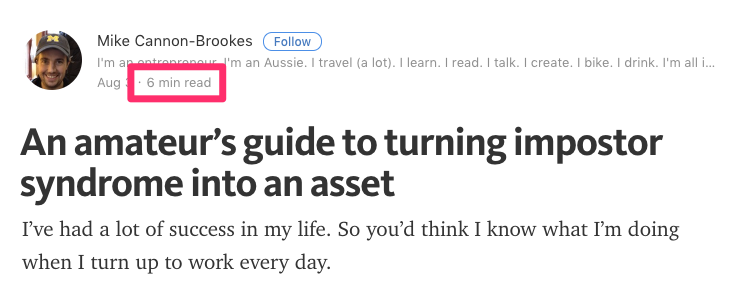
There is a good logic behind doing this.
People like to know how long something is going to take before they get started.
Adding in the time it takes to read lets people know if they are going in for something quick that they can finish before a meeting starts or if it’s best consumed at home in the evening when they have more time.
Medium calculates their read time like this:
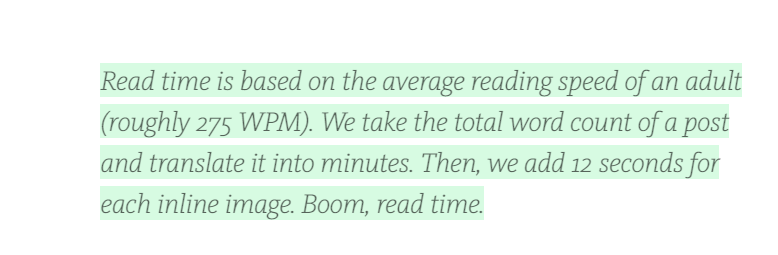
That’s all well and good, but nothing replaces the power of a great headline to get people’s attention.
The real measure of the quality of your content is how long people actually stay on the site.
The longer people stay, the more content they are consuming.
In Google Analytics this is called Session Duration.
You can see how people are engaging with a specific post by finding the URL.
Then, calculate according to Medium’s method an estimated read time.
Compare the read time to the average session duration for that URL.
Do they line up? If they do, that means that nearly everyone is reading the article in its entirety.
It will never line up all the way. There will always be people who click, read a few sentences, and then leave.
That’s OK.
But if it’s clear that no one is making it to the end of your content, then it should be time to rethink how you are presenting it.
Metric 4. Pages per visit
Internal linking is a huge part of publishing successful content.
Content that supports other content helps fuel a virtuous circle where people continue through to other articles while learning and receiving value.
You should make it as easy as possible for people to click through and find more of your content.
You can read my complete guide to internal linking and discover what it can do for your site traffic.
The strategy is to deliver so much value in one article that when you link to a different article, people assume that it contains a vast amount of value as well.
You need to make it irresistible. Appeal to their sense of FOMO (fear of missing out).
The more clicks there are, the more your content is working, and the longer visitors stay on your site.
Metric 5. Returning visitors
Content is a lot like a meal. The best honor you can bestow on your host is to go back for more.
And just like a meal, if you eat at a bad restaurant, you probably won’t go back a second time.
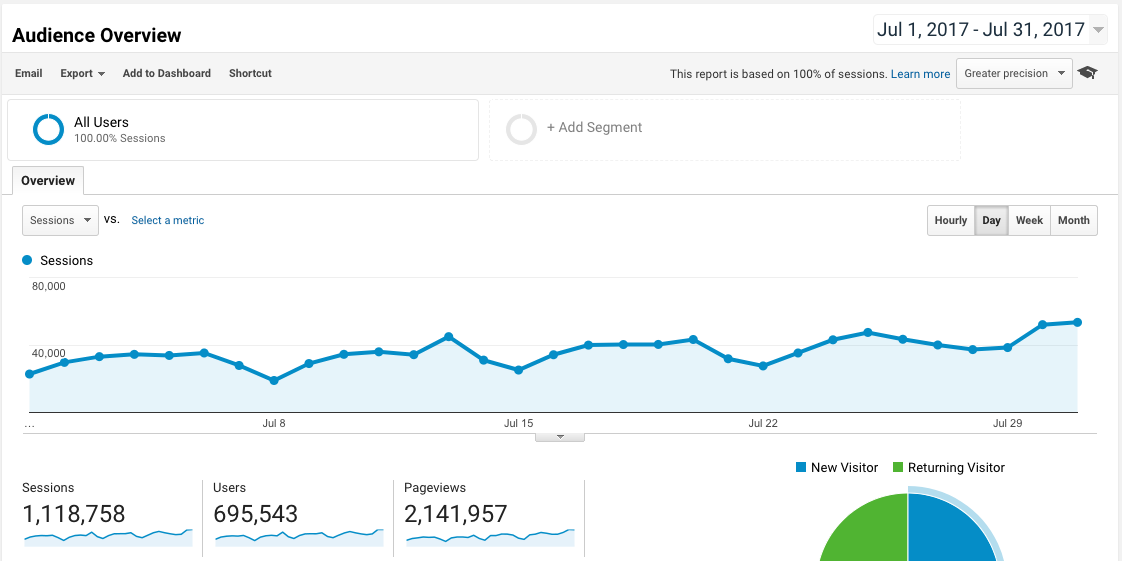
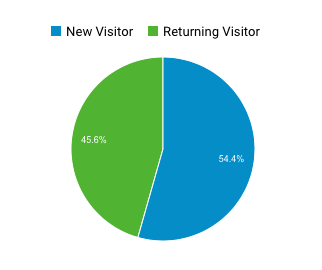
The ratio of returning visitors to total visitors is a key metric for answering the question, “Is my content good enough that people are coming back for more?”
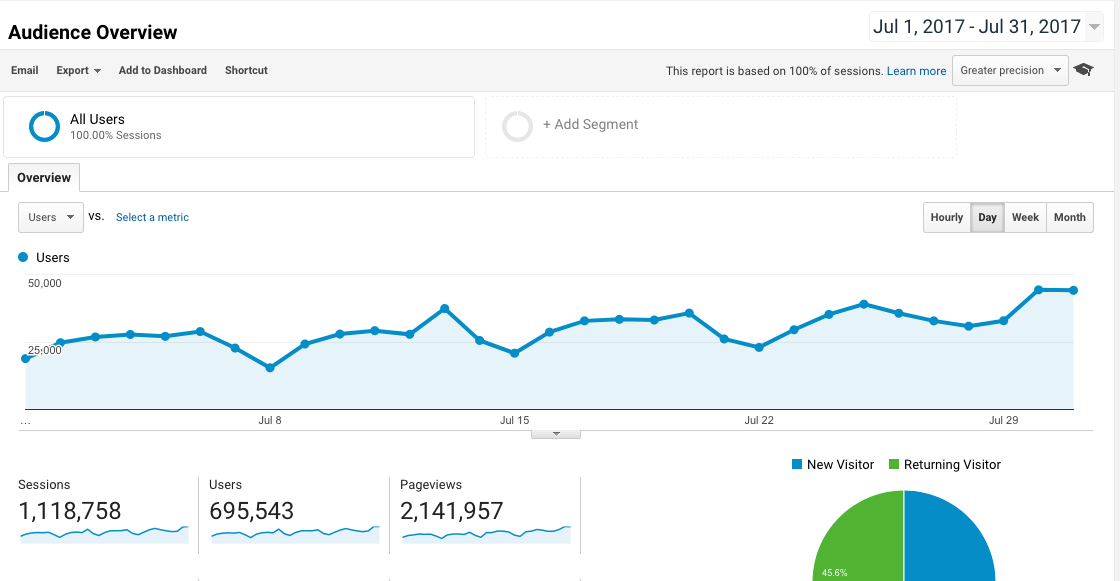
Google Analytics has an option in their dashboard to evaluate the percentage of new sessions.
You will always have first-time visitors. In order to increase your traffic, you certainly want new people coming to your site all the time.
But a viable content strategy has never been built upon attracting one-and-done visitors.
Again, there is no golden ratio for a website.
You can segment by the source of traffic and extrapolate a couple of predictions that would hold true.
Email is mostly returning visitors since they are people who came and subscribed.
Social is a mix since a lot of people are engaged and follow me, but a lot of people come through links that other people shared.
The best way to look at the performance of your content is to look at direct traffic.
This is the traffic that comes from people typing your URL in directly.
Usually, people only type in a few letters before the browser suggests pages from the history.
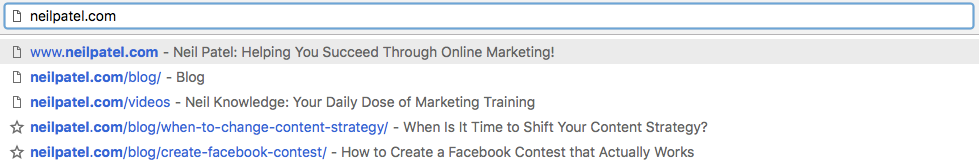
Direct traffic will probably be almost entirely returning visitors.
The percentage of traffic from direct versus other sources will depend on your marketing campaigns and business model.
Instead of trying to increase the percentage of your traffic from direct, you should focus on the absolute volume of sessions from direct traffic.
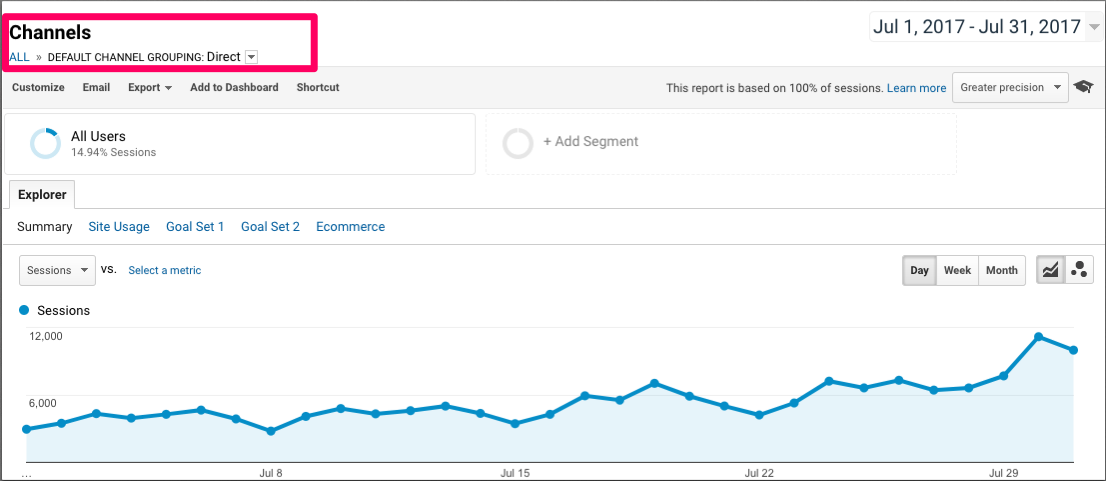
If your volume is increasing, it means that people are coming back and your content is working.
Metric 6. Social sharing
I’ve said it over and over again.
Great content is content that delivers value.
When you give someone something of value, the tendency is to share.
When people click the share button, they are saying to their network, “This is valuable, so you should look at it.”
Your site’s social share buttons should have counters on them so you can see at a glance how people are interacting.
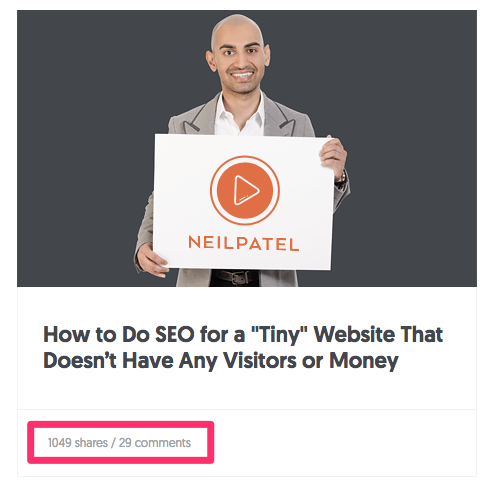
On my blog, I have the total shares in the preview box:
Then I have the social share buttons, which are always visible to the right of the content with their counters:
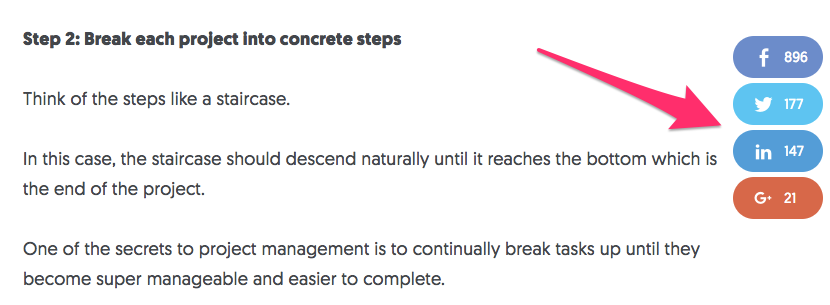
When visitors see that an article is being shared a lot, they assume that the content has value. It’s a strong indicator that they should read it.
The share is the important metric to track here. Each share is an opportunity for content to leave your audience and reach a new network of people.
The advantage of having the share buttons that scroll as someone reads is that it can capitalize on the moment when the content is so good that they have to share.
Metric 7. Clicks from Social Platforms
Social sites also provide analytics for your posts. That data can be used as an extension of your analytics platform and can provide extra insights.
I’ll go into detail a little bit later about the tricky nature of the Facebook Like, but one insight that you should pay attention to is clicks.
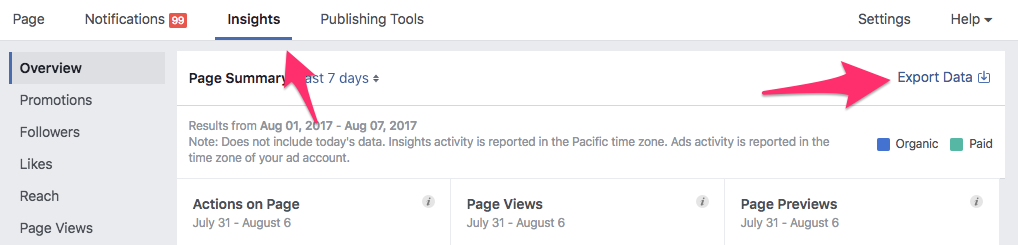
Not the “post clicks” metric in the insights dashboard:
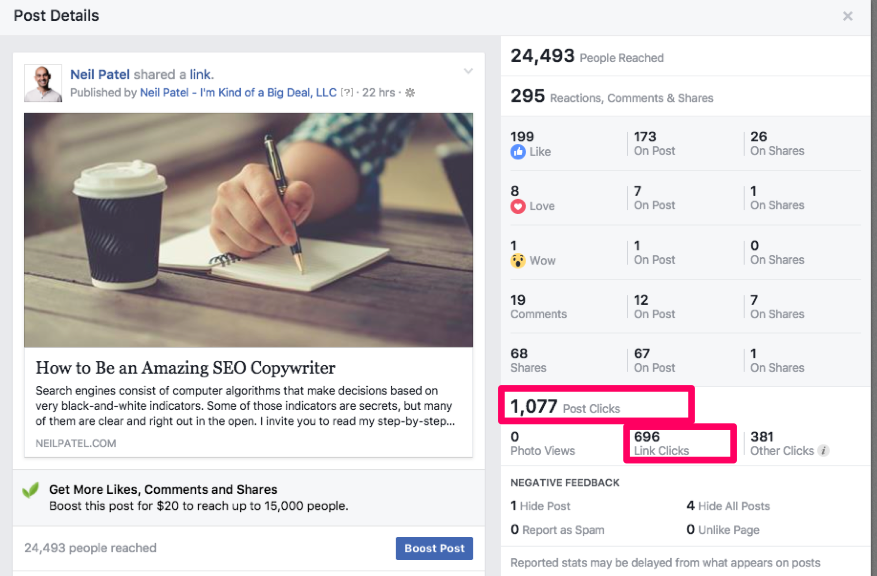
The “post clicks” are any time that people do anything, such as expand to read comments, click to see the image in the viewer window, or click play on a video.
What you want are link clicks.
To get this information from Facebook, you need to do an export.
First, click the export data button.
Then select the format that you want. In this case, you should go with the Post option.
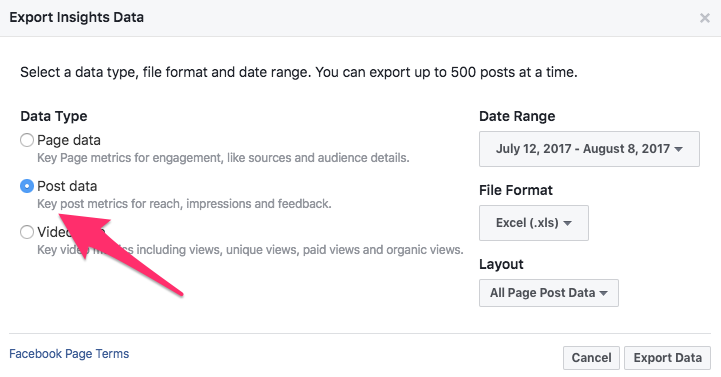
You can also select the file format that you want. This can be helpful if you have an analytics platform that you can export to.
The easiest option is just an Excel spreadsheet.
Open the Excel file that downloads.
Immediately, you’ll see the basic data.
Hidden under the tabs are the real insights that you are looking for. Find the Lifetime Consumption by Type sheet.
Scroll to the right until you see the column Link Clicks.
This is the true measure of people clicking through to your website.
And there is a reason why Facebook hides this information. It’s how you measure your CPC.
Facebook doesn’t focus on CPC.
They prefer talking about the community angle — particularly engagement. That’s why you see likes and interactions in the Insights dashboard.
But if you looked at Facebook in exactly the same way as display advertising, you would measure the performance by how much you spent to get one person to click to your site.
If you see that there aren’t many people actually clicking through to your site, you need to up your headline game.
Headlines are the game changer.
People scrolling through their Facebook feeds receive all kinds of content and information.
For example:
- Pictures of their friends’ babies
- Video of a dance group that someone commented on
- Mysterious status update from a sister-in-law
- An ad for the new Pirates of the Caribbean movie
- Your article
In order for your article to break through the noise, you need to have an awesome headline.
Headline writing is a huge part of getting people to read your content.
When someone is already on your site, the headline has less importance.
But when your content is reaching people when they aren’t on your site, you can measure the real performance of your headline.
If people are clicking through to your site, that’s a good indicator that your headline copy is working.
If you’re sharing and no one is clicking, you should immediately refocus on how you are presenting your content.
In addition to focusing on the Insights in the Facebook dashboard, you can also see the breakdown of traffic from social networks in Google Analytics.
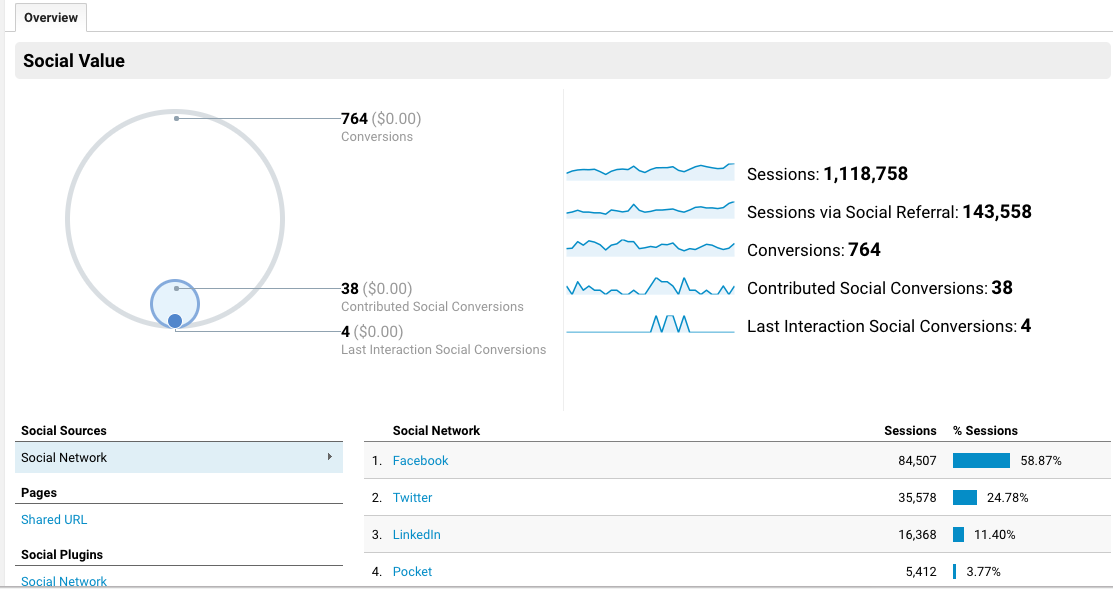
The Facebook Insights concern you, while the general traffic from Facebook in your Google Analytics includes traffic coming from all of the people who also shared your content.
Traffic from social can vary a lot. Maybe you got some press, or perhaps an influencer posted something about you.
This could drive extra traffic to your site.
Good news!
But it’s not related to a specific piece of content. Drawing conclusions can be counter-productive.
The Facebook Insights gives you a very concrete way to measure.
Speaking of counter-productive metrics, it’s all too easy to waste time looking at metrics that aren’t good ways to evaluate your content.
Metrics that can distract you from your real focus
Some metrics are less useful than others.
Some can be downright distracting.
You will be wasting valuable time tracking them and probably not be able to glean useful insights about your content.
Here are a couple:
Bounce rate
The bounce rate is the percentage of visits (sessions in Google Analytics) where people see only one page before leaving your site.
You might be thinking, “Isn’t that the opposite of the pages-per-visit metric that you mentioned earlier?”
Not exactly.
While you want to pursue a strategic internal linking strategy that enables people to discover more of your content, the bounce rate is a much more general metric that in itself can mean multiple different things that aren’t always clear.
For example, let’s say someone clicks one of your articles from Facebook. They spend five minutes reading the full article. Then they leave.
That visit counts as a bounce.
But it’s clearly a qualified visit.
You can see how it gets a bit murky.
Plus, bounce rate is also heavily affected by the UX (user experience) of your site. People leave for many reasons:
- They are looking for something they can’t find.
- The menu structure isn’t clear.
- They can’t search for what they are looking for.
Sites with poor UX will suffer high bounce rates.
So when you are looking for metrics to measure your content’s success (and only content) put the bounce rate aside.
Facebook Likes
It’s a question that everyone in digital struggles with: “What is a Facebook Like worth?”
On one hand, it’s clearly an engagement. On the other hand, it’s not a conversion.
It might not even be a click.
And with more brands and businesses congregating on Facebook, the user experience has been increasingly controlled by the Facebook algorithm.
To improve the user experience, Facebook severely limits the number of people your content reaches.
The recent algorithm changes have throttled organic reach in two ways.
First, your organic reach declines dramatically as you get more followers. It’s sad but true.
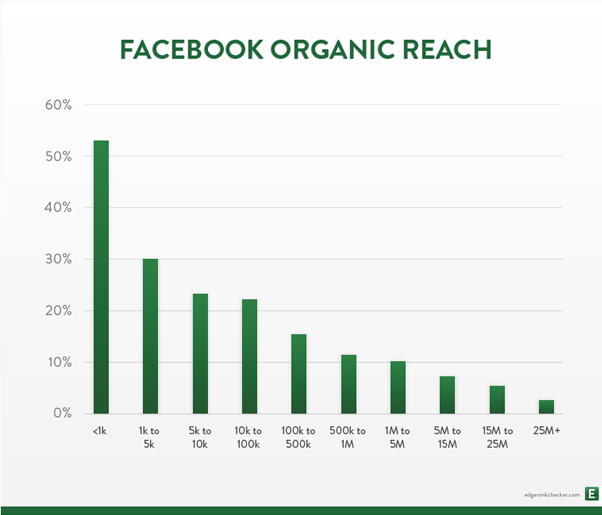
Then, due to a huge increase in content being posted, Facebook’s organic reach has been steadily dropping to where it is now a tiny 2%.
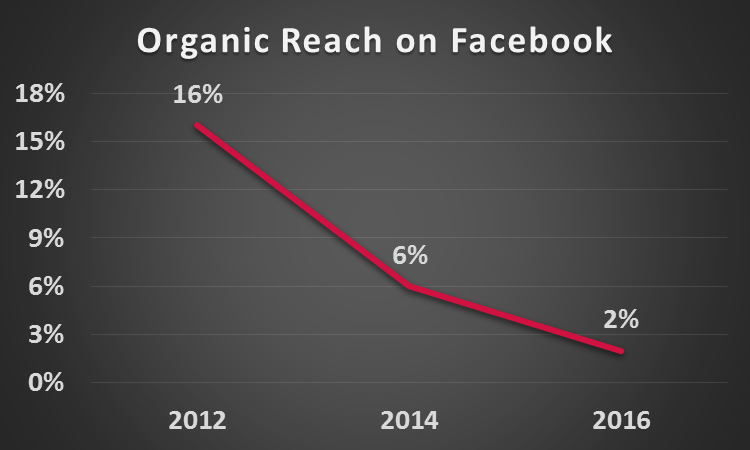
It’s becoming a pay-to-play environment.
Not all is lost, however.
The best way for content to break out of the downward spiral is to gain traction.
Traction means garnering a lot of likes and comments rapidly so that the algorithm identifies it as high-performing and delivers it to other people.
But that’s where the value of a Like ends.
Facebook Likes by themselves are meaningless when you’re trying to track your content’s success.
Like I mentioned before, the true social metric is the share. A share is someone taking your content and pushing it out to their audience.
A click is a visit.
A like is something else. People like things automatically, sometimes even without reading.
So while it’s cool to see people liking your content on Facebook, try not to take it any further than that.
Conclusion
Now that you see how clearly you can measure the success of your content, I recommend putting together a spreadsheet to track your metrics over time.
In most of the cases cited above, there are no absolute values that you can shoot for.
The Internet is a space that constantly changes, and a great strategy today might not be a great strategy tomorrow.
The best you can do is execute your strategy, deliver content with value, and try to keep your metrics in line month after month.
What metrics are most important for you in evaluating the success of your content?
Comments (4)