
You’re drowning in data.
You’ve got enough KPIs to track and report on already.
Why would you possibly need another one? What good would come of adding yet another hour to the end of you’re already long work day in order to dig it up?
The truth, in this case, is that you can’t afford not to.
Lifetime value isn’t just another vanity metric. It’s the metric. The one that stands head and shoulders above all others.
If there was one and only one metric you were tracking, this should be it.
And now you can do it simply and easily inside Google Analytics. Here’s how.
What is lifetime value (and why does it matter?)
Metrics often lead you astray.
Take cost per click.
They range wildly from industry to industry. $2 bucks in one industry, but $50 bucks in another.
Crazy, right? Surely that $50 is just “too expensive.”
Not necessarily, obviously.
The first easy answer is your break-even point. If your cost per acquisition is less than your initial average order value, you’re golden.
But sometimes, in some cases, you actually want to willingly lose money initially.
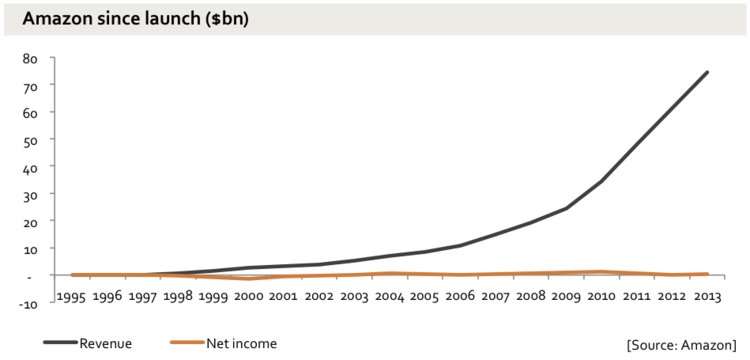
Ever heard of Netflix? How about Amazon?
Amazon routinely enters a new market with razor-thin (or even negative) profit margins so they can grab market share. Only to then turn the dial back once they’ve gained a market leadership position.
So what’s a reasonable cost per click in that scenario? Now, it depends.
This can even change from company to company within a vertical (and their appetite for risk).
Let’s talk insurance.
Two ways to make money:
- Upfront commission when you close a sale
- Ongoing residual payments over the life of each deal.
So you’ve got a new company. You’re entering a new market and trying to expand.
Would you willingly, purposefully sacrifice #1 in order to scale #2?
Of course you would.
Why? Because of the lifetime value of a customer.
The full potential value of each new client you add will eclipse the initial commission. So, as long as you can stomach the negative cash flow for a bit, you’d probably be willing to drive that cost per click as high as humanly possible.
You go all in when the stakes are right and drive everyone else out.
All of this sounds perfect except for one teeny, tiny detail.
Does your company track lifetime value? ‘Cause most don’t.
I’ve personally worked with dozens (hundreds?) of clients over the past few years and I can count on one hand the number who were actually tracking conversions properly. Let alone seeing anything past the first purchase.
One of the reasons is because tracking this info, with current systems, isn’t always easy. It might be easy if you’re using a Shopify and do all sales in a single channel or two. That way, everything happens inside one platform.
But usually, your business is spread out. Each department has its own independent systems. So it’s tough to bring everything together.
Thankfully, Google Analytics has been hard at work recently.
Their new Lifetime Value report helps business owners acquire data to understand how valuable certain users and customers are to their businesses based on their lifetime performance.
And best of all, it pulls together lifetime values for people acquired through different channels and mediums, like social, email, and paid search.
You’ll also be able to view data by engagement (page views, goals, events) and trends (like 90 days after customer acquisition).
Using this will help you determine which sources are driving the most valuable traffic and which corresponding marketing investments are truly delivering good ROI.
Here’s how to run a lifetime value report inside Google Analytics.
How to run a lifetime value report
Start by signing into your Google Analytics account and then follow these simple steps:
- Step 1: Click on Reports Section
- Step 2: Click on Audience
- Step 3: Click on Lifetime Value
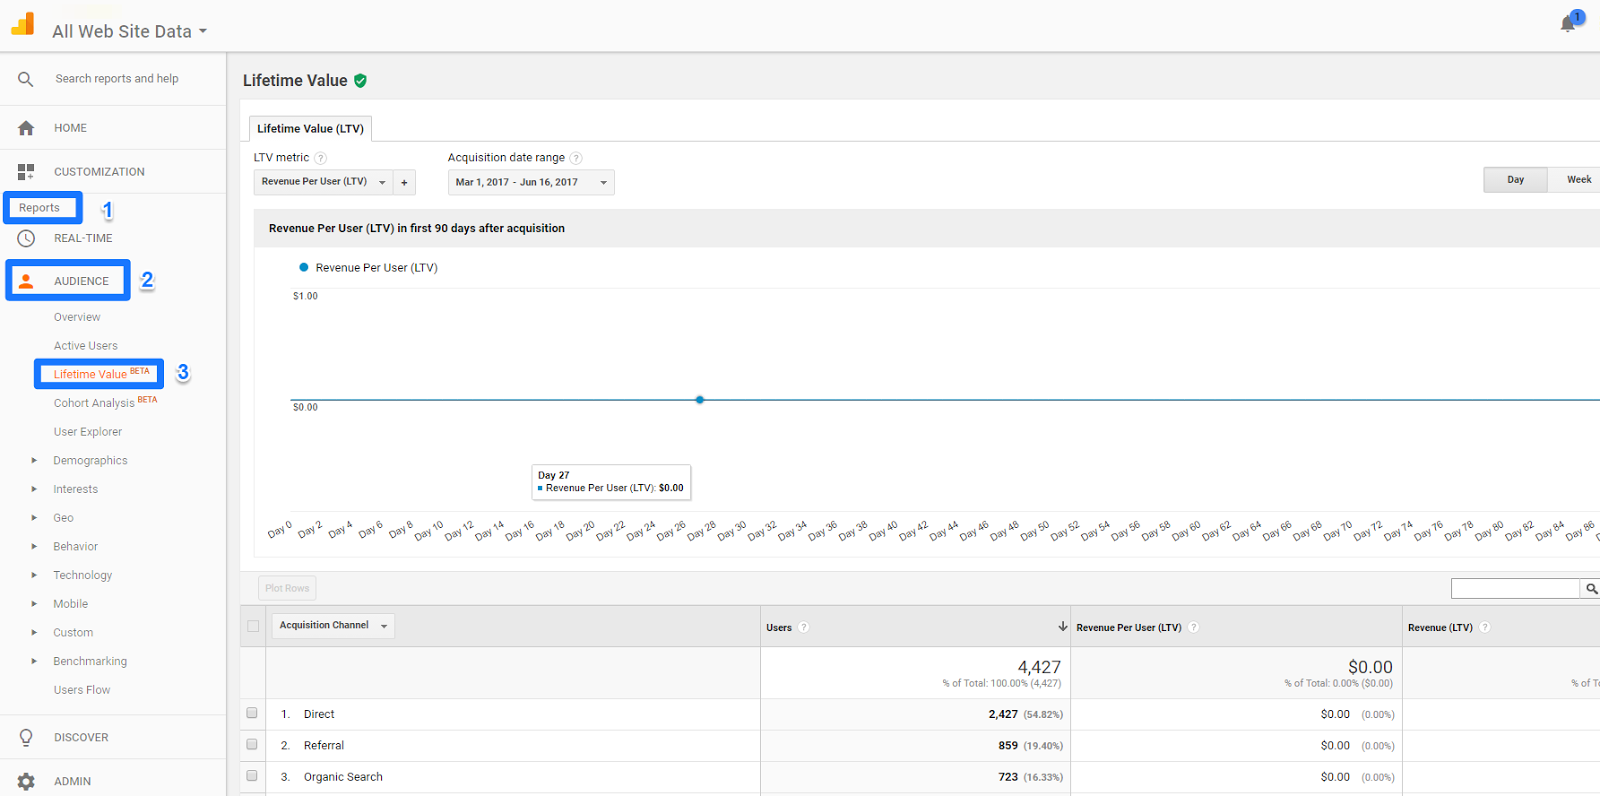
Note: The Lifetime Value feature should already be available inside your GA account (no need to change your code!).
Now let’s get started generating a report. Here’s how to setup your graph first:
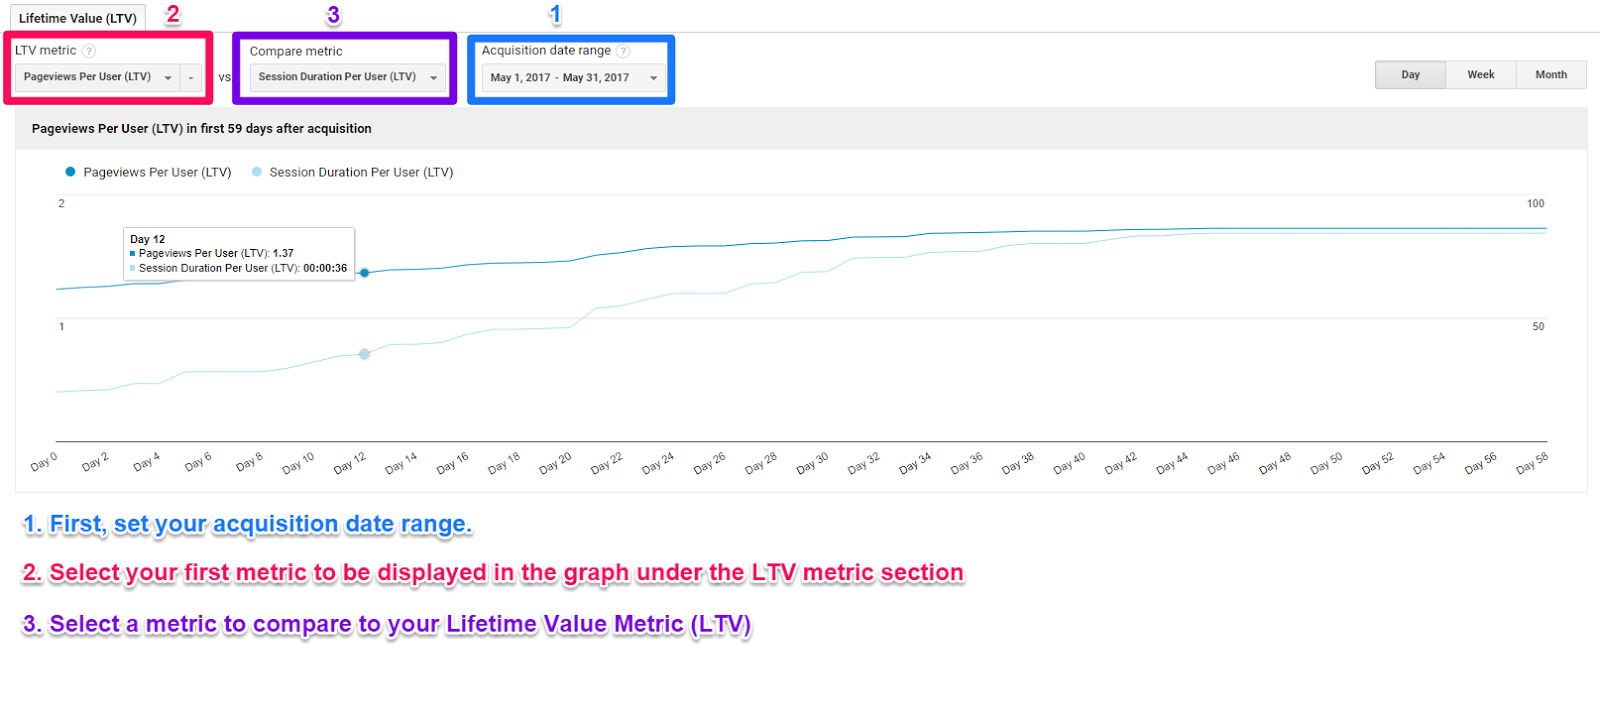
Start by setting your acquisition date range (the option on the far right). Any customer acquired during this date range (May 2017, in this example) will be included in the LTV report.
Let’s say you ran a promotional campaign or online sale during the month of May. You can easily analyze the data for these customers and segment by date based on your campaigns.
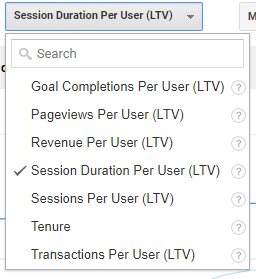
For steps two and three, you can select the following list of metrics to compare:
Now, let’s break this graph down a bit to help you understand what the heck is going on:
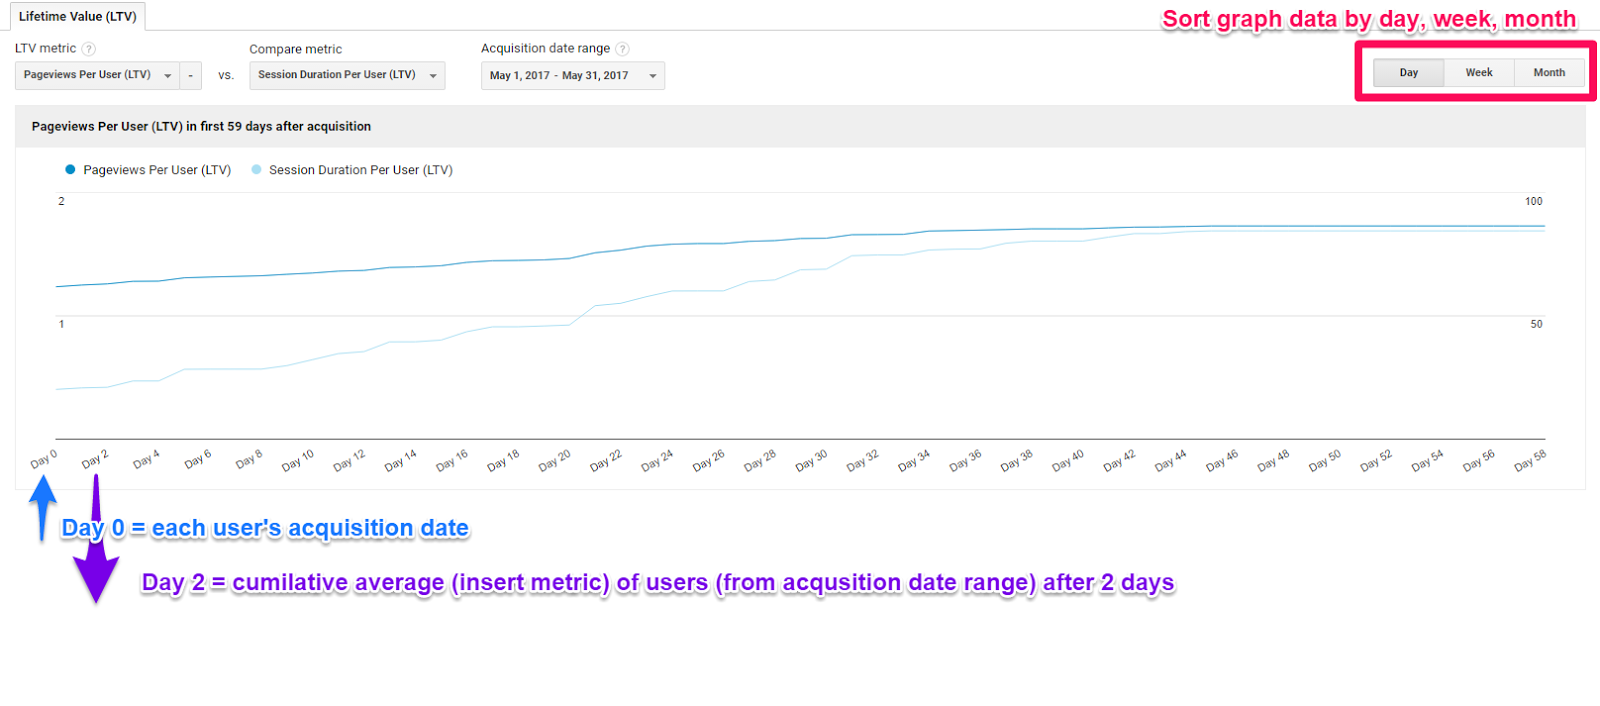
Essentially, this graph is showing site users acquired during the month of May and how their lifetime value changes based on the page views and session duration metrics over a 90-day period on the site.
These are obviously engagement metrics, but you can customize this even further to track the exact amount spent if you have e-commerce tracking enabled.
Now, let’s jump to the table below:
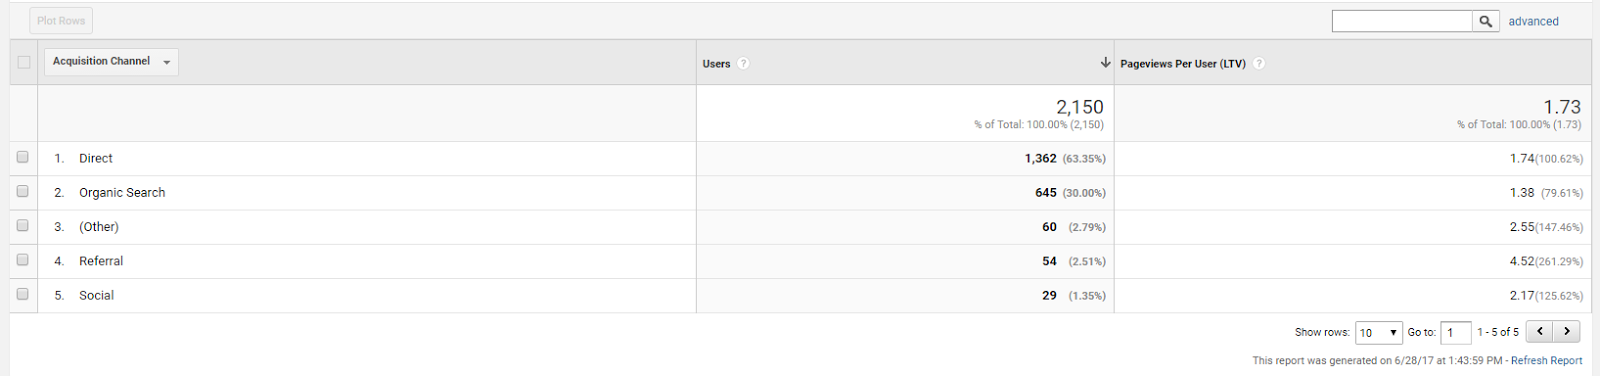
Now we’re able to compare the number of acquired users (and the page views per user) — in this case, by acquisition channel.
Click on the drop-down above the table to pull up different granular sorting options like source, medium, or campaign.
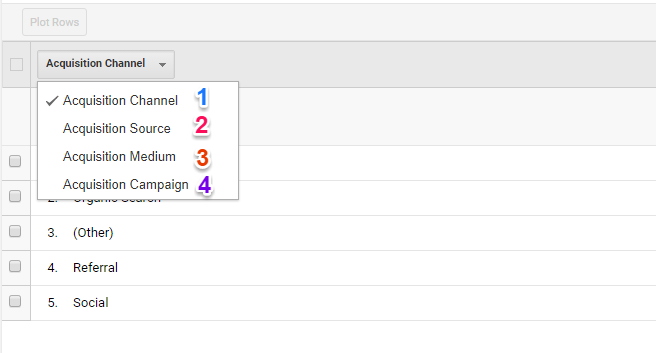
How is this helpful? Check it out:
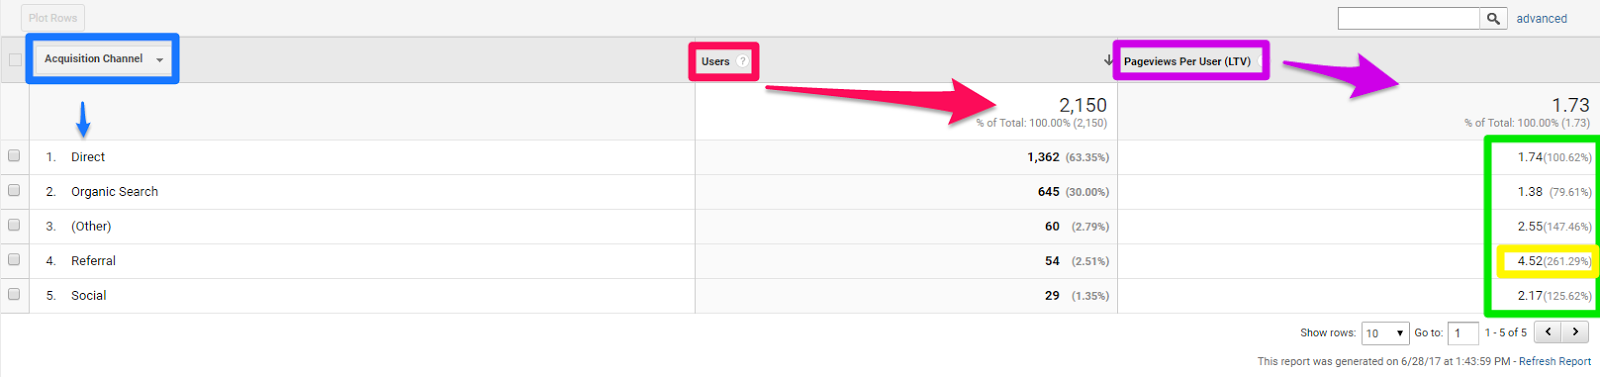
Let me break it down:
- Blue: Acquisition channel. This shows what channel the users were acquired through, such as direct, organic, social, or referral.
- Pink: Users.The number of users in the specified acquisition date range (May 2017 in this example).
- Purple: Your selected lifetime value metric. In this example, page views per user is the LTV. This column is where the data begins to get interesting.
Let’s zoom in on the last column in detail to see if there’s any insight we can already glean from these reports.
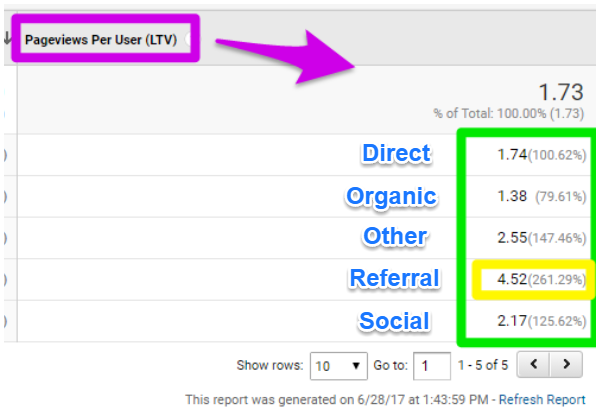
Now we start to notice patterns among the different channels. For example, referral traffic has double the page views per user (LTV) than almost every other channel. While organic page views per user (LTV) is beginning to fall behind.
Want to pull back the curtain even more? Like being able to see things what individual referral sites are driving higher LTVs?
Head back over to the “Acquisition Source” on your table. Now we can break down which individual websites are sending us the most valuable traffic (based on LTV). And the winner is…
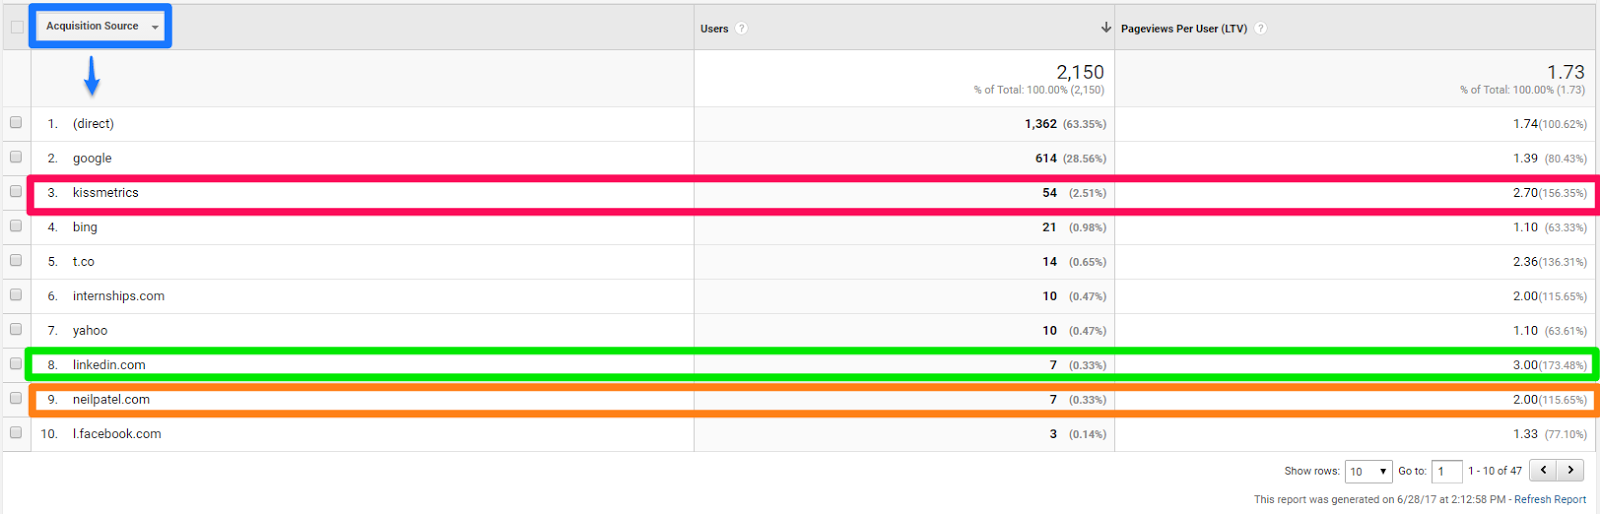
Kissmetrics! 🙌
Here’s why this new insight is important.
Data lies. LTV forces it to tell the truth
Data lies to you daily.
For example, pull up your goals inside Google Analytics to conduct a similar analysis to the one we just did.
You can even view the reverse funnel path to see which pages, posts, or campaigns delivered the most conversions. This report is helpful … to a point. If you understand its limitations.
For example:
❌ Problem #1. These could be subscribers or leads — not solid purchases. So you’re basing hard decisions off of ‘top-of-funnel’ data.
One campaign or channel might send 100 subscribers while the other only sends 20. But none of this takes into account how many of those people are converting. Or even how much money each is spending.
❌ Problem #2. Oh, these are sales, you say? OK.
Except for one thing: You can’t tell if they’re one-off or repeat. So you can’t tell if each customer is a $100 order or a $1,000 one.
Which is kinda important when you’re looking backward to see how that content investment performed versus the paid campaign.
❌ Problem #3. A/B tests lie, too.
Things start off great. That new button resulted in a big conversion rate leap.
The only problem is that these small, temporary fluctuations often regress back to the mean. Larry Kim likened it to “moving desk chairs around the Titanic.”
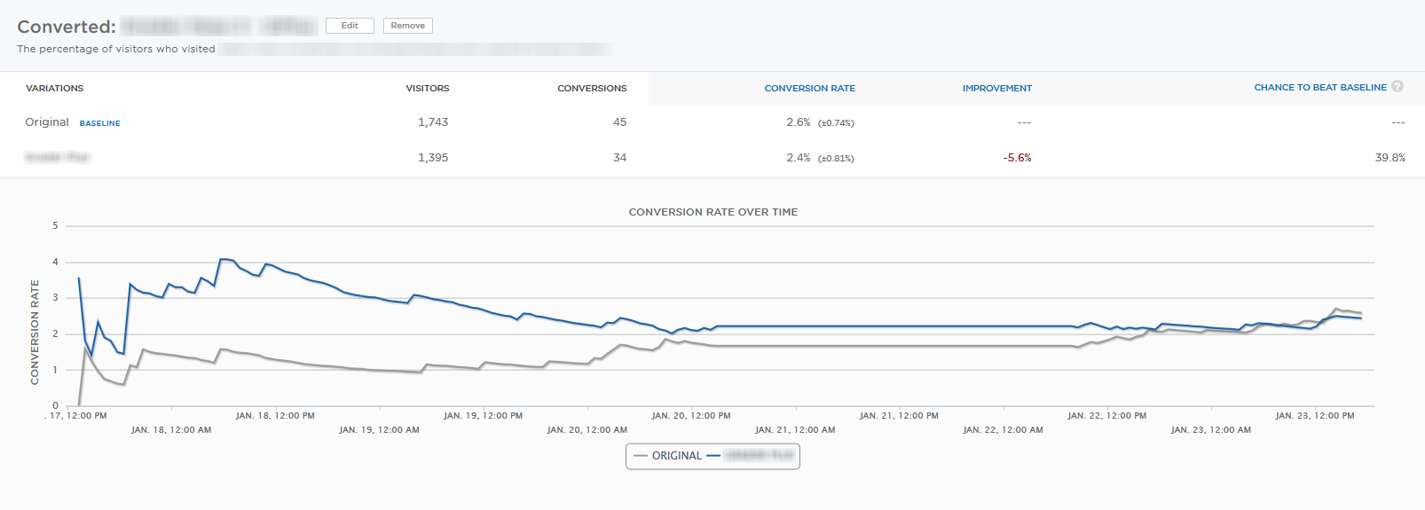
There might only be a literal surface level change, without ever fundamentally improving the organization as a whole.
When does this commonly happen? When you over-optimize.
❌ Problem #4. Over-optimization.
A/B tests that increase top line metrics often backfire.
For example, another study from Larry Kim showed that for every increase you made in a conversion rate, the lower your rate of marketing qualified leads.
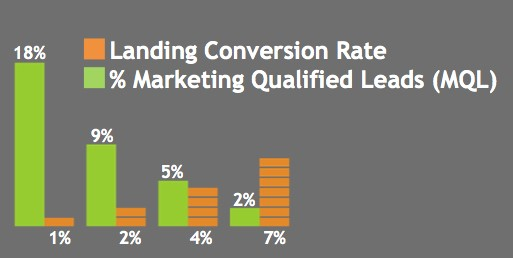
In other words, the more aggressive you at about collecting that initial opt-in or lead can often lower the overall quality of the leads that are getting in. Which doesn’t make a whole lot of sense in the grand scheme of things when you think about it.
The point is that there are many, many ways data often lies to us. We think we’re seeing the whole picture, when in reality, it’s only a tiny slice of it.
Conclusion
Metrics aren’t always what they appear. And data often lies.
An “expensive” cost per click for one business might seem relatively cheap for another. And sometimes, that overall conversion rate we’re looking at to base our decisions around is fraught with peril in reality.
The one savior is lifetime value.
It gives us a broader, big-picture context when viewing other bits of information. It helps us put things into proper context.
So we can not only make better decisions to drive additional revenue. But also realize when we’re about to make a few costly mistakes.
Comments (15)