Recently, we covered how you can go beyond standard reporting in Google Analytics by using filters, segments, reports, and dashboards. In today’s post, we are going to dive a bit deeper into using Google Analytics dashboards with even more free samples to import into your account, tips on creating dashboards, and even an alternative tool to use.
What Are Google Analytics Dashboards
Google Analytics Dashboards are simply collections of widgets that allow you to quickly visualize your data. You can have up to 20 dashboards with 12 widgets in each for each view / property in your Google Analytics account. Each view / property includes a default dashboard to get you started.
To access your dashboards, click on Dashboards in the left side menu of your Google Analytics.
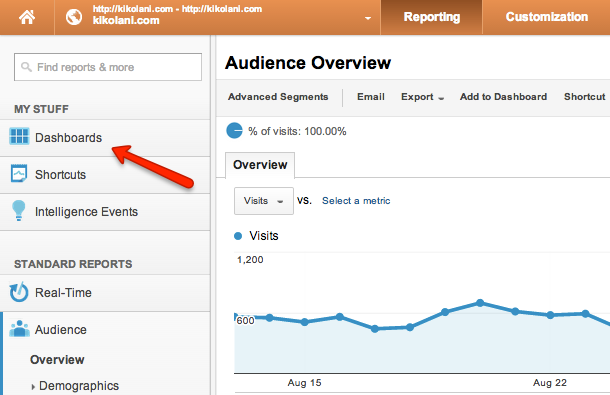
Under the Private dropdown, you should find a My Dashboard, which is your default dashboard.
This is where you can get a feel of what dashboards have to offer.
Shared Google Analytics Dashboards to Download
One of the great things about dashboards is that you can find plenty of awesome examples created by others to import into your own Google Analytics account. This can save you a lot of time and give you lots of ideas about how to use dashboards
Whenever you find a shared dashboard, all you have to do is click on the link while logged in to your Google Analytics account, choose the property you want to add the dashboard to, and you are all set.
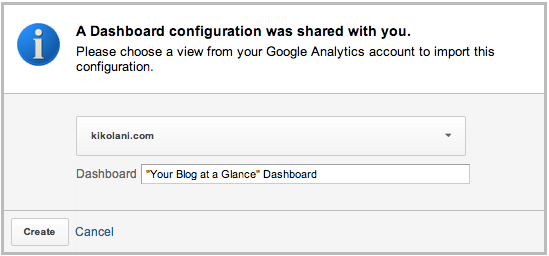
This will not cause you to share any data with the person who created the dashboard. You will also not get other’s data from shared dashboard configurations.
The following are collections of free, shared dashboards to choose from.
- Google Analytics Solutions Gallery from Google (select Dashboard from the first dropdown)
- 5 Custom Google Analytics Dashboards And How To Use Them from CrazyEgg
- 6 Google Analytics Custom Dashboards To Save You Time NOW! from State of Search
- 7 Google Analytics Examples Using Custom Dashboards from Online Media Masters
- 10 Useful Google Analytics Custom Dashboards from Econsultancy
- 5 Insightful Google Analytics Dashboards from Moz
- 20+ Custom Google Analytics Dashboards from 5StarNet
- 7 Free Google Analytics Dashboards from Koozai
- 5 Free Google Analytics Dashboards to Download now from Yahoo Small Business
- 5 Custom Google Analytics Dashboards in 5 Minutes from Traffic Generation Cafe
- Lots of Dashboards from Dashboard Junkie
Some of the above may have duplicates as lots of people re-share other’s dashboards, but you should find tons of gems regardless.
How to Create a Google Analytics Dashboard
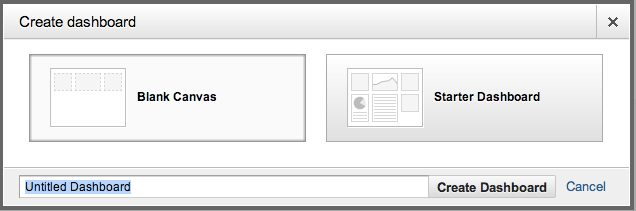
If you didn’t find what you are looking for in the above collections, you can also create your own. To create your own dashboard, click the +New Dashboard option under the Dashboards menu.
You will get the option to use a blank canvas or a starter dashboard with sample widgets created for you. The starter dashboard is best to get a feel for how different widgets work, and the samples can be deleted at any time.
The first dashboard you will want to create should include the top 12 things you check most often in Google Analytics for each of your websites. These could include:
- Active Visitors
- Audience Overview
- Location
- New vs. Returning Visitors
- Traffic Sources
- Organic Keywords
- Social Referrals
- Top Content
- Conversions
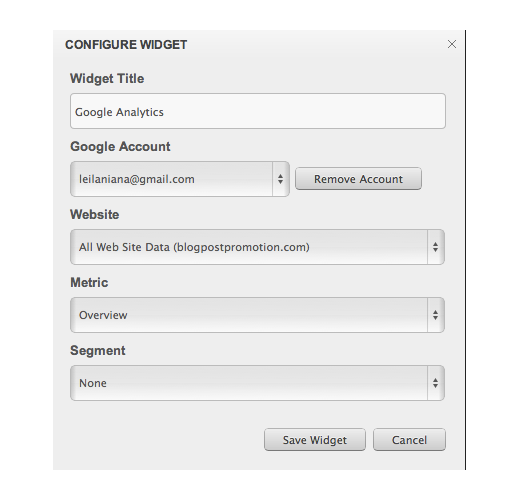
Widget Creation
To create a widget, click the +Add Widget in the top menu bar.
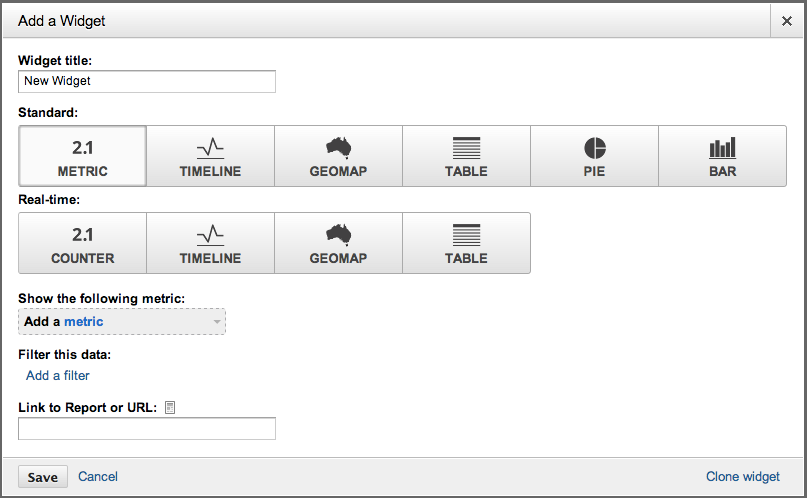
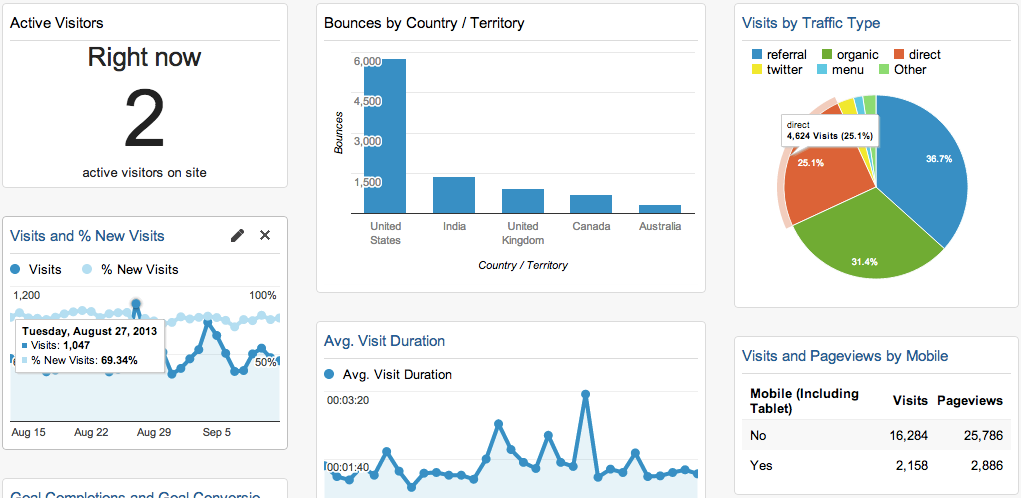
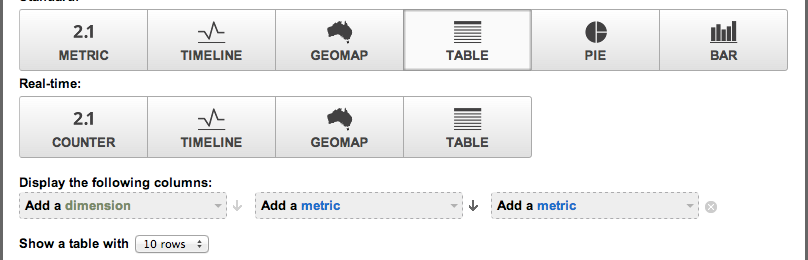
Here, you have several ways to display your data. Using this sample dashboard for reference…
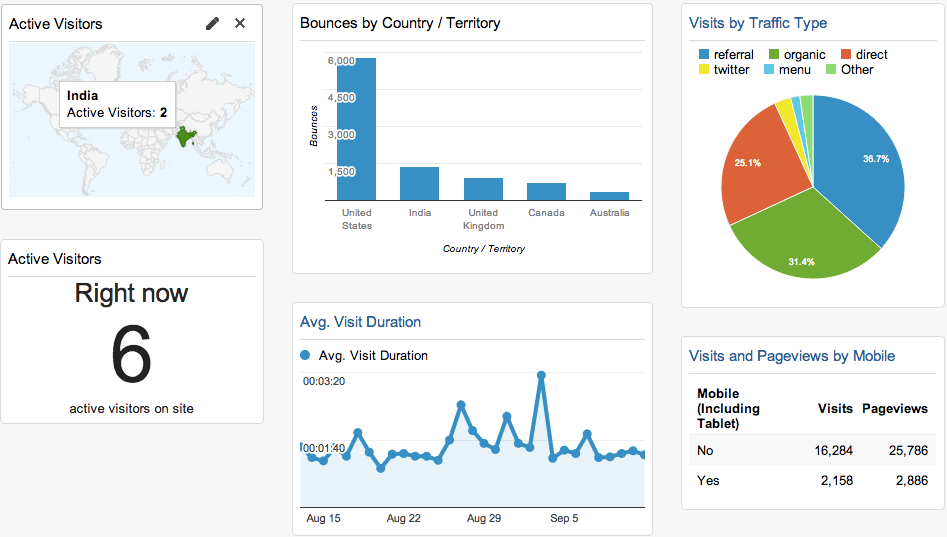
You can see (from left to right, top to bottom) an example of the geomap, bar, pie, metric, timeline, and table widget types. Depending on the type you choose, you will have a specific combination of dimensions and/or metrics to work with.
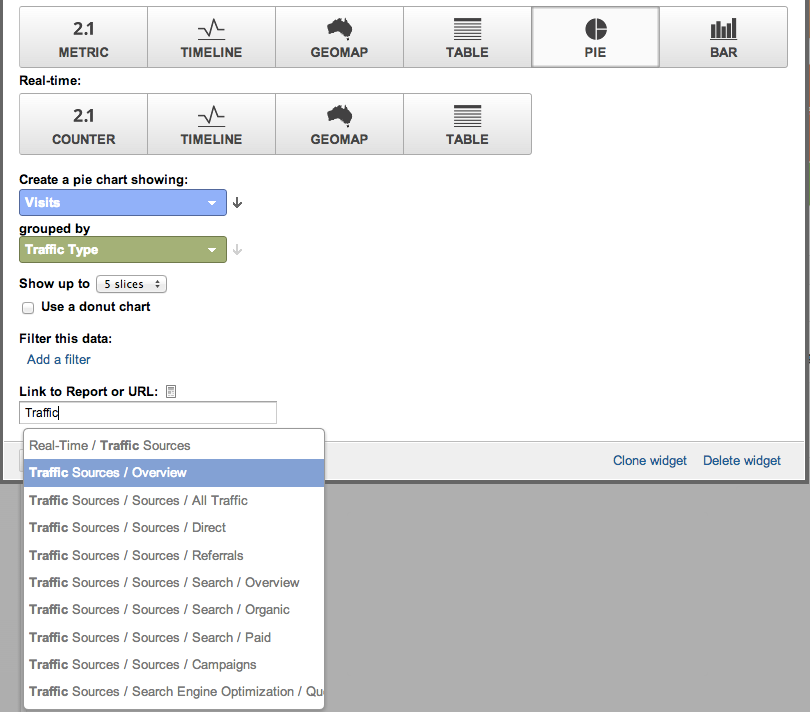
One of the best parts about your dashboard widgets is the ability to link them to specific reports within Google Analytics. This way, if you want to see more data, you can click on the widget and go straight to the report you need.
If you visited the samples above, you probably have plenty of great dashboard ideas already. My personal favorites are ones that show details about active visitors, conversions, traffic sources, top content, custom campaigns, and audience demographics / technology information.
Sharing Your Dashboards
If you have multiple website properties in your Google Analytics account, you can export your dashboards from one property and import them into another so you don’t have to create them again. To do this, click on Share in the top menu bar and then choose Share template link.
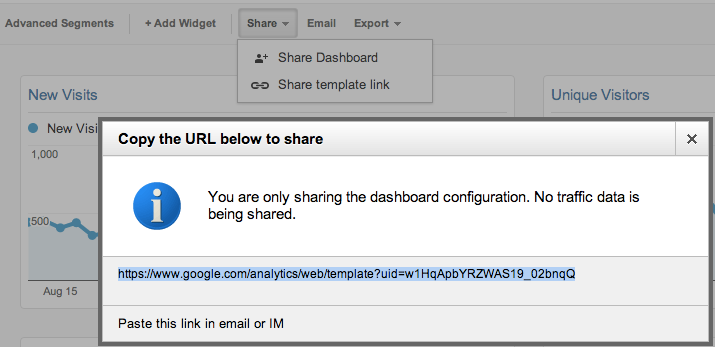
Copy & paste the URL into your browser’s address bar, choose the view you want to add the dashboard to, and click Create. This will add your dashboard to another website / property in your Google Analytics account.
You can learn more about creating and using dashboards in the Google Analytics Help Center.
An Alternative to Dashboards in Google Analytics
The one thing you can’t do with dashboards within Google Analytics is compare multiple sites’ data. You have to switch back and forth between properties and even accounts in order to do this. But if you are managing multiple websites for multiple clients, it can be a hassle when you need to review your data.
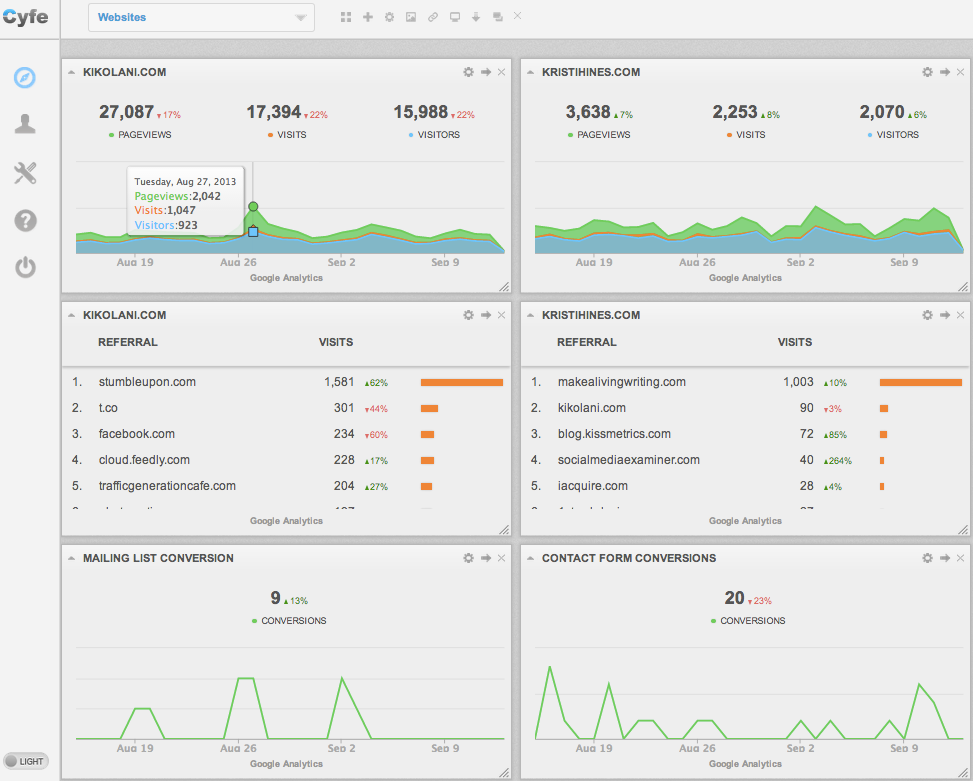
Fortunately, there is a tool that can save you some time. Cyfe is an all-in-one business dashboard that allows you to monitor multiple sources of data in one place. With a premium account (only $19 per month), you can have unlimited dashboards, each with unlimited widgets. While you can’t get as granular as you could within Google Analytics, you can use Cyfe to create widgets for over 60 metrics covering Audience, Content, Conversion, Ecommerce, Event, and Traffic Source data. Any custom segments you have created in your account can filter each of these widgets.
Once configured, you can look at multiple websites’ data all at once, including websites from different Google accounts without a limit on the number of dashboards you can create or widgets you can use within each dashboard.
You can also add other data to these dashboards including information from Google Webmaster Tools, Alexa, social networks, and many other sources. If you want to keep yourself, your boss, or clients up-to-date, you can have Cyfe send a report based on information within a dashboard on a regular basis. For clients, you can give them access to individual dashboards for regular review.
In Conclusion…
Google Analytics dashboards allow you to create visual shortcuts to the most important data within your Google Analytics account. If you’re ready to get serious about Google Analytics dashboards, you can either create your own or choose from the many free, shared dashboards throughout the web. To compare Google Analytics dashboards from multiple sites at a time, or alongside other important business data, you can choose to use tools like Cyfe.
What are your favorite Google Analytics dashboards? Please share in the comments!
About the Author: Kristi Hines is a freelance writer, professional blogger, and social media enthusiast.
Comments (30)