Google Analytics is a powerful ally in boosting your conversion rate. A lot of conversion rate optimization strategies begin with user testing and serving variations of the same web page to a relatively small subset of visitors. That’s like a doctor prescribing medicine before making a diagnosis.
You need to find the problems that are affecting your conversion rate first before you start trying to change things. The vast amount of analytics data at your fingertips can help you discover obvious conversion issues, many of which can be quickly resolved.
Before you bang your head against a wall trying to figure out the sources of your conversion woes, load up these five reports to get easy answers.
Each section contains a link to a Google Analytics custom report. Apply it to your view and follow along.
1. Keep Up with the Screens
With desktops, laptops, smartphones, tablets, and now the newly dubbed “phablets,” people are accessing your website on a variety of devices with different screen resolutions. It helps to have a responsive website that will adjust to these different devices, but if you’re not monitoring the data, then you are not seeing where your site design is failing.
Goal: To find screen resolutions at which your responsive or mobile site design is providing a poor user experience.
On the surface, this report looks a lot like the one found at Audience > Mobile > Overview. However, this one will allow you to drill into each device category to see data corresponding to screen resolution and device information (mobile devices only). Follow these steps:
1. Apply the custom report
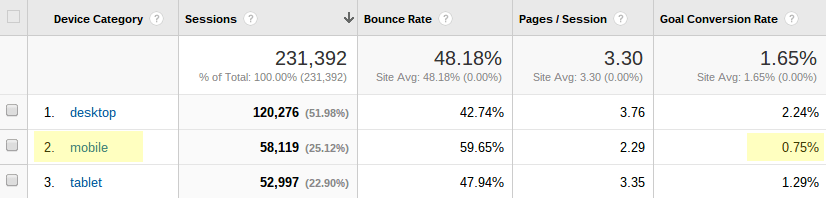
2. Look at the category-level metrics
Decide which device category you want to drill into further. In the example above, conversion rates are significantly lower for mobile phones.
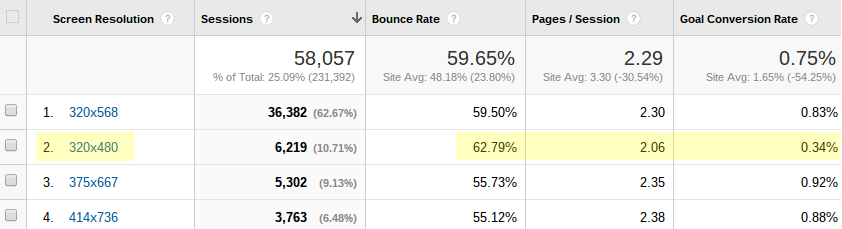
3. Look at the most common screen resolutions for that device category
Try to identify which dimensions correspond with lower-than-average behavior metrics and conversion rate. It’s 320×480 in the example above.
If you click on a screen resolution, you’re given the device brand and model for devices that accessed your site with those dimensions. In this case, the culprit was a first generation iPhone.
Once you know the screen resolutions and devices that your website design is failing on, you can do a few things to troubleshoot the underlying issues. The best solution is to access your website using the devices you’ve identified. However, you might not have an older generation iPhone just lying around. In that case, you have a few other options:
- For responsive websites, a simple solution is to resize your desktop browser to the appropriate screen resolution. For Chrome, you can install the free Window Resizer plugin to quickly snap your browser to the desired dimensions. Similarly, for Firefox, you can try out Responsive Design Mode.
- Plug your website into a browser-based emulator like Screenfly. It will display your website based on sizes of popular devices, or you can set your own custom dimensions. You can easily switch between landscape and portrait modes with this option.
So, find out why your website design is breaking, have a front-end developer fix it, and you’ll have plugged up this conversion leak.
2. Know When Your Visitors Are Converting
Do you convert more visitors during the week or on weekends? Business hours or after work? Knowing when your visitors convert can have important implications for site messaging, social media marketing, and online advertising campaigns.
Goal: To learn when users are most likely to convert.
Then, follow these steps:
1. Apply the custom report
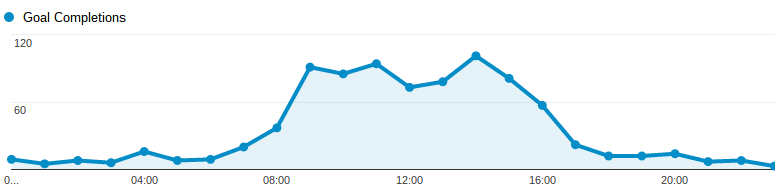
2. You’ll get a very helpful graph showing your website’s goal completions by hour
Hours are based on the 24-hour clock. The graph above shows goal completions peaking between 9:00 a.m. and 2:00 p.m. Note: the time zone is based on your settings under Admin > View Settings.
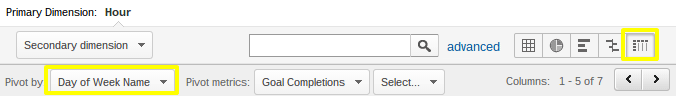
3. Connect the time of goal completions with the day of the week
For this, we want to build a pivot table. Select the pivot icon at the top right-hand corner of the table. Change the “Pivot by” dropdown to “Day of Week Name.”

4. The table you’ll end up with organizes goal completions by the hour and day of the week
Find when your users are most and least likely to convert.
Understanding when your users are more likely to convert can be helpful in many of your online marketing initiatives. For example, the users represented in the table above convert most often on Thursdays over lunch. However, they’re much less likely to convert on Tuesdays at the same time. In this scenario, changing the messaging or a CTA on Thursday to reference a lunch break would resonate well with your audience at that time.
Similar lessons can be applied to time your social media posts, email newsletters, PPC ads, and blog posts to get in front of your audience when they’re most likely to convert.
3. Monitor Your Site Performance
Your site is losing money with every second that ticks by. So much of conversion rate optimization focuses on design and messaging, but your visitors may be bouncing before they even get that far.
Goal: To identify slow-loading sections of your website that are causing your conversion rate to suffer.
There are a few metrics available in Google Analytics to measure page speed. We’ll focus on Average Document Interactive Time. This is the average time (in seconds) that it takes for a page to be rendered so that a user can interact with it. Follow these steps:
1. Apply the custom report

2. Look at with the “Comparison” view
It is found at the upper right-hand side of the table. Select “Avg. Document Interactive Time” from the dropdown menu to compare load times of your most viewed pages against the site average. You’ll be able to pick out your poor performing pages.
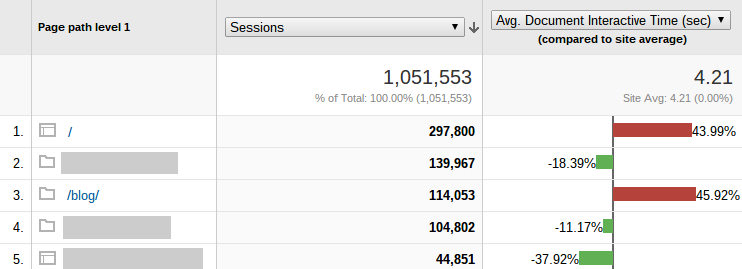
3. Find slow-loading web pages
Then, use the dropdown to see if load time correlates with poor behavior metrics or a poor conversion rate. Above, we see that this site’s homepage and blog are very slow. These are the two areas of the site that new visitors enter through most often, and therefore, are important to the top of the conversion funnel.
Using some free online tools, we can quickly figure out why these pages are lagging behind the site average. My favorite is the Pingdom Website Speed Test. It provides an analysis of the page so that you can figure out what’s causing the slowness, whether it’s scripts, images, or another issue.
Speeding up key areas of your site will free up clogs in your conversion funnel and allow your users to move quickly through their desired actions.
4. Find Low-Converting “Keywords”
We’re all well aware that organic keyword data is no longer provided by Google Analytics. This does not mean, however, that you can’t get key insights into how your web pages perform in organic search results.
There are a number of ways to unlock keyword data in Google Analytics, and this report will help you focus your keyword targeting.
Goal: To optimize your website’s landing pages for high-converting search terms.
If you’re paying attention to your site’s SEO, you’re probably optimizing your page titles to target relevant keywords. This report shows the performance of your website’s landing pages, filtering for organic search traffic, split by page title (or target keywords). Essentially, we’re A/B split testing our page titles here. Follow these steps:
1. Apply the custom report

2. You’ll see your site’s landing pages ordered by organic searches
As a secondary dimension, you’ll see page titles associated with those landing pages and other pages that users visited while on your site. It’s a good idea to expand the date range for this report, especially if you’ve refreshed your page titles recently.
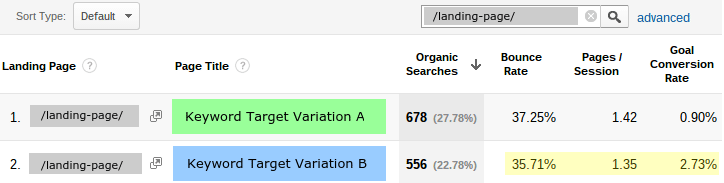
3. Use the search box or the advanced filtering to search URLs or keywords
In the example above, the page title on a single landing page was changed to target a longer-tail keyword. This change corresponded with a 200% increase in the page’s conversion rate.
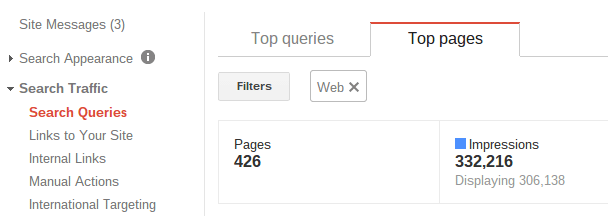
4. You can take this report one step further by going to your Google Search Console account
Once logged in, click Search Traffic > Search Queries, and change the tab at the top to “Top pages.”
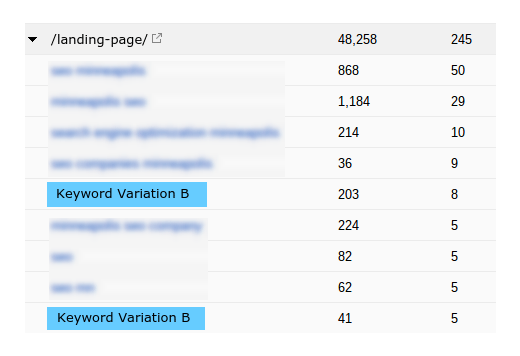
5. Find your landing page in the table
If there is keyword data associated with that page, you will see an arrow to the left of the URL. Click this arrow and see how your keywords are performing. Above, you can see that the Variation B keyword from the page title is driving high-quality clicks to the page.
After auditing a few of your top landing pages with this report, you’ll start to uncover commonalities among the high-converting keywords. Perhaps they’re location-specific or include sales qualifiers. Apply these lessons to your low-converting landing pages, and use this report to test the results.
5. Check Your Visitor Behavior by Browser Type
Most people pick their preferred browser and stick with it. When is the last time you audited your website with Internet Explorer or Safari? It’s very common to overlook compatibility issues with your site’s code and how it renders on popular browsers.
Goal: To identify technical and UX issues that are specific to a browser type.
Thanks to Craig Sullivan of Optimal Visit for sharing his favorite analytics report.
Follow these steps:
1. Apply the custom report

2. Check the behavior metrics and conversion rates for the various browsers and versions
The website above, for example, is clearly having issues with Safari.
3. Apply advanced segments for desktop, mobile, and tablet devices
If you’ve identified cross-browser compatibility issues, your next step is to view your site on the affected browser. However, if you have a different browser version installed or the specific browser in question is limited to a device you don’t own, you might want to invest in a tool like BrowserStack.
Conclusion
Most of the issues you’ll find with these five analytics reports will have a simple fix. You just need to find the problem. Watch these reports on a regular basis, take action, and you’ll see an immediate improvement in your site’s ability to convert visitors.
What analytics reports do you use to increase conversions?
About the Author: Griffin Roer is the Director of Strategy for Snap Agency, a Minneapolis-based digital agency that specializes in e-commerce marketing. He likes using data to develop strategy recommendations that increase traffic, conversions, and online sales.
Comments (2)