
Let me start out with an obvious fact: Site speed matters for SEO.
Any junior SEO could tell you that. But I wanted to know something more important: how and why do page load times matter?
We didn’t realize it when we started this research about page load times, but we were about to uncover a specific speed factor that Google uses to rank your website. It’s not just speed alone that matters, but a specific type of speed of page load times that makes the real difference.
The study you’re about to read is the largest study of the impact of website speed on Google search rankings ever performed. Ahrefs contributed search ranking data, but it took massive amounts of crawling, collating, and crunching the data on our part to get accurate search results.
We surfaced several highly significant findings. These findings are significant, partly because they’ve never been revealed before, but also because they could make a massive impact on your website’s search rankings!
Why go to all the trouble to conduct this study?
Some people wonder why I’ve bothered to produce these massive data-driven studies like the one on Hummingbird and Google Local search results. Why go to all the time, hassle, and cost to produce this particular study on page load time and Google search rankings?
Here’s why:
- The last major data-driven study on page load time and Google search rankings was done two years ago! We don’t have up to date data analysis on this important topic.
- Google has made massive algorithm changes in the past two years, and has been vocal about the importance of speed.
- User experience and page load time have merged in a way. The user experience of a web site is now influenced by page load time, and vice versa.
- I’m curious! I want to know how my own websites are ranking based on page load time, and what I can do to improve their search rankings!
- It boils down to this: I want to give search engine optimization strategists the most advanced, reliable, and actionable data possible. In the end, it’s foolish to rely on hunches about how search engine optimization works, or how the algorithm operates.
What I want to do is give you rock-solid data that you can bank on 100%. I want you to be able to to take action that gets results.
What we already know about page load time, and what we set out to learn
Like I mentioned already page load time is an important search engine optimization factor. It’s not just important for search engine optimization! A faster website increases conversions, too.
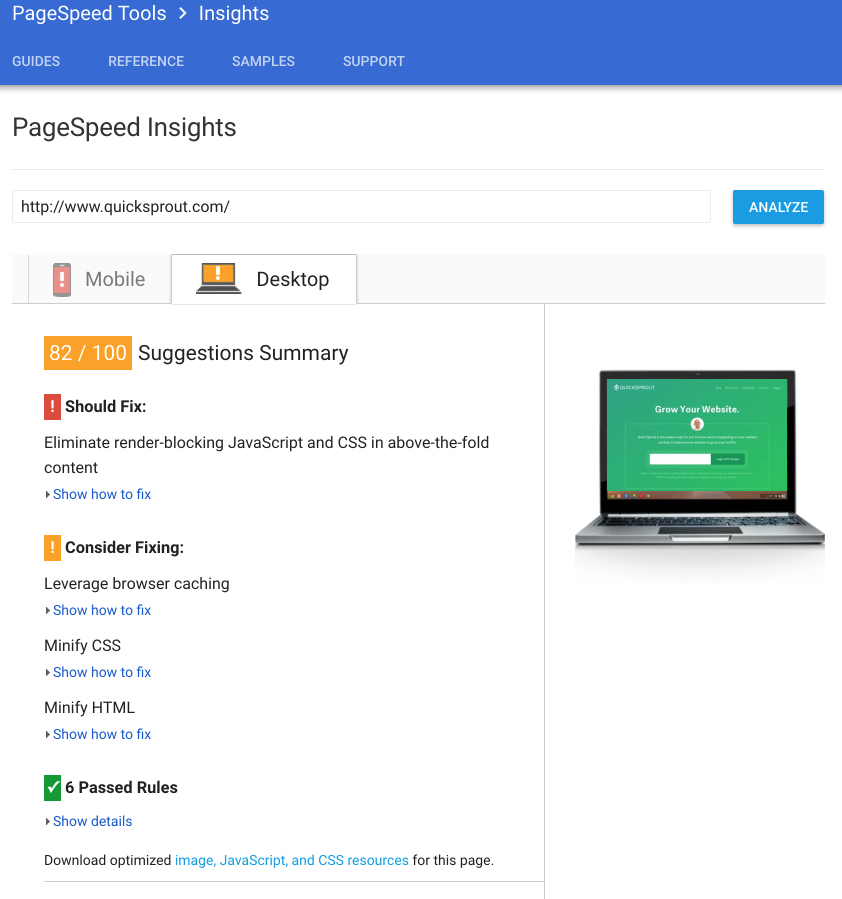
But if you’ve ever dug into pagespeed metrics, you realize that gets way more complicated than just a readout on a clock. In fact, Google’s own PageSpeed Insights doesn’t even give you a timing result!
Helpful as it is, you can’t simply rely on a Pingdom test, for example, to furnish reliable data on page load time, let alone how that speed impacts your Google rankings.
There are so many other factors involved in page load time. What about the impact of plugins, image size, caching, cache validating, server response time, server response codes, time to first byte (TTFB), render rates, server location, DNS lookups, parallelized downloads, encoded headers, static content, code minification, redirects, and all the other factors that play a role?
Like I said, it gets complicated.
I wanted to slice away all the complication, and give you one major insights. (Just one!) But to do so I needed to collect, refine, analyze, parse, configure, and basically digest a whole bunch of data. That’s where those 143,827 URLS come in.
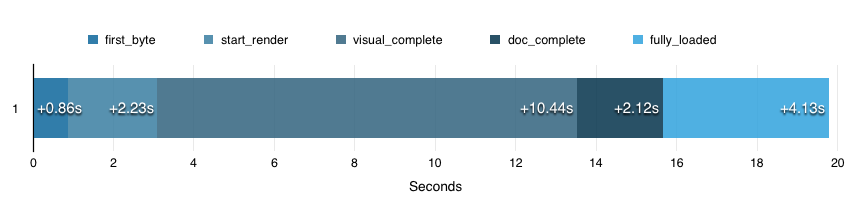
For each URL we measured five following metrics that are part of page load time:
- Time To First Byte: When your browser goes to a URL, it sends a message to the server asking for the HTML document at that URL. This measures the amount of page load time for the first little bit of website data is sent to your browser. A fast page load time here might indicate the rest of the site will load quickly.
- Start Render: Rendering happens when a computer turns code into the visual display you see on your screen. Start render is when the first visual part of a website appears. This is useful for users because it let’s them know that the website is doing something.
- Visually Complete: This is when the rendering processed is finished and the site is fully visible to the user.
- Document Complete: Even though the site is visually complete, there are still some operations going on in the background. Once these are finished, the server indicates that the HTML document is finished loading. This is the most technically accurate measure of “site loaded.”
- Fully Loaded: After the document is completed, it is normal for the asynchronous code to start running and loading more items. This does not stop the user from interacting with the site so it is usually not considered to be part of the page load time. This metric is measured when all loading activity has ceased for 2 seconds.
- Number of file requests: When a site is loaded, it is still requesting multiple files such as CSS, JS, or image files. Loading many small files can unnecessarily slow down page load time, so they should usually be minimized.
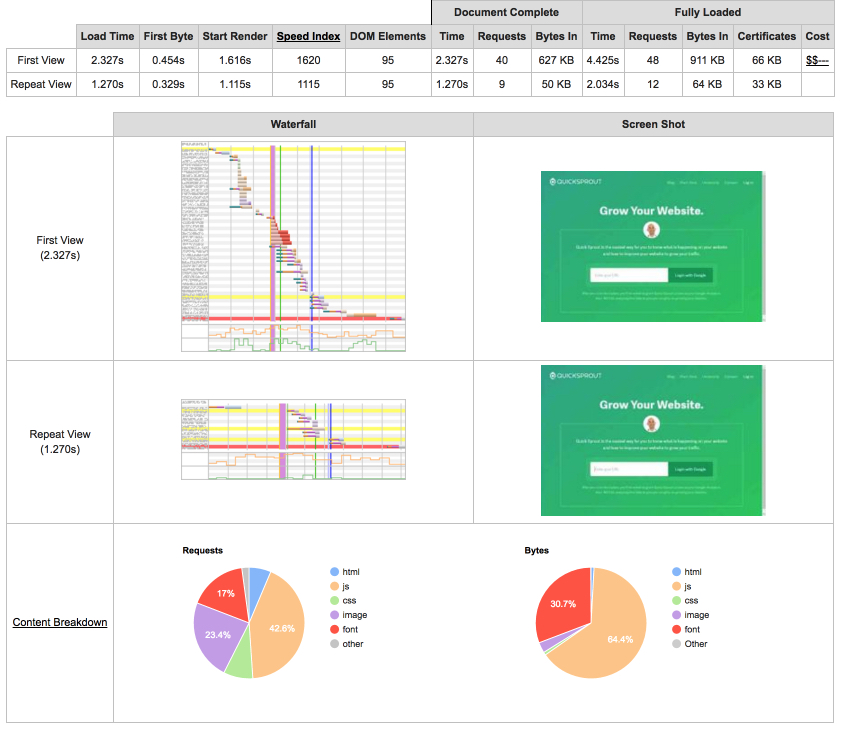
Here is how these metrics appear on a site speed measurement chart:
For our testing we used the free site speed measurement tool, www.webpagetest.org.
Using an API, we crawled each of the 143,827 URLs to perform extensive site speed testing and analysis.
We had a lot of numbers to crunch! It took 100 AWS EC2 servers more than two days to crawl the URLs, run tests on them, and produce metrics.
Here is how we conducted the study:
- Each testing agent was running Chrome on Windows with a 1024×768 desktop screen.
- To determine the URLs to crawl, we generated 5,000 random keywords with a monthly search volume of more than 10 per month in order to ensure we were using a representative sample of all types of keywords, from head terms to longtails.
- We tracked the top 30 Google search results for each keyword (non-mobile).
Results of the Study
Now for the geeky good stuff.
As expected, we confirmed that faster site speed did correlate with higher Google search rankings.
But why? The data surprised us.
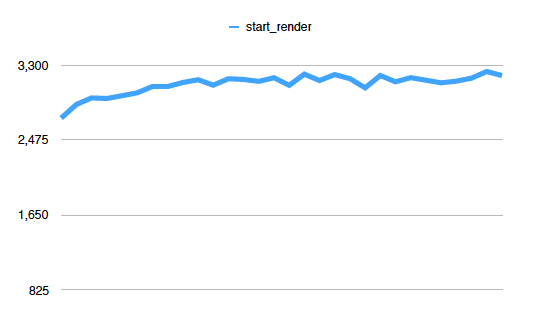
First, let’s check out some of the data. Top-ranked websites have high site speeds in the “start rendering” metric.
Notice the data in the following chart. The numbers on the x-axis (at the bottom of the chart) indicate the website’s Google rank position. The y-axis denotes site speed in milliseconds.
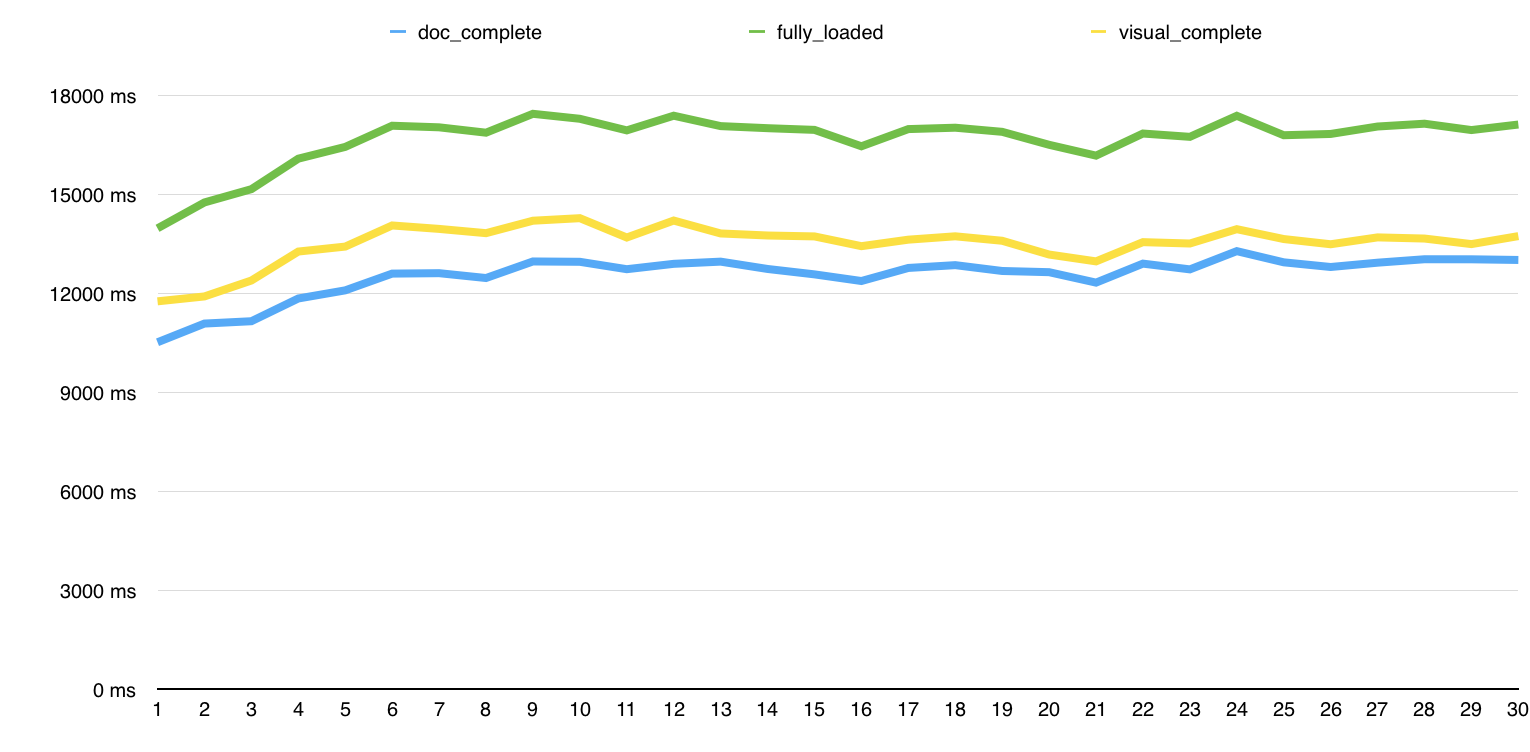
The chart indicates that overall page load time is especially faster for the first five positions. Rank 6 was, on average, 20% slower than rank 1.
The data suggests that improving start render times contributes directly to a higher Google result.
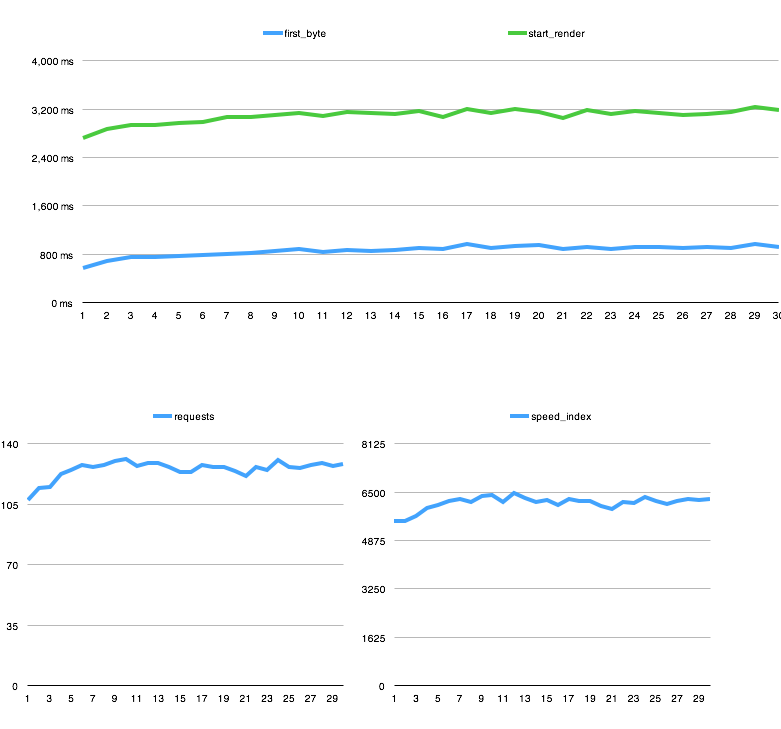
Additionally, we corroborated the findings of other research, that top-ranked websites have faster site speeds for page load time to first byte (TTFB). This was the largest correlation noted in our study. Notice how the chart below, tracking only TTFB speeds, has a massive increase in site speed between positions 1, 2, and 3.
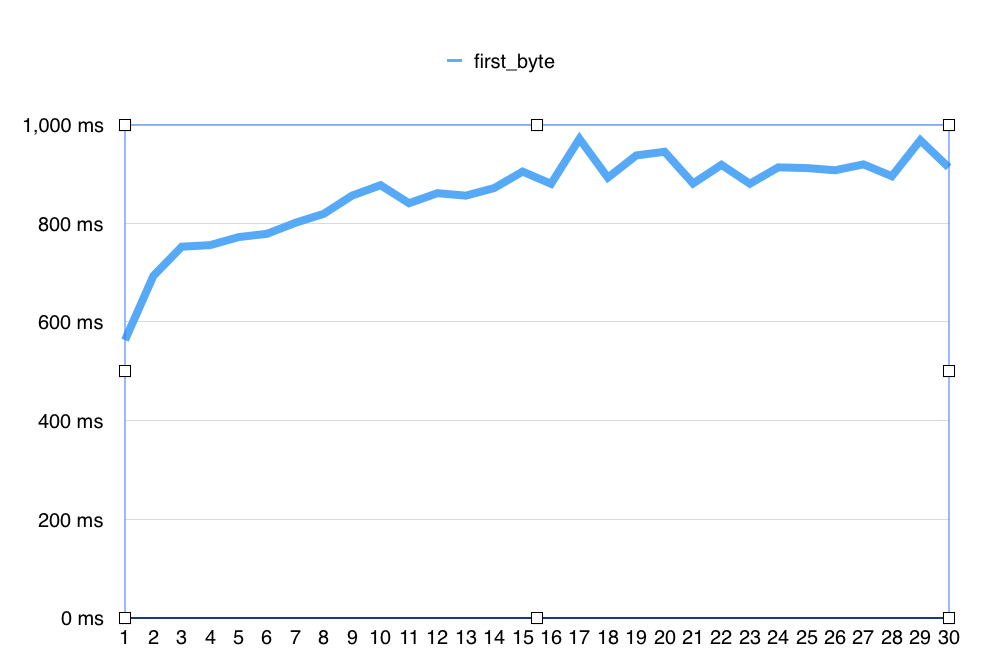
Notice how TTFB correlation (chart above) is far higher than start render (chart below).
To make the point visually again, TTFB has significant differentiation from the next closest metric, which is start render (chart below).
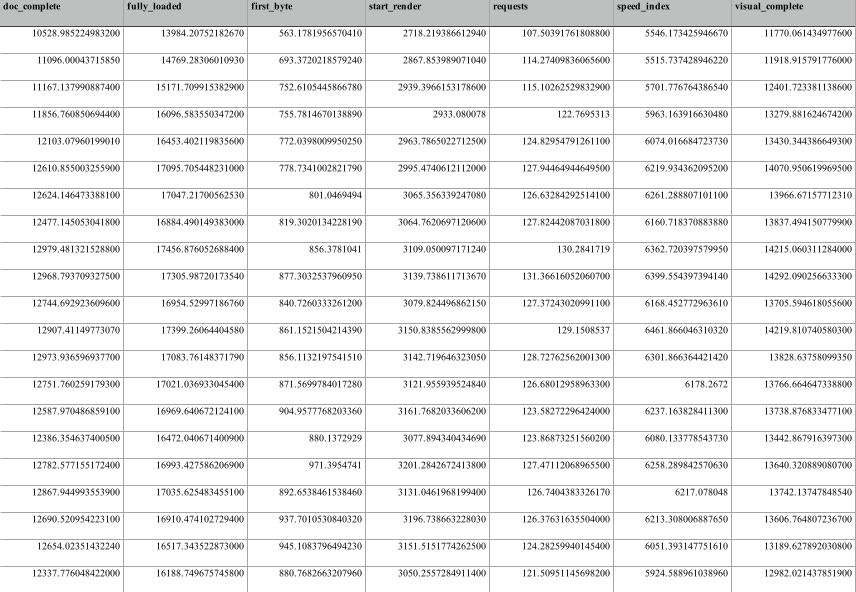
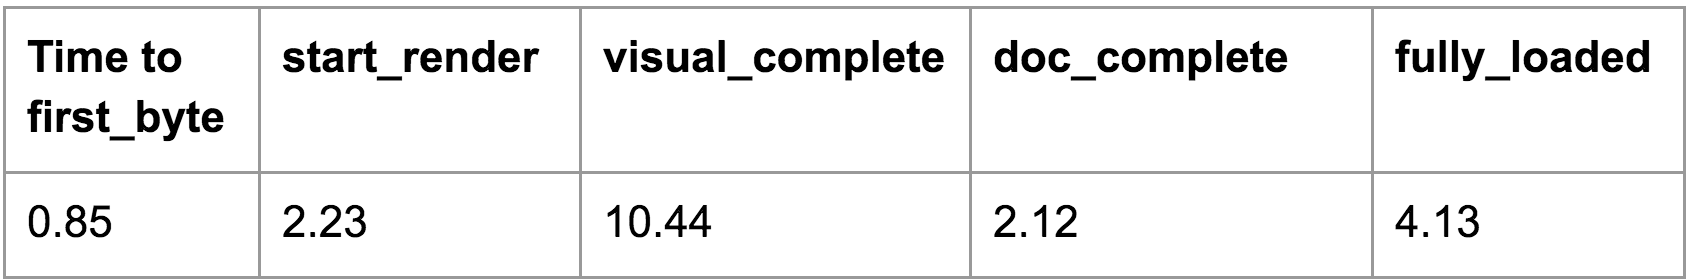
Averaged out across all 143,827 URLs, here is what we found:
Now, take a look at the correlation search rankings of each of these page load time measurements:
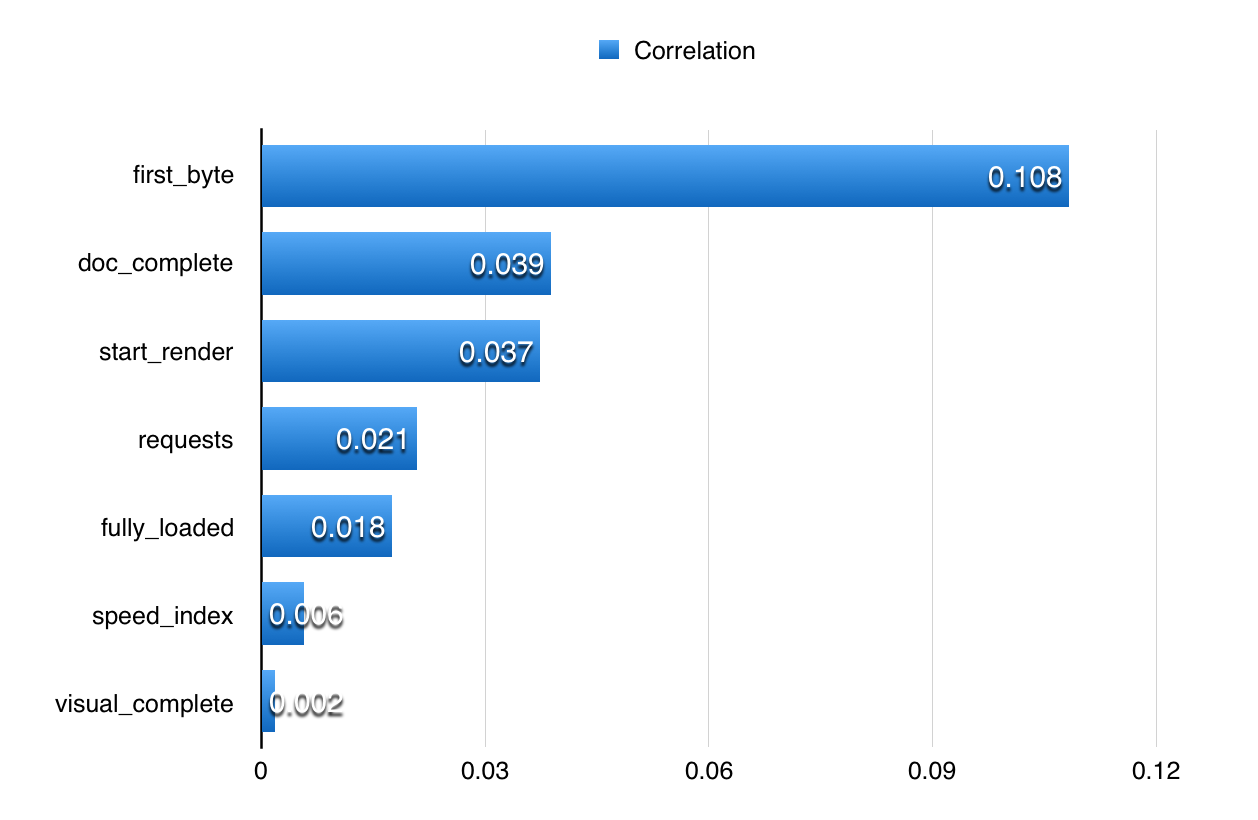
Because TTFB has such a pronounced impact on search rankings, it’s easy to overlook the impact of of the lesser significant site speed rankings.
When you combined doc complete and start render, their correlative impact is approaching the total correlation score of TTFB.
Although TTFB correlation is high, our research uncovered a new angle to site speed and search rankings impact. Google does not consider a simplified TTFB score alone as they did in the past. Today, they are looking at the more sophisticated interplay of doc complete and start render, and using these site speed factors as search rankings signals in addition to the TTFB measurements.
This angle of observation goes beyond the simple “fix your TTFB problems and all will be well.” As our research uncovered, Google is doing a far more accurate job of analyzing meaningful site speed metrics.
It is strategic to address doc complete and start render timing metrics, because these can accrue to improved search rankings.
Why the big emphasis on TTFB?
What’s going on here? Why is TTFB such a massively significant search rankings factor?
I tend to think it boils down to user experience. Have you ever read Google’s company philosophy? They wrote these ten principles for improving user experience when the company was young.
- The most important truth is this: Focus on the user and all else will follow.
- The third most important truth is this: Fast is better than slow.
Taken together, it seems a safe assumption that TTFB is a significant user factor. If Google gives a site with high TTFB speed a higher ranking, this search rankings uptick suggests that they perceive this site as having a superior user experience.
Even though TTFB is a massively significant ranking factor, it remains important to make page load time improvements wherever possible on the other elements of site speed.
That’s why our research is significant. By plotting the correlative significance of “lesser” site speed metrics — document complete and start render in particular — we can see that their cumulative impact is nearly as great as TTFB’s.
How to improve your TTFB
Most basic search engine optimization articles will tell you how to improve your site speed. However, this is not a basic search engine optimization article, nor do you need to hear someone say “improve your site speed.” Instead, you need to focus on improving specific aspects of a page load time.
You can start by measuring your site’s current TTFB.
First, go to www.webpagetest.org, and enter your website’s URL. Click “Start Test.”
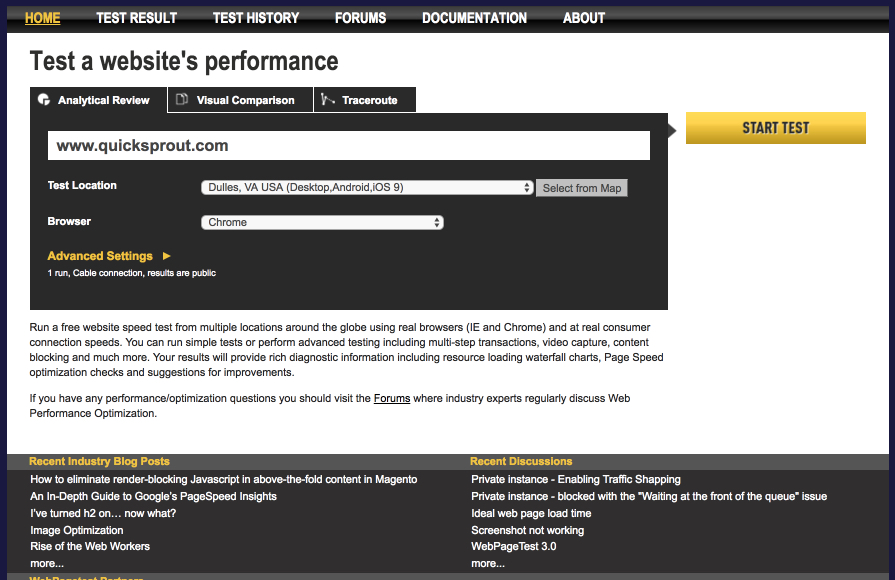
Adjust the “test location” to find the server that is geographically closest to where the majority of your users are. If you know that your users use a browser other than Chrome, you can also change the browser setting.
I recommend keeping the “Advanced Settings” as they are unless you have some user experience or advanced knowledge about speed tests that would influence the search results you’re looking for.
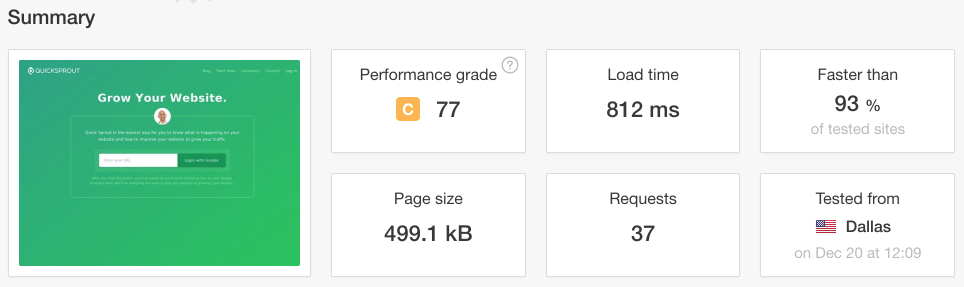
The test usually takes less than one minute to complete. When it is finished, look for the “first byte” number in the chart.
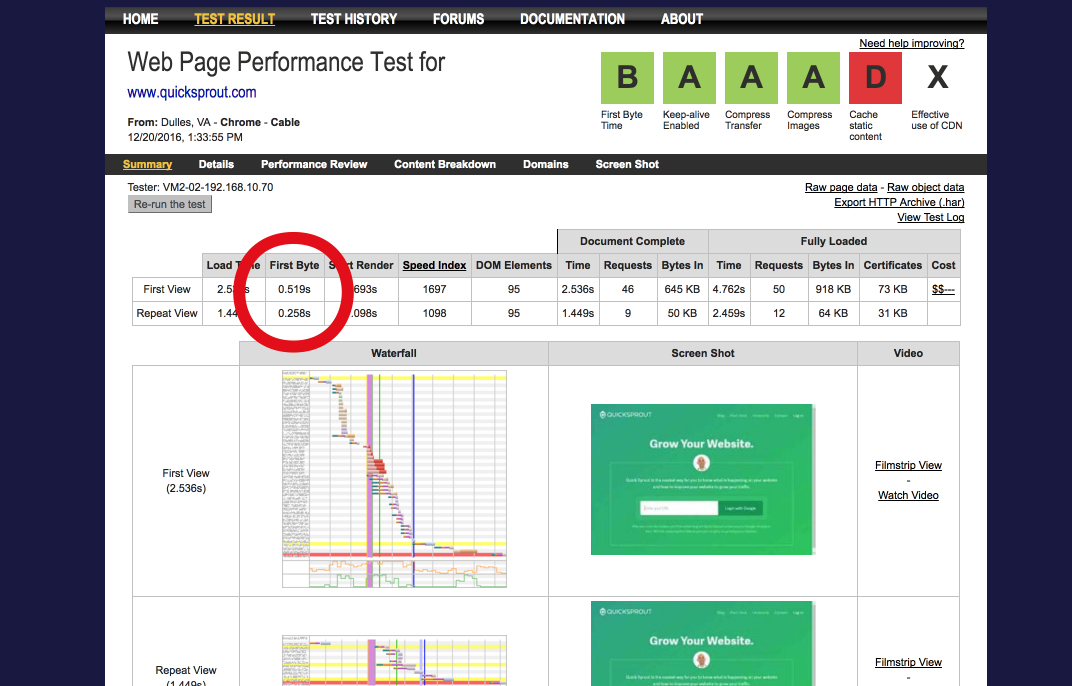
This is your page’s TTFB. If you’re really geeking out on the data at this point, click the “first view” chart for an expanded view of the waterfall, connection, and request details.
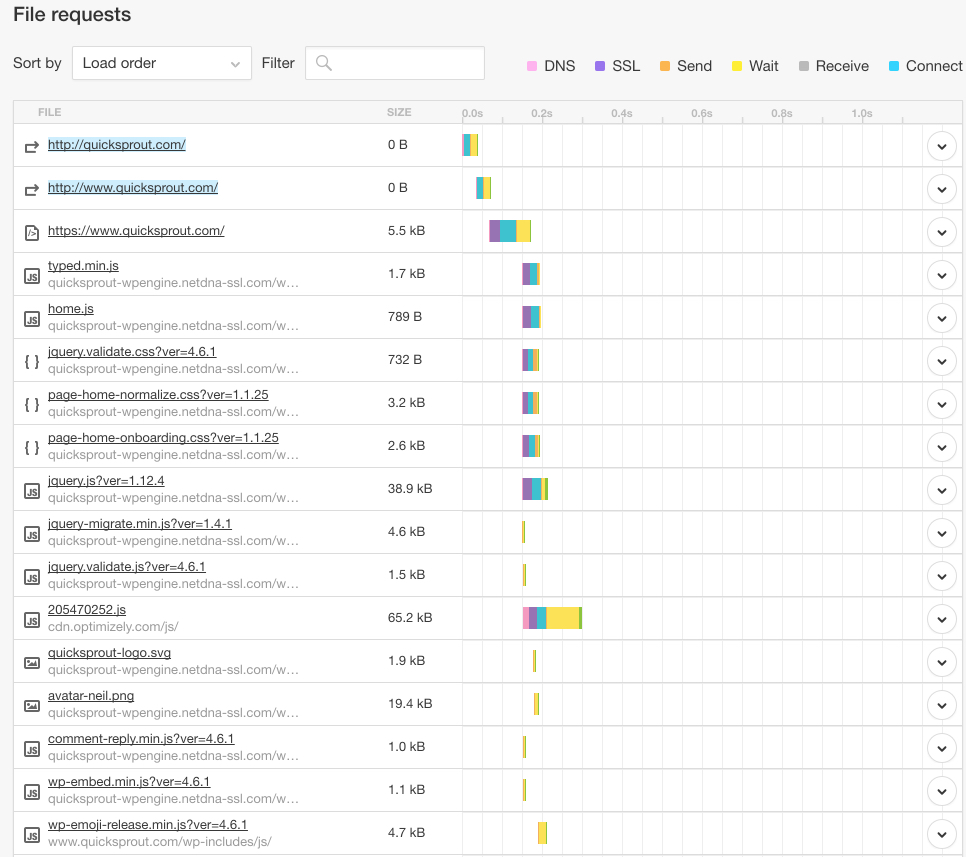
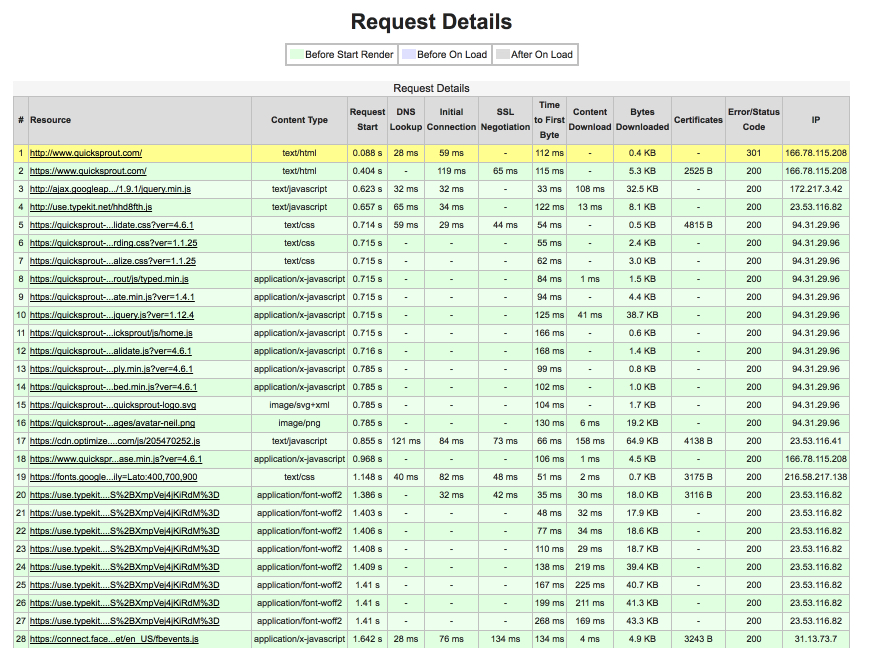
The “request details” chart tabulates the TTFB for all the site’s resources:
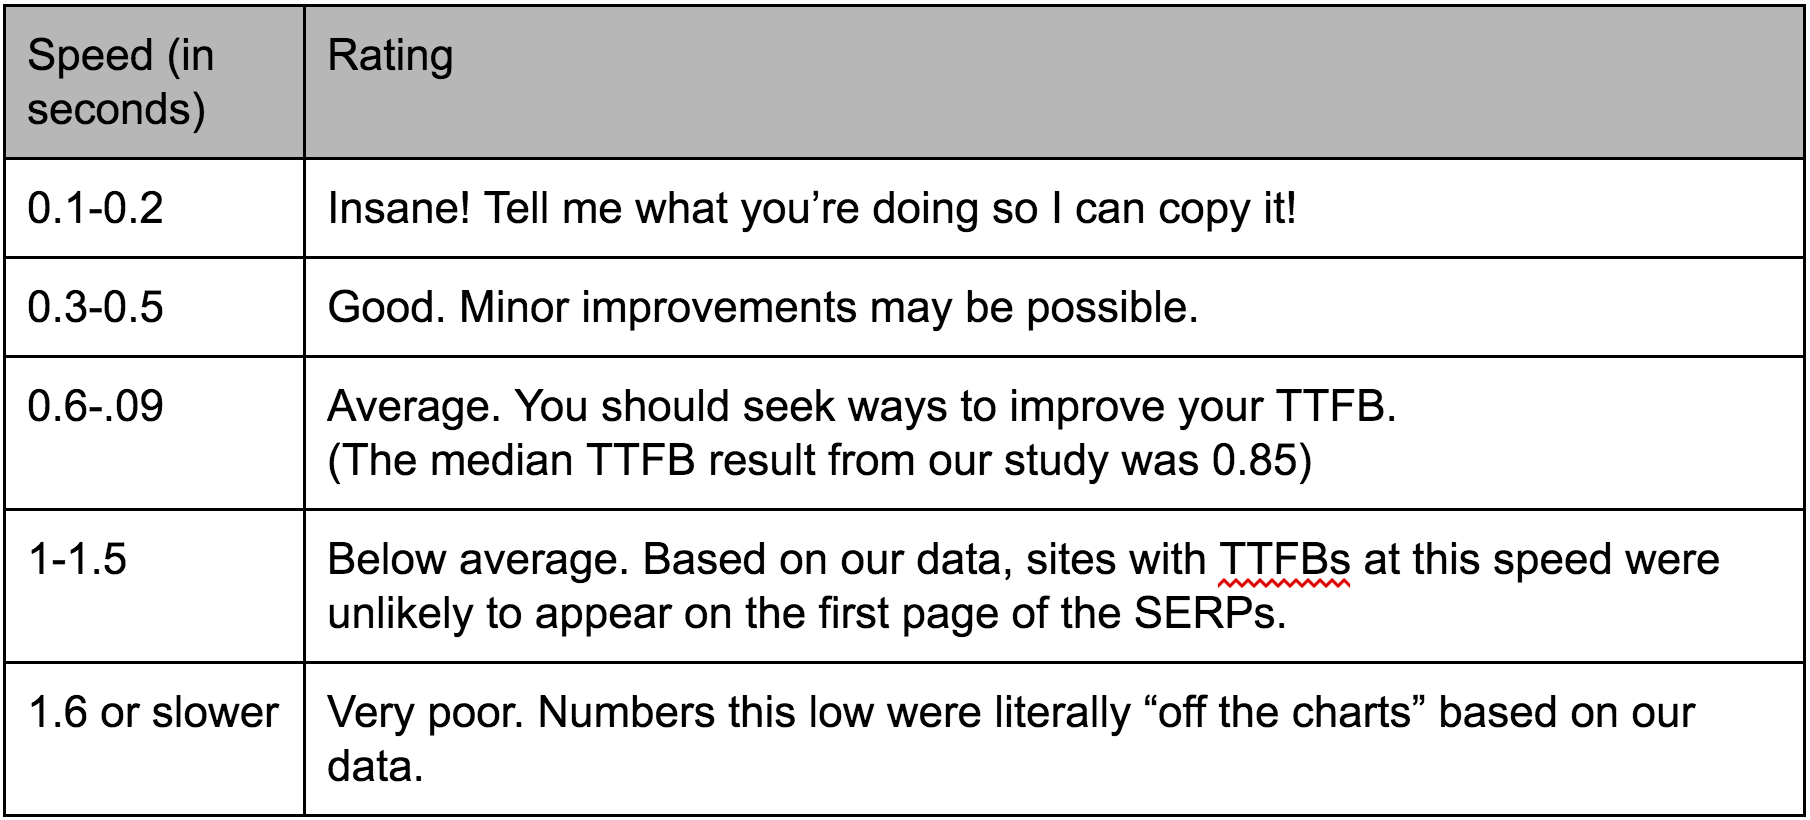
How do you know if your TTFB needs improving? Here is a suggested guide:
Do you think your TTFB needs improvement? These six methods are guaranteed to amp up your TTFB. (Pro tip: Hand this list to your developer. He or she will know what to do.)
- Use a CDN.
- Optimize application code.
- Optimize database queries.
- Reduce HTTP requests.
- Ensure fast server response time.
- Use a respond first, process later (RFPL) method for caching.
Conclusion and three really important takeaways
Takeaway #1: Site speed is important, but it’s just one ranking factor among many.
Like most ranking factors, page load time alone won’t earn you a top spot on the SERPs, but a slow speed will hold you back from ranking higher. So what should you do? Try to improve your site speed, but keep optimizing your other search factors as well.
Takeaway #2: UX is super important.
Keep in mind as well that Google really likes a good UX. Stripping down your site to a few bare-bones lines of HTML won’t necessarily boost your search rankings, however, if you’ve destroyed the visual appeal or overall UX of the site in the process. You need both to optimize site speed and user experience to improve your search rankings.
Without a credible user experience, you don’t have a satisfied audience.
Takeaway #3: Optimize your TTFB first!
When you’re in the weeds of optimizing your site speed, play smart. Instead of trying hard to push down your document complete, start rendering, or fully loaded page load time metrics (all of which are important), focus on the highest-impact metric first: TTFB.
What’s next? Call your developer, or roll up your sleeves and start tackling TTFB! You’ll be super glad you did!
I’m always eager to hear success stories — how data like this has a real world impact. Tell me what changes you made on your site, and how it improved things!
Comments (108)