
Everyone wants to build a high-converting CTA for their website that makes them tons of money.
But the reality is that while a single element of your site may be the focal point, it’s not the only part that leads visitors to make a purchase.
Often, a visitor will come to your site multiple times before they decide to buy or initiate any meaningful interaction with your brand.
So the real question is, how do you track those people and optimize your content so that you can still capture them in your sales funnel?
That means you shouldn’t just focus on the big CTAs. You should also focus on how elements like links and “smaller” CTAs perform on your blog posts.
But that requires a lot more effort on your part and will likely require some solid justification.
Is tracking individual links and CTA clicks worth it?
And how do you even accomplish that?
I want to help answer those questions for you in a way that will help you grow in the long run.
So let’s start by tackling that first question – is all of this worth it?
Do individual clicks really matter?
Think of all of the different elements on a blog post.
Just to name a few, you have internal links, external links, images, CTAs, social sharing buttons, and comments.
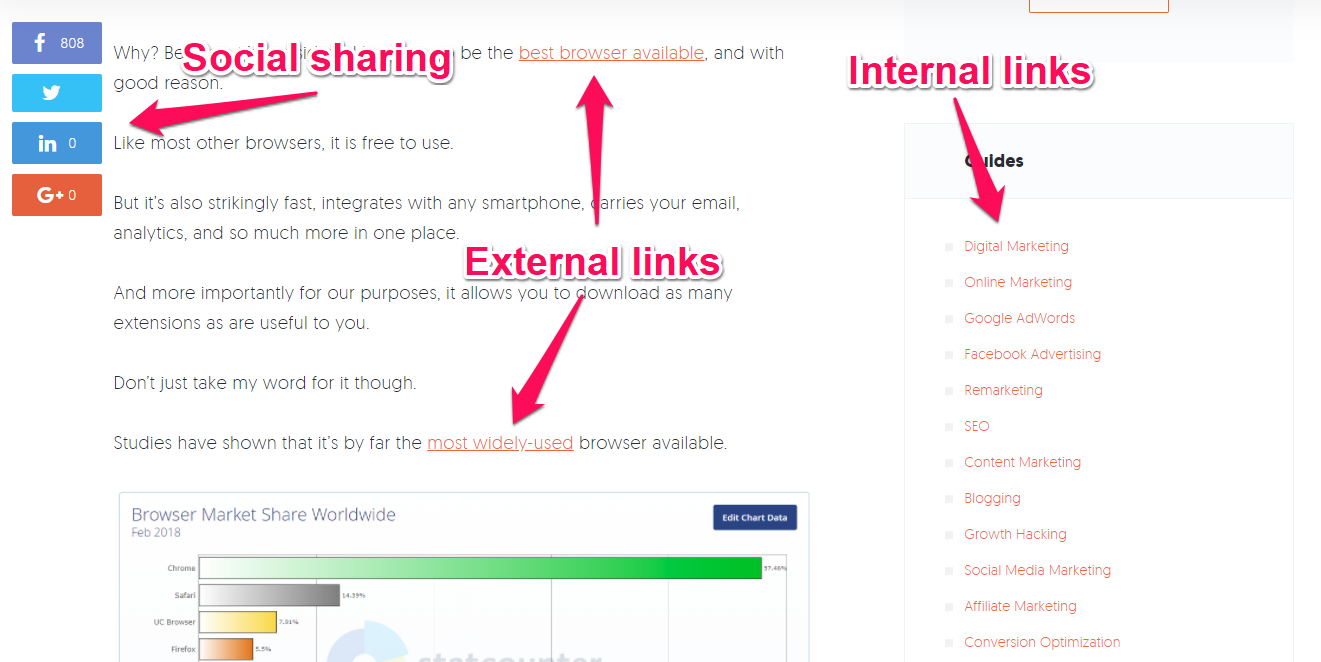
When you consider how all of these elements work together to create a cohesive blog post, it’s easy to become overwhelmed by how many moving pieces there are.
And then you have to answer one very important question:
Which of these elements is actually being clicked and contributing to the overall “macro” click-through rates and revenue?
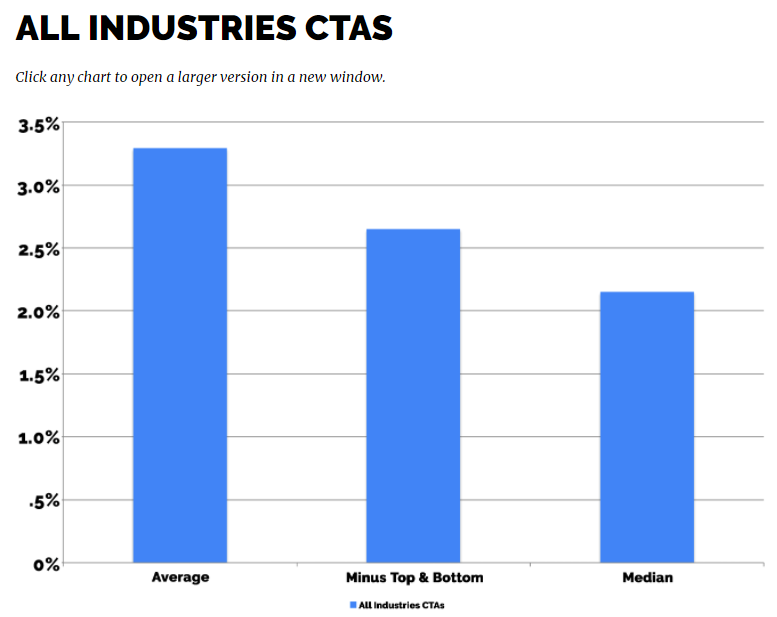
When it comes to optimizing your website, click-through rates are the metric that marketers look toward to help evaluate the overall profitability of a page.
And depending on what you’re selling, your click-through rates will vary drastically.
But knowing click-through rates for a page as a whole is a very dense metric.
It shows end behavior, but it doesn’t tell you anything helpful about how each element of the page contributes to the final click-through metric.
That means you’re getting a very limited picture of your customer’s actual experience on your blog.
So when it comes to getting valuable data about your click-throughs, you have to start with an understanding that links and CTAs contribute to the overall customer experience.
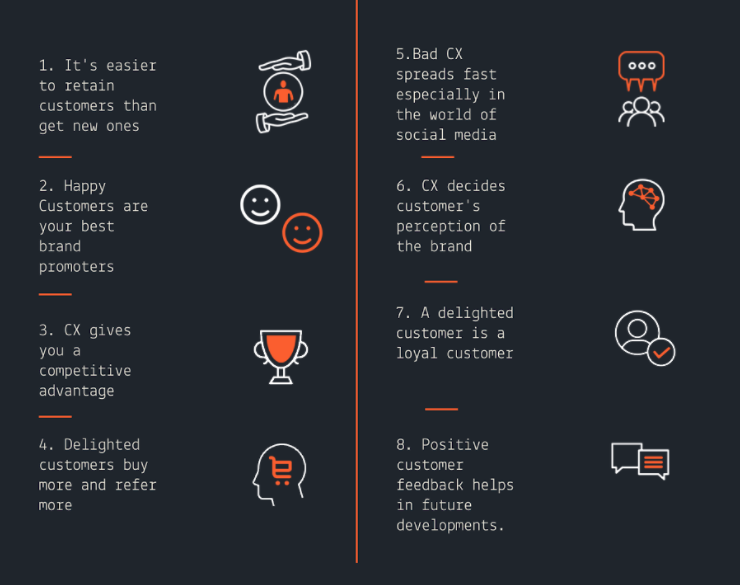
Customer experience focuses on how users interact with your website.
If they have a good experience, they’re more likely to turn into happy customers.
Happy customers are easier to retain, promote your brand more, and ultimately buy more from your business.
But if you don’t know which elements of your content are contributing or detracting from your customer experience, you’ll never be able to create the kind of blog posts that truly bring conversions.
And content is a vital part of every phase of proving ROI when it comes to customer experience:
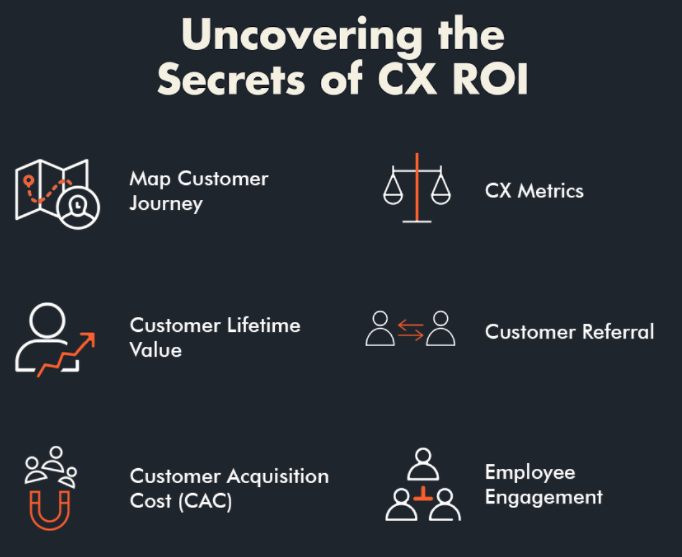
So individual links and CTAs on your blog post are a matter of your customer’s lifetime value.
And knowing the rate at which each individual element of a blog post is clicked can help in a variety of cases.
For one, it will directly benefit your CTAs and links that are goal-oriented.
If you have a CTA for a product or service in a blog post that isn’t getting clicks, it may be because your visitors are getting distracted by other links or elements on the page.
Not knowing what’s actually getting clicked will leave you in the dark though.
And if your brand relies on affiliate links to help share content and increase your brands reach, then not knowing how many clicks you get will make it impossible to divvy up revenue appropriately.
So there are layers to individual link and CTA tracking that are certainly worth your time, attention, and investment.
Your goal is to find a way to track these clicks and actions on your blog posts so that your content, links, and CTAs all work together to help elevate your sales.
And that means starting with copy that converts.
Then, you need to start building an understanding of which actions drive your marketing efforts.
This will help you track ROI and improve in the future.
But as with everything else in business, budget, time, and your own expertise play a role.
It can be daunting to know where to start.
But thankfully, there’s a one-stop-shop answer on where to start, and I want to share it with you in this post.
The answer you’re looking for is to find a solid reporting system that will let you track and attribute clicks appropriately.
Finding a reporting system
When it comes to finding a reporting system that will allow you to track individual link and CTA clicks, you’re really looking at two options:
- An overlay report system
- A direct link-tracking system
Overlay report systems are typically more robust, collect deeper analytics, and provide you with more actionable data based on overall user behavior.
A link-tracking system will be more lightweight but will still able to give you useful insight on your link and CTA clicks.
I want to show you a couple of options for both of these systems.
Whichever one you pick, you can start using it to collect insightful data and optimize your customer experience on your blog.
First up is a very robust overlay system that can start providing value immediately.
Option #1: Crazy Egg
Crazy Egg is a premium service that allows business owners to create helpful overlay reports on their website.
These overlay reports show a variety of helpful data points that allow you to assess quickly where your blog post is getting clicks.
For example, one of the most popular overlay reports they offer is a simple heatmap of user behavior on your site.
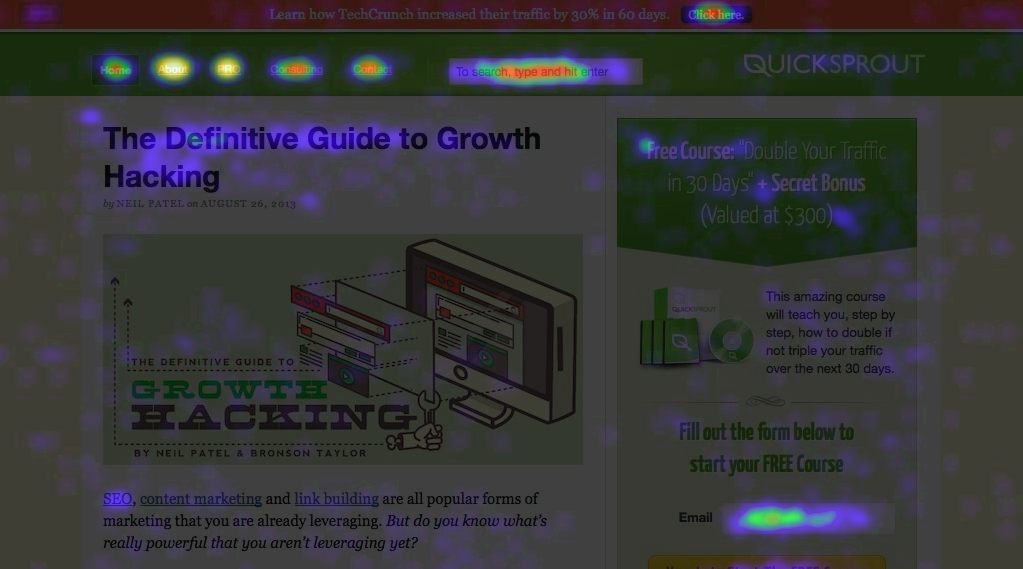
This gives you a visual representation of where users are actually interacting with your blog post.
Every time a user clicks, it creates a spot on your heat map that gives you insight into their intent.
And if that’s not enough information for you, you can also switch over to a confetti overlay to find out where your visitors are coming from.
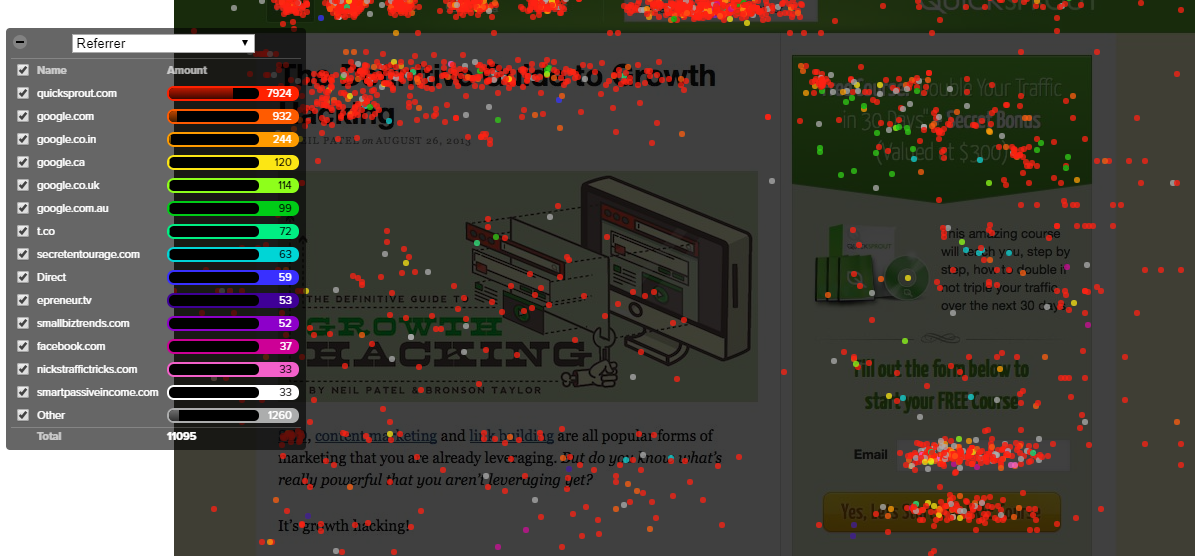
This lets you not only see where users are clicking, but it gives you insight into which geographical location tends to use different elements of your site.
For example, you can break down your users into visitors from the United States versus the United Kingdom.
If they behave differently, you can use this tool to optimize your posts for a wider variety of audiences in the future.
And then if you want to take it even deeper, you can record user sessions on your site to see their scrolling behavior, clicks, and much more.
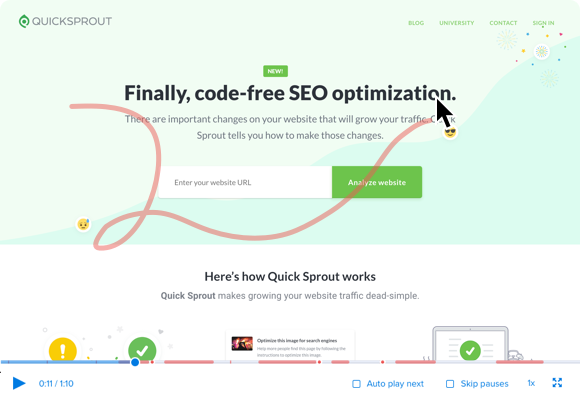
That means you’ll never be in the dark about how people are actually using your site.
You can track clicks and optimize your site from the data you gather.
And if you doubt whether this could work for you, you should know that plenty of brands have used this successfully,
For example, Nurse.com made good use of Crazy Egg’s platform according to one case study they’ve shared.
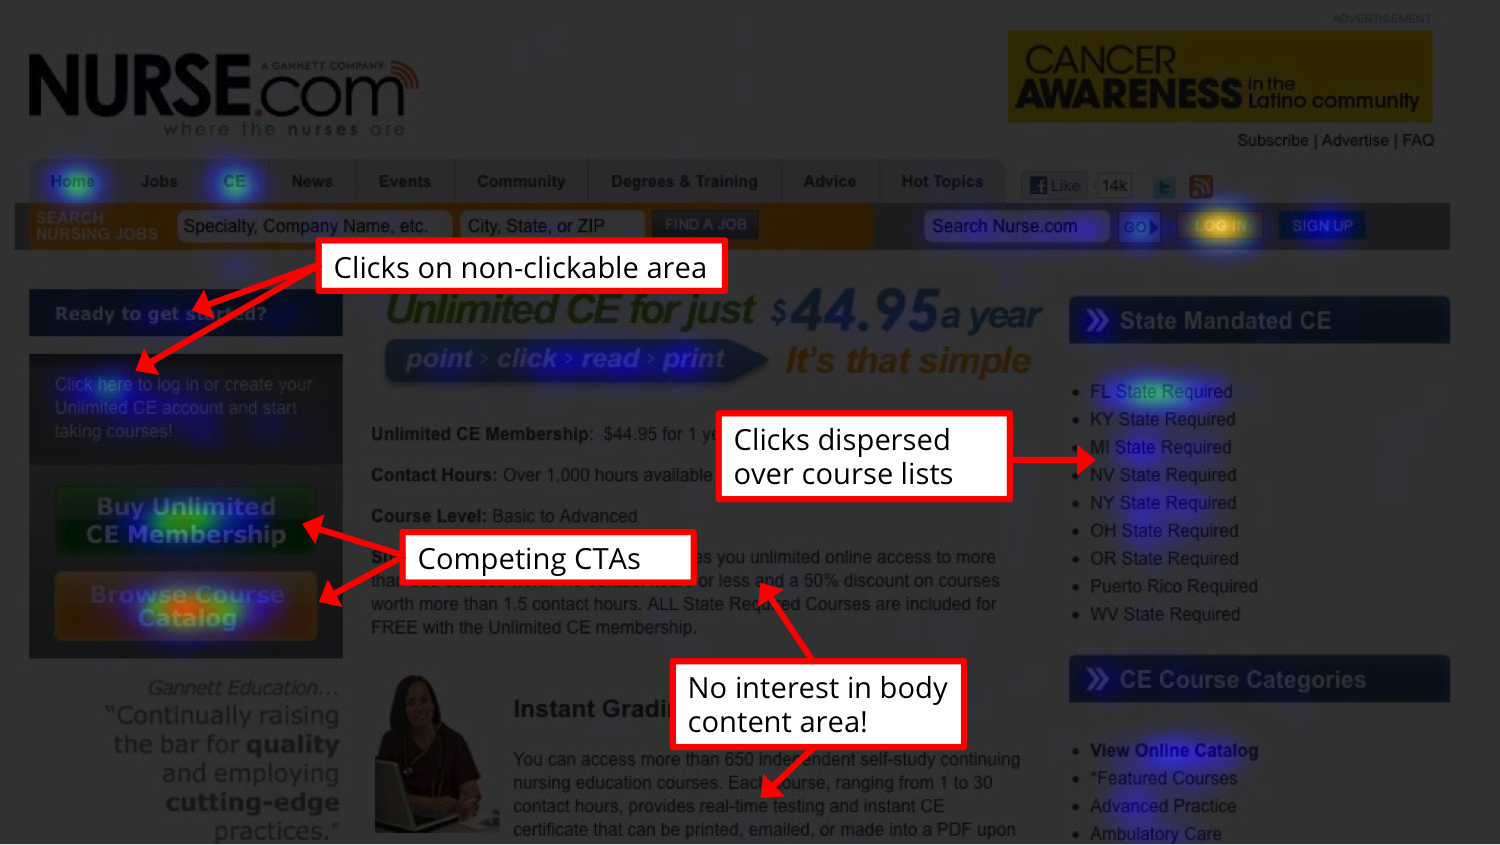
They were able to analyze the elements of their blog posts where users were attempting to click.
In the end, they found some competing CTAs and a non-clickable area that was getting lots of clicks.
More importantly, they discovered that no one was actually going through and clicking on the links in their copy.
Using the data they gathered from Crazy Egg, they revitalized their blog and saw an impressive 15.7% increase in sales.
If they hadn’t taken the time to see where users were actually clicking, they would never have been able to optimize the user experience accurately.
I’ve even used Crazy Egg on my own website with impressive results.

I started by analyzing the different clicks on my site and seeing what people were actually interested in.
Using this data, I was able to revitalize my CTA and strategically place links so that users would be more likely to click on them.

The result is that I saw an almost 24% increase in form submissions when I used this tool on my own website.
So using Crazy Egg as a tool to help you track the clicks on your CTAs and individual links is a great option that will allow you to optimize and grow your blog’s engagement.
It’s not the only overlay tool around, though.
So I want to show you another option that will help you just the same.
Option #2: Visual Website Optimizer
Visual Website Optimizer, or VWO, is another overlay report tool that lets you analyze the individual performance of your links and CTAs visually.
Much like Crazy Egg, VWO allows you to create recordings of individual sessions on your site.
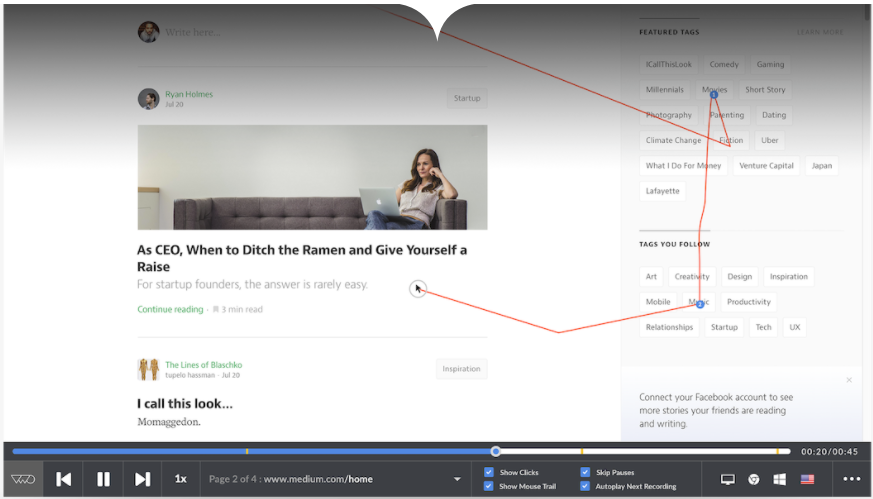
This lets you see exactly where users are scrolling and clicking and even provides a traceable line to show you your user’s progression over time.
This helps you know if your user is really reading your content or just skimming to see what you have to offer.
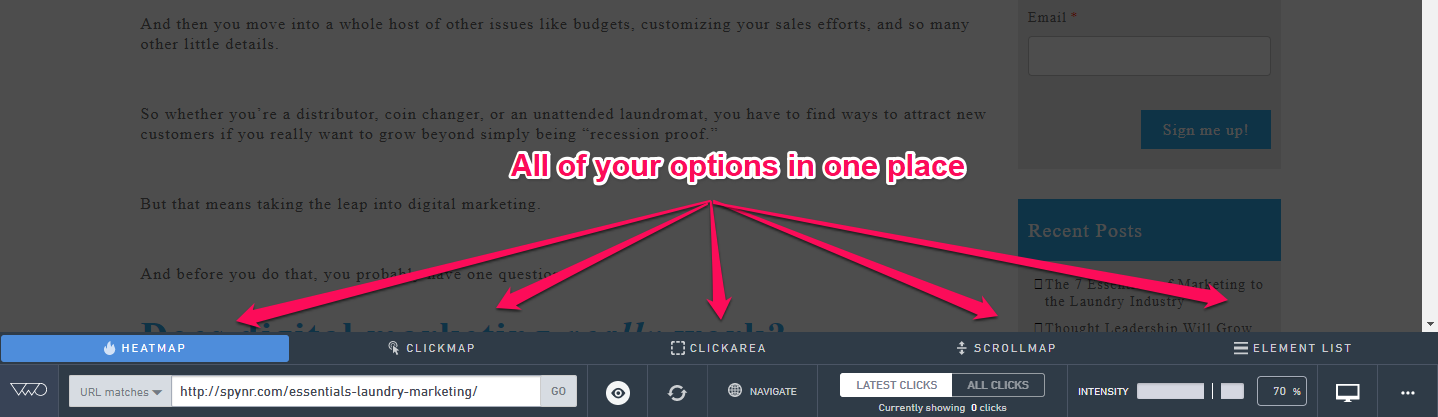
VWO also offers dynamic heatmaps to help you dive further into user behavior and track individual clicks.
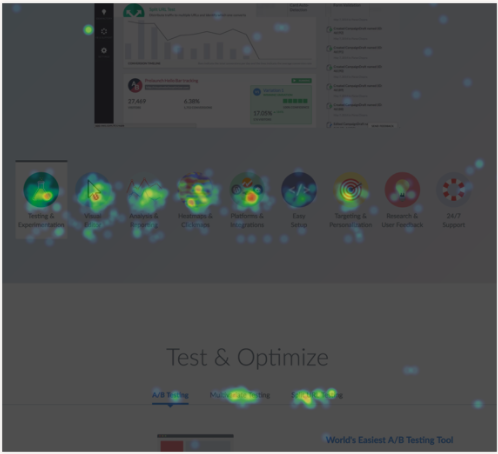
Again, these are very similar in functionality and application to the heatmaps used by Crazy Egg.
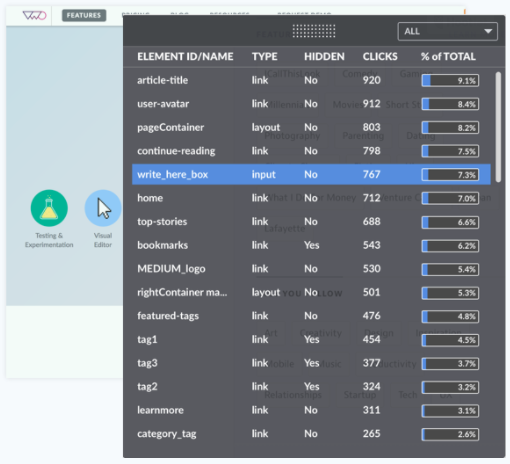
But in addition to the insightful heat mapping, VWO also tracks and reports on the various clicks your users make on both your links and your page as a whole:
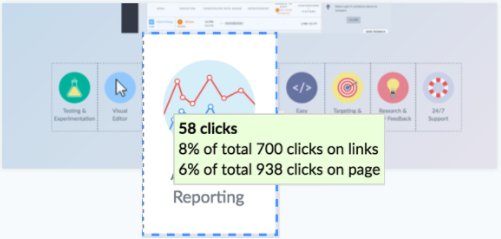
This includes some helpful element list breakdowns that show which parts of your blog post are getting what percentage of the clicks:
So all things considered, there’s a lot going on with VWO that you can track, analyze, and optimize for.
By utilizing the tools it has to offer, you can quickly and effectively discover any pain points in your blog content that are pushing users away.
And since VWO offers a free month to let you try out the platform, you can start using it without a commitment to see if it works for you.
Once you’ve set up an account, simply input a blog post’s URL and start using their system to see what it has to offer.
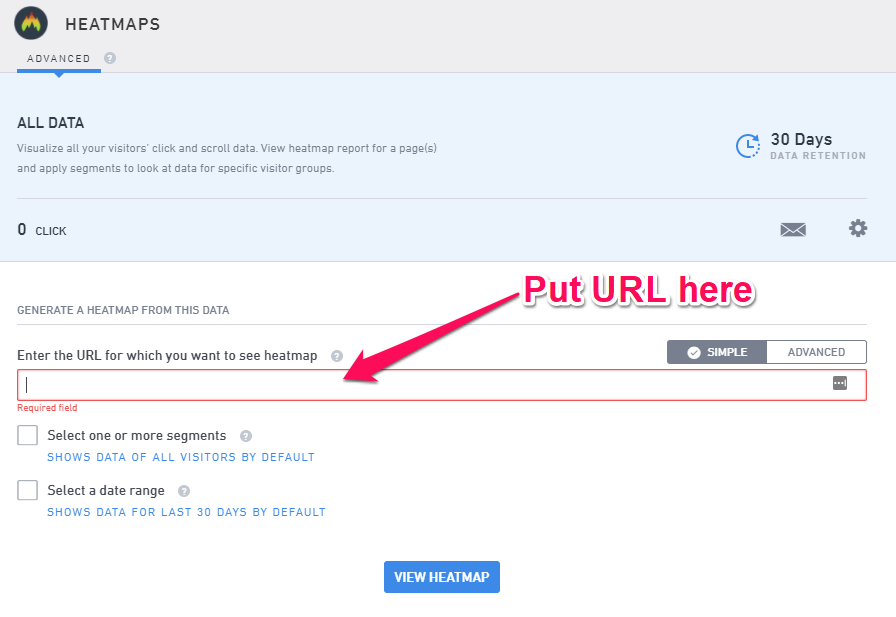
You’ll find that the process is fairly intuitive, and you won’t have to look far to find the different heatmaps and settings that VWO uses.
But again, don’t just take my word when it comes to these overlay systems.
There are plenty of examples of brands using a platform like VWO to help track link clicks and grow their content in the long run.
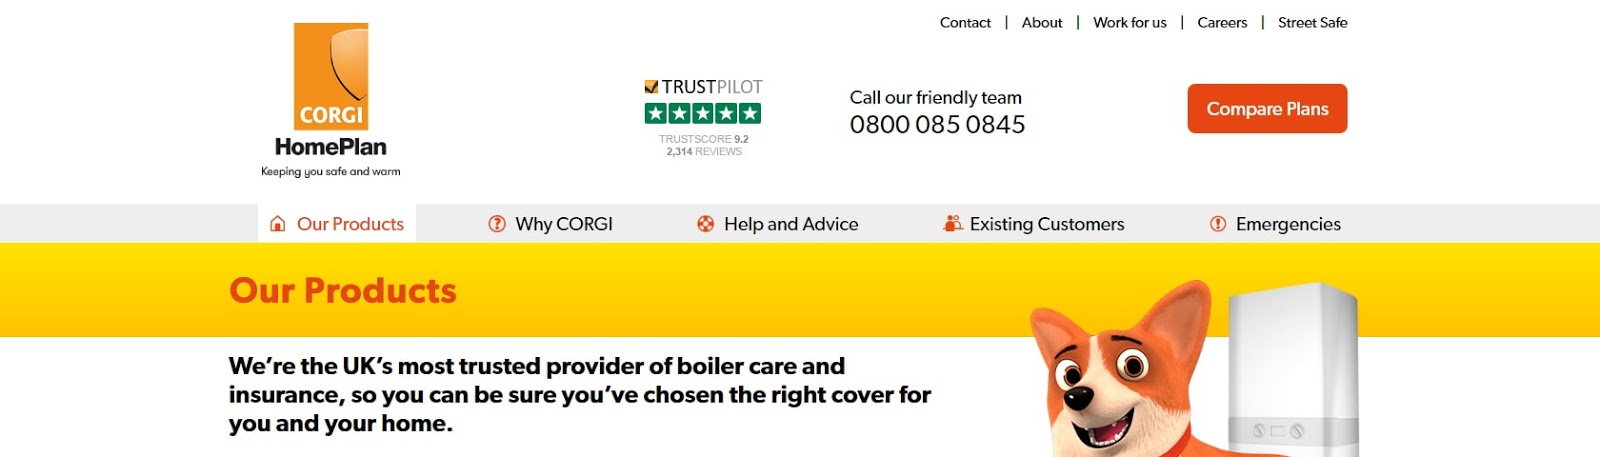
Take CORGI Homeplan, for example.
The UK-based insurance company felt their site wasn’t performing as it should.
They used the scroll maps, recordings, and heatmaps VWO offers to create experiments on their site that drastically changed the look and feel of it.
Here’s the original site:
And, after much testing, here’s the site design that they ended up settling on:
On the surface, these look like minor changes.
They swapped out a few colors and changed their header a bit but otherwise left most elements unchanged.
But these changes saw a 30.9% increase in conversions.
And all of them were based on changes that VWO gave the insight for.
Without a doubt, overlay reports can be valuable to a brand that wants to shake up their content and track which links and CTAs are actually performing.
But as previously mentioned, overlay reports aren’t the only option.
So next, let’s look at a couple of link tracking options that are much more lightweight but still practical.
Option #3: Google Analytics
It may surprise you to learn that Google Analytics actually allows you to track link clicks on your site in a way that lets you fine-tune your copy and increase your overall click-through rates.
You can find file downloads, video engagement, external and internal link clicks, and even email link clicks all under the Behavior tab in your Analytics.
Start by clicking on your Behavior tab, then select the events and overview options.
![]()
Under the Event Category section, you can see how often links are being clicked in relation to other events that you’ve set your Analytics to track.
![]()
And when you look a little further, you’ll find a more detailed breakdown of which links received clicks on your blog post.
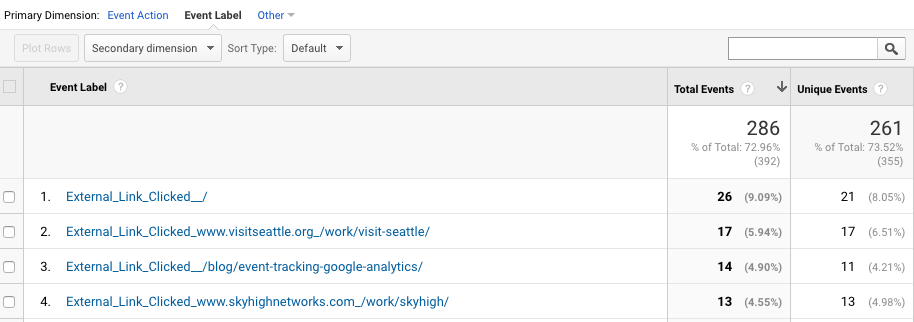
Compared to the overlay reports we’ve been looking at, this information is pretty basic.
You get a breakdown of which links get clicks, but it’s not quite the same level of in-depth user behavior analysis that overlays offer.
But for a marketer on a tighter budget, this information can still be used to your benefit.
When links or CTAs aren’t receiving clicks according to Google, you can still conduct experiments on your site to see if they improve your results.
Even conducting A/B tests over time with this data can yield good results.
Another way you could potentially use Google Analytics to track links and CTA clicks was recently shared by Amanda Gant from Orbit Media.
She tracked a campaign using Google’s URL Builder and saw some pretty impressive results.
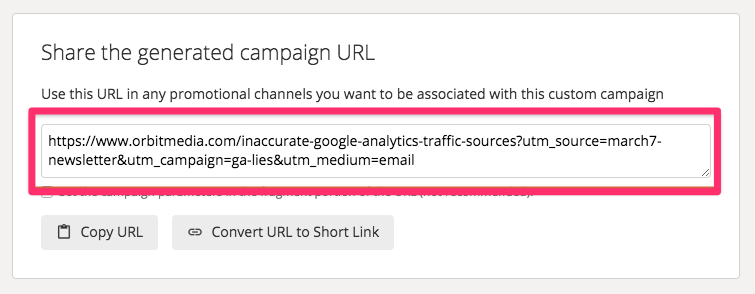
Using these links, she created campaigns around her content that Google Analytics was able to track.
If she emailed a link in a newsletter, or if a visitor to her site clicked on a link tracked by this campaign, Analytics would be able to give her direct feedback.
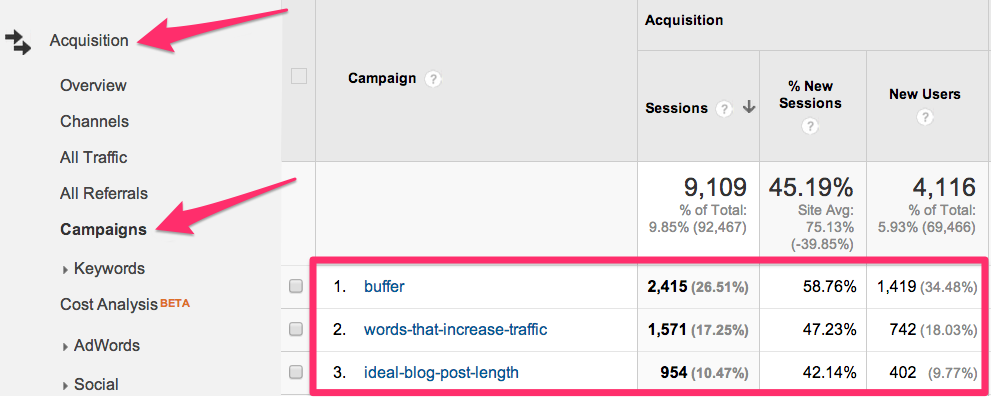
At the end of her campaign, Analytics also broke down the performance of each link:
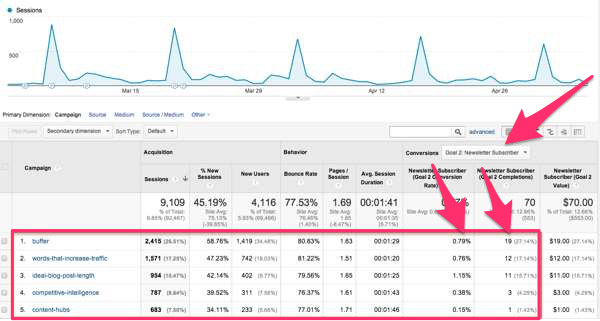
Once again, this is surface-level information about which links are getting clicked, but it’s still helpful.
Analytics allows you to know whether or not your links and CTAs are actually getting clicks, which helps you determine where you need to focus your optimization efforts.
But Google Analytics isn’t the only option available if you just want basic link tracking.
And that brings us to our final link-tracking option.
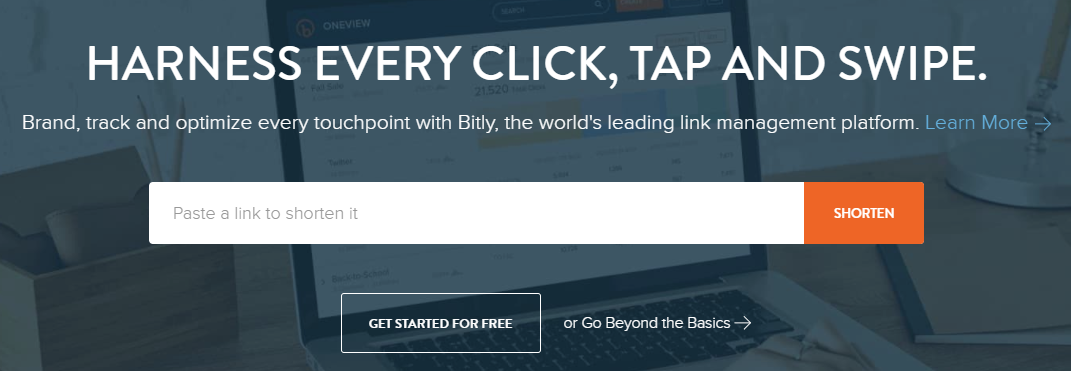
Option #4: Bitly
There’s a good chance that you may have seen Bitly before and it’s just flown under your radar.
But if you’ve ever clicked on a URL through social media that starts with a bit.ly address, you’ve used Bitly before.
Or at least, you’ve experienced a brand that uses them.
Bitly is a URL-shortening service that tends to target social media marketers who want to save character space on their posts.
Before Twitter transitioned over from 140 characters to 280, many brands used Bitly to create shorter links to include in their posts.
All you had to do was input your URL and Bitly would give you a URL that contained fewer characters.
Bitly now offers tracking capabilities so you know how often your links are getting clicked, which makes them much more useful to a general marketing audience.
And since it works well on both browsers and mobile devices, it’s the perfect tool to help you track link and CTA clicks on any page of your website.
Using Bitly is fairly simple.
Start by signing up for a free account.
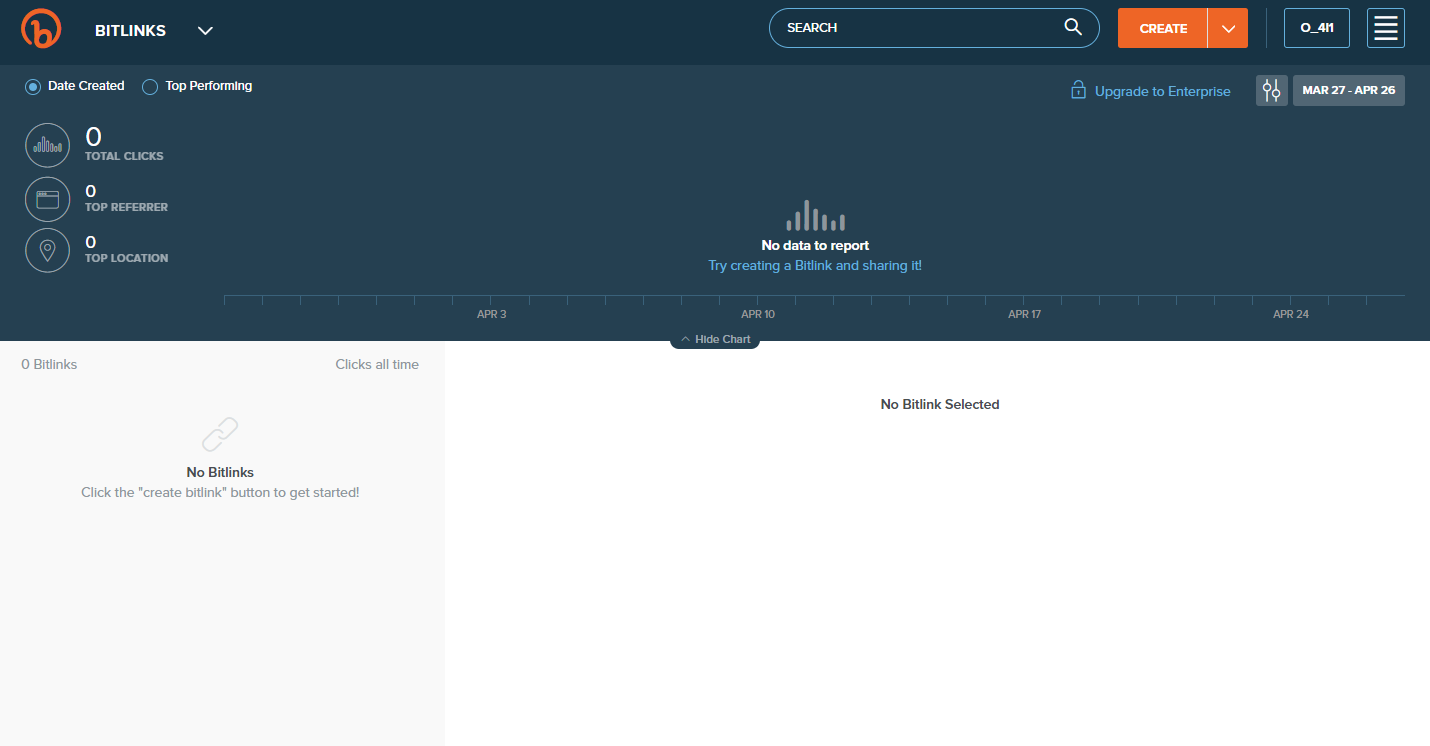
Once you get to your dashboard, you’ll notice in the top-right corner there’s a drop-down menu that says “Create.”
If you’re using the free service, you’ll only be able to select the Create Bitlink option.
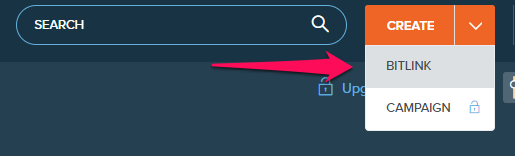
That’s OK because a Bitlink is really all you need to get started tracking your URLs.
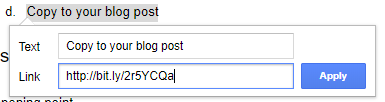
In the menu that appears, input the URL of the link or CTA that you want to track.
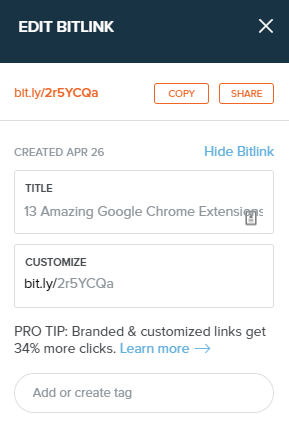
Bitly will give you a customized link using their bit.ly format that you can then copy and paste into your blog post or CTA.
Once you’ve inserted the new URL, Bitly will track the clicks on that individual link for you and provide some basic analytics that let you assess your overall performance.
To show you what that looks like, I went ahead and gave myself a click on my Bitly URL.
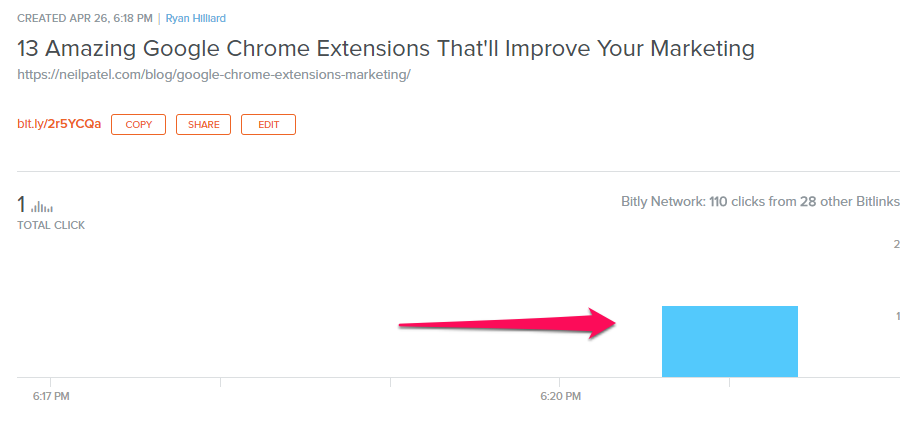
You’ll get a breakdown of the day, time, and number of clicks that your link or CTA is getting without having to wade through any additional data.
So again, while this isn’t as in-depth as an overlay report, you can still use this as a method of checking your individual link and CTA performance on your blog.
And it’s been successfully used by many popular brands, like Beats by Dre.
They started using Bitly to help them share branded shortened URLs and track their link clicks.
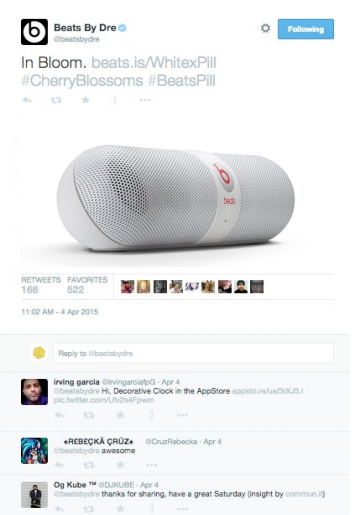
By using these shortened URLs to track performance, they were able to change up their content and achieve a 34% increase in click-through rates on their site.
It may require a bit more manual inputting of these Bitly links, but the results can certainly be worth it if you want to maintain a low budget for your link-tracking efforts.
Conclusion
Clicks matter.
If you can’t correctly determine which links and CTAs are getting clicks in your content, there’s no way to accurately know if your content is doing what it’s supposed to.
And more importantly, there’s no way to actually create insightful experiments that lead to growth.
And with internal links and CTAs contributing to your overall customer experience, this could mean the difference between a successful website and one that simply doesn’t perform.
To help you track links, you can either use an overlay reporting system or a link tracker.
Both have their pros and cons, but will ultimately provide you with actionable information.
Overlay reports from sites like Crazy Egg and Visual Website Optimizer can help you discover and analyze actual user behavior on your site.
Link-tracking systems like Bitly or those native to Google Analytics will give you less specific data, but can still empower you to create experiments that lead to growth.
Whichever option you use, the ability to track links can help your brand grow and your content thrive.
What methods do you use to track clicks on links and CTAs for your site?
Comments (16)