
Visits and page views are nice.
But conversions are all that matter at the end of the day.
The trouble, of course, is that conversion goals don’t come ‘preloaded’ with each new Google Analytics account. And you can’t get access to historical, legacy data, either.
That means when you let days (or weeks) go by without setting up conversion goals properly, you’re going to lose all of that information forever.
Key data points that could have helped you to quickly spot new revenue-boosting opportunities or money-saving costs to cut.
Fortunately, setting up goal tracking only takes a few minutes if you know what you’re doing.
Here’s a complete guide to starting tracking conversions inside Google Analytics.
How Google Analytics conversion tracking works
After logging into your Google Analytics account, look at the bottom of the left-hand sidebar menu for “Admin.”
Clicking that will bring you to a three-column page where different options are sorted by “Account,” “Property,” and “View.” Look on the far right (under “View”) for the Goals option.
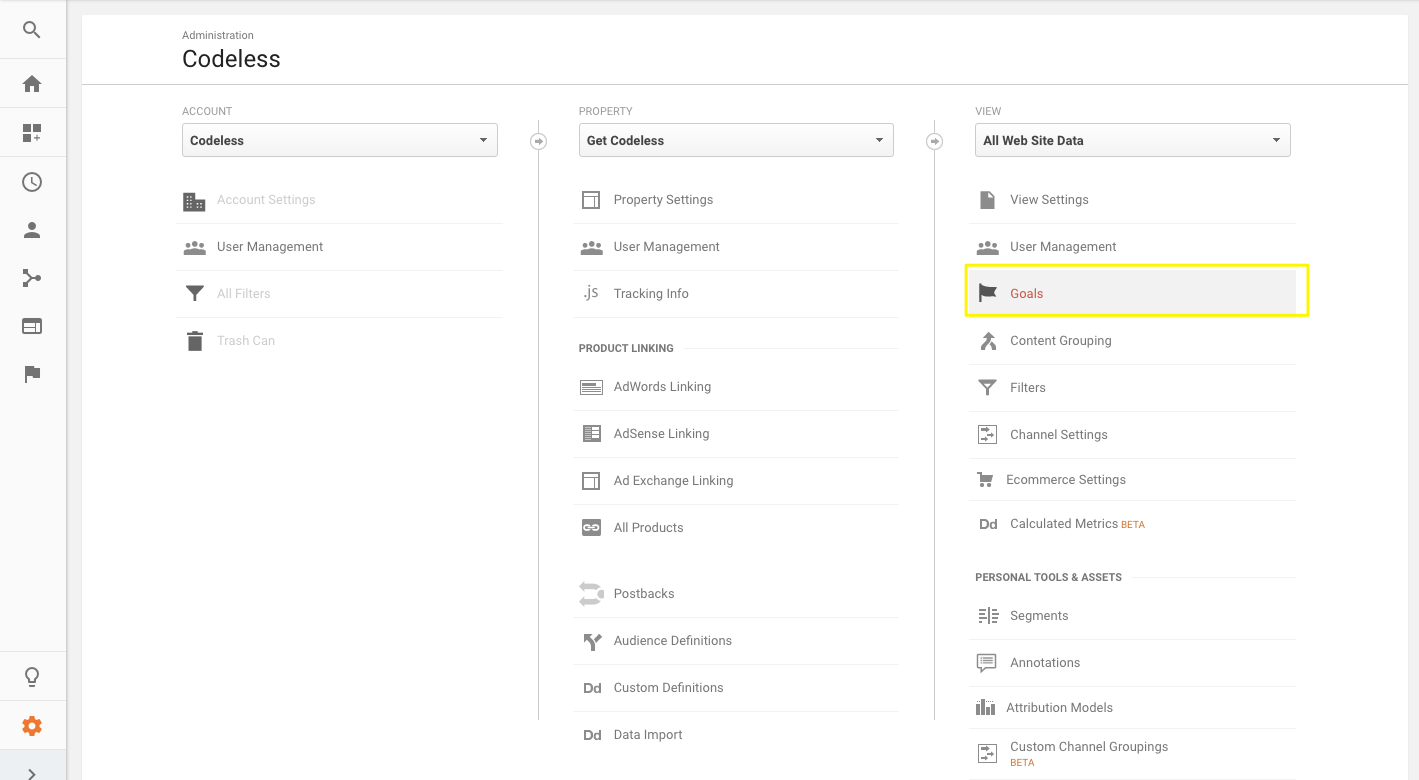
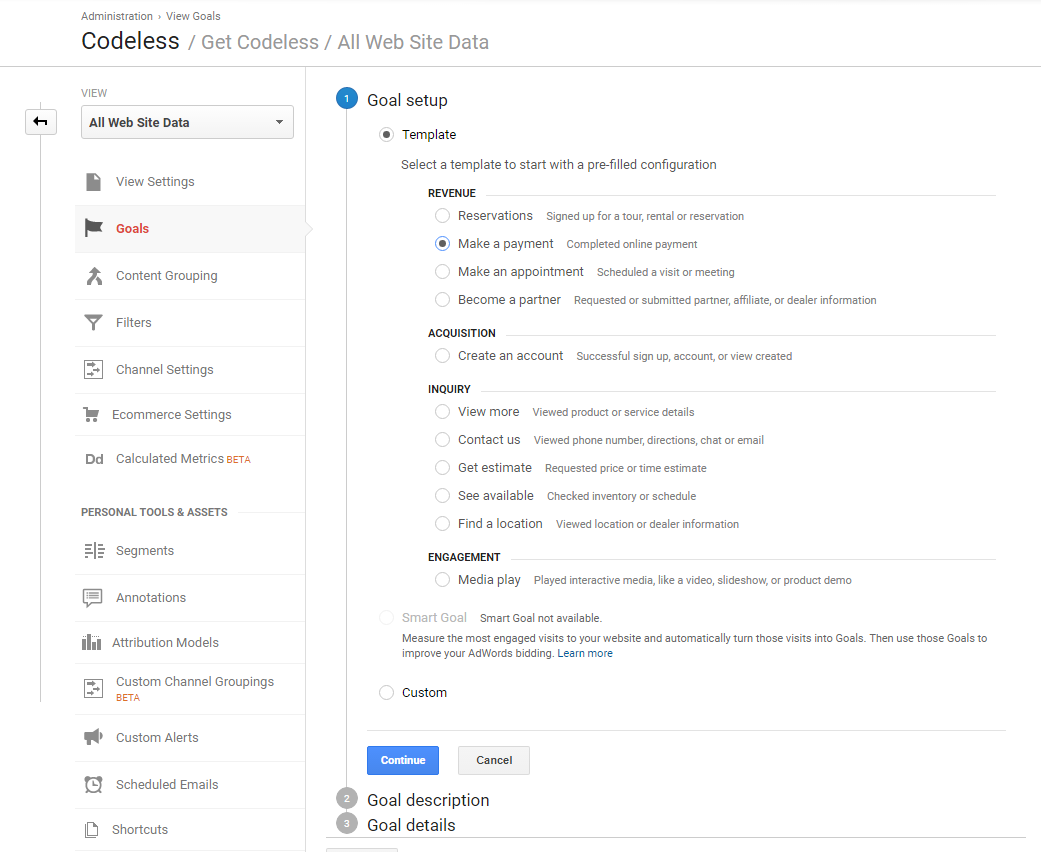
Here’s where you’ll select a new Goal to create.
You can get started with one of their pre-configured ‘templates’ that are split up into four different categories: Three ‘hard’ ones (Revenue, Acquisition, Inquiry) and a single ‘soft’ one (Engagement).
Let’s say you run an e-commerce site that sells meal delivery services. Amanda visits your website, watches a video, and then signs up for a free trial. In that order.
We tend to fixate on ‘macro’, hard conversions like that new free trial goal completion. However, in this scenario, an assist should go on the scoreboard for that ‘micro’ conversion, or soft video view, too.
So let’s create different goals for each.
First up, let’s track that video view by selecting the Engagement Goal. Here’s what step two will look like:
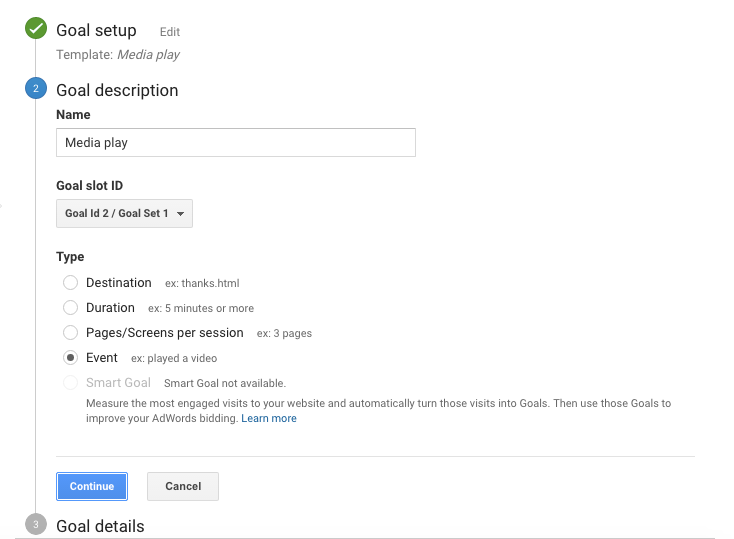
Engagement-based goals like video views will be tracked as a new Event. Click “Continue” and your new Event options will pop up:
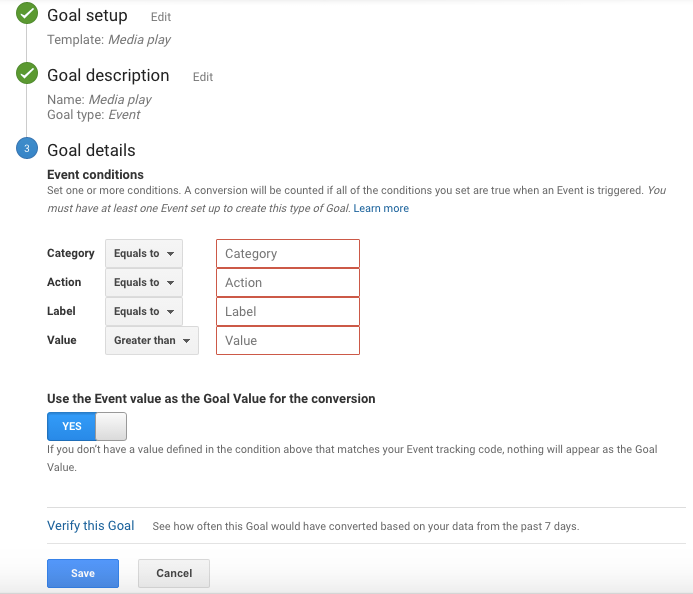
Here, you’ll need to add labels to describe what this Event is tracking. There are three categories that start big and get smaller as you go.
Or, if you’re a grammar nerd, these can be broken down into noun, verb, adjective:
- The category is the most general term for what you’re tracking. The noun: Outbound link. Video. File.
- The action is the verb. What are visitors doing? Download. Click. Submit. Play. Share.
- The label is the adjective — the small details of what you want to capture. Perhaps it’s specific poll answers. Or if it’s video playbacks you’re tracking, this is where you note the video title.
Before finishing, you’ll also typically want to select “Yes” so that Event Values are passed onto Goal values, too.
That way, you can track this information back later to see where these video views originated (i.e. the channel, source/medium, marketing campaign, etc.).
(Note: Keep in mind that adding event tracking will require a new line of code on your site. If you use WordPress, there are a couple plugins that make this really easy. Or you can use Google Tag Manager.)
Now that we’ve got the video view set up, we can move on to creating a Goal for our ‘macro’ conversion. Head back to the beginning and this time, select “Acquisition.”
Your Goal type for this one will be a Destination goal, where you’ll simply drop in the URL for the Thank You or confirmation page someone lands on after submitting their information.
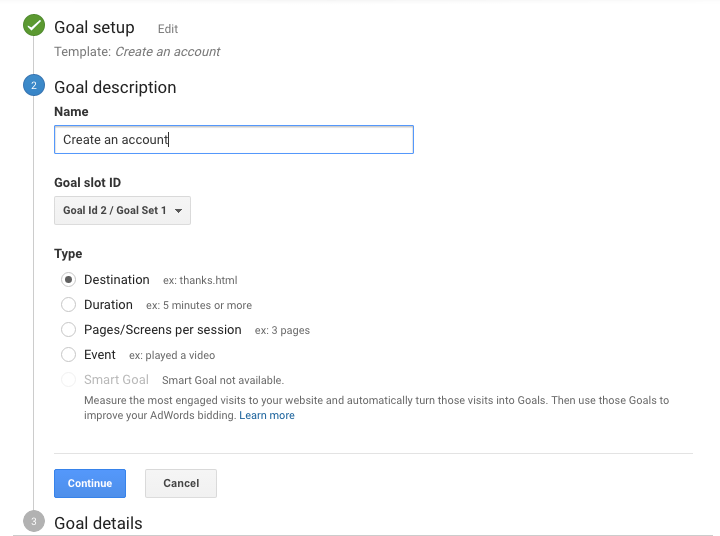
Here’s how to customize that option in the last step.
First, drop in the URL path for the Thank You page (minus your root domain). So: “https://neilpatel.com/thanks” should be simply: “/thanks”:
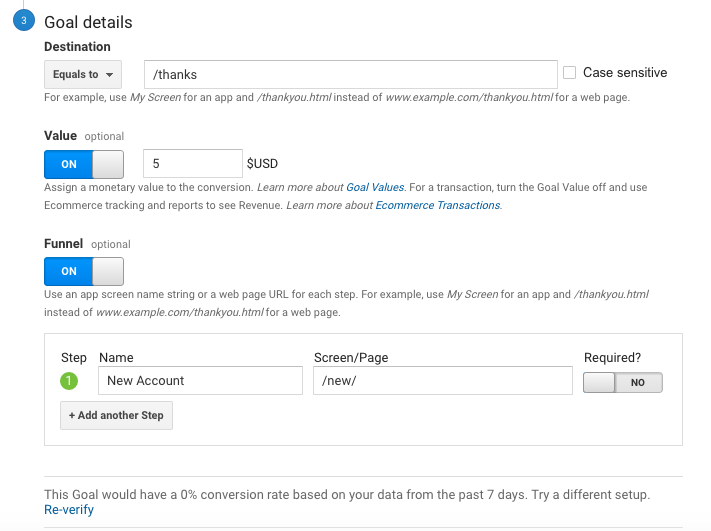
Then you have two optional values underneath:
- Value: A simple dollar amount based on the value of this new signup. If it’s technically free still, you can at also use a placeholder like a dollar per subscriber or cost per lead (if appropriate).
- Funnel: If you want to specify that a conversion goal is only tracked when someone hits every single page, you specify in sequence.
Last but not least, click that little Verify link on the bottom prior to saving in order to test and see if you’ve set up the Goal correctly. (For example, if this conversion has already existed, you should see some kind of percentage conversion rate value.)
Once you’ve got these two different Goal types set up, you can go back to the main reporting area of Google Analytics to view your results.
(Note: Unfortunately, Google Analytics won’t provide you with historical data that may have already happened in the past. You’ll only be able to view these new conversions going forward.)
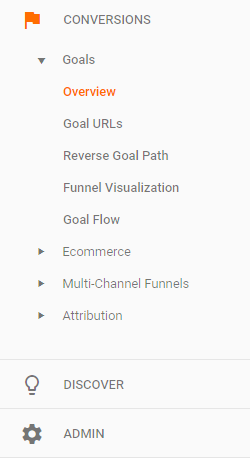
In the left-hand sidebar menu, click on Conversions > Goals > Overview to start.
BAM! In a few days, you should see a nice little graph that looks something like this:
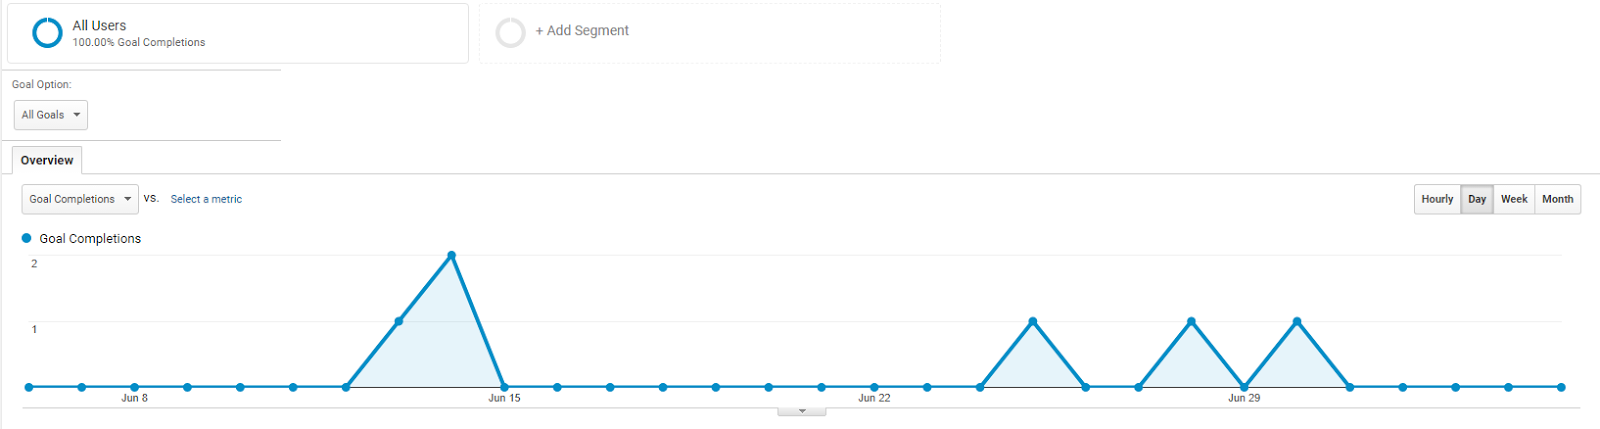
(There are other places in Google Analytics to view goal conversions, but this is the most straightforward.)
And that’s pretty much it! Easy, right?!
Except for one thing:
Your work is just beginning. Because the only reason to track anything in the first place is so that you can do something with the information.
Here are a few examples you can start pulling from now that you have conversion tracking set up.
How to #MakeMarketingGreatAgain with Google Analytics conversion tracking
Looking at total conversions is fine. Tracking those over time is a tiny bit better. The conversion rate itself is somewhat helpful.
But these are all just barely scratching the surface.
✅ Pinpoint ‘Low Hanging Fruit’ Opportunities
The ‘mobile friendly’ moniker is somewhat misleading.
True, you could have a website that’s mobile friendly (technically speaking). It passes the smell test (or at least some online test).
But is it really, truly mobile friendly?
Because jamming an already clunky user experience onto a smaller screen with limited processing power can be a recipe for disaster.
Nowhere is this better illustrated than by comparing your conversion rate across devices. Head on over to “Audience”, then “Mobile”, then “Overview”, and look for a huge drop off like the following:
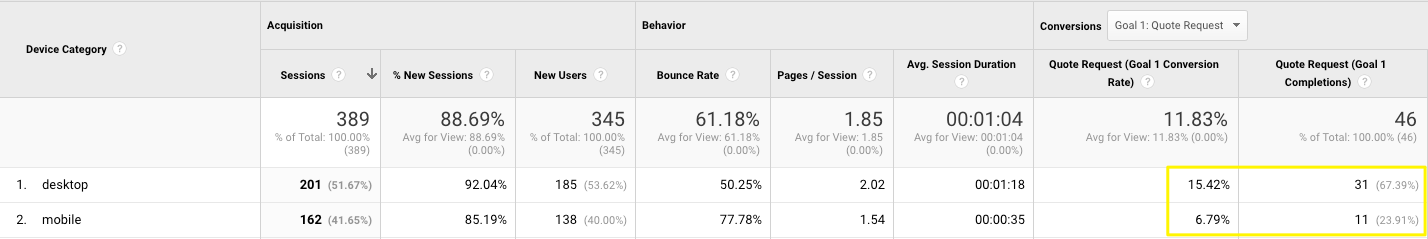
There it is. The smoking gun. The golden, lost opportunity cost staring you in the face.
The good news is that you can at least see it now. And do something about it, like redesign these pages (or experiences) for mobile specifically, and then A/B test the result.
✅ Reverse-Engineer Conversion Paths
Users flow through your site in different patterns.
For example, organic search traffic coming into a blog post will often view other blog posts. While PPC traffic will typically head straight to a landing page.
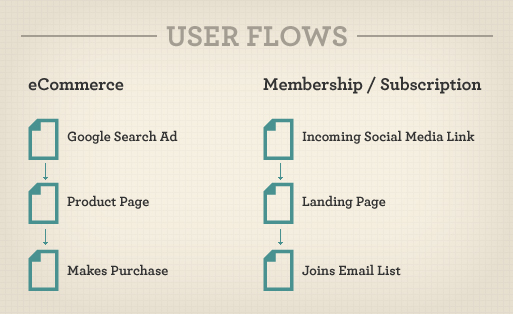
At the end of the day, they all might convert. But the ‘path’ they take will usually follow a few well-worn patterns.
The first step is to simply identify these ‘conversion paths’ taking place on your site. Because then the second step is to optimize them by removing friction along each step, increasing the value proposition on the landing page.
Head over to the Conversions section and look for “Reverse Goal Path.”
The first page on the far left will be your “Completion Location” page (which is typically just the Thank You page for a Destination goal we set up earlier).
The next step to the right is the landing page that these people converted on.
And the one before that (“Step – 2” on the far right) could be the initial entrance page that someone first visited your site (from a paid ad, etc.).
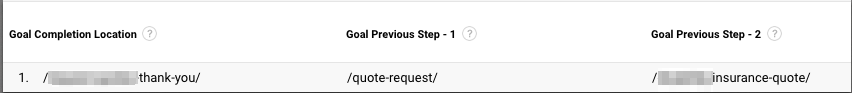
This report will highlight all of these pre-existing patterns. So you can see which ‘paths’ are already the most popular (and, therefore, which ones you should focus on improving first).
✅ Analyze Converters vs. Non-Converters
Unfortunately, the vast majority of website visitors will not convert.
That’s just the cold, hard reality we face.
The other ~97-99% of visitors are just browsing, looking, viewing, learning, and consuming.
But, comparing their actions against those who did convert can be illuminating. For example, it can show you which specific ‘micro’ conversions (remember those?) contribute most to eventually persuading someone to give you a shot.
Let’s return to our original example. Amanda converted for a free trial. Bob did not.
Of course, there could be many, many reasons. But by comparing the differences between converters and non-converters can help us see how Events eventually lead to new conversions.
Simply go to “Segments” in your Audience Overview, select “Converters” and “Non-Converters.”
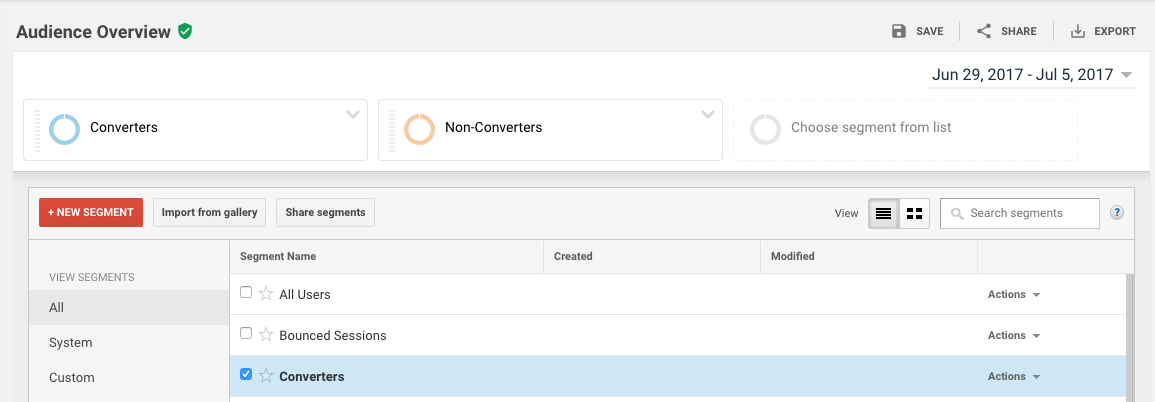
Amanda may have watched a video. She may have downloaded an e-book. Maybe Bob did none of the above, even though they both came from the same source originally (organic search).
Now you can drill down in almost every category to see how the site experience of Converters on your site differs from Non-Converters.
You can hypothesize why those experiences might be different (based on different paths, micro-conversions, etc.). And you can come up with new things to test to improve.
Conclusion
Google Analytics allows you to track conversions based on both ‘hard’ Goals and ‘soft’ engagement conversions.
At the end of the day, you need both. One eventually leads to the other.
The trouble is that you have no idea how to improve either one until you start tracking them properly. That means manually going into Google Analytics to set up Destination Goals (like a new free trial) and Engagements Events (like video views).
It takes a few extra lines of code. A few minutes worth of work.
But the insights you’re able to glean after analyzing the data can help you transform a failing campaign into a successful one. And a loss into a profit on your P&L.
Do you track goals and events for your site?
Comments (24)