Instagram is known mostly for engagement.
Simply put: People love interacting with brands and other individuals. Without engagement, social media doesn’t exist, and engagement matters more on Instagram than most other platforms.
In fact, Instagram’s engagement has been measured at anywhere from four to twelve times that of other social channels.
So while you can sell on Instagram, this channel is better known for its benefits at the top of your sales funnel.
The problem with that is your marketing efforts don’t always link back to sales.
That means you’ll have to come up with other metrics and ways to measure performance to justify all of the time and money spent on Instagram.
I’m going to show you some of the best metrics to watch for in this post.
But you’re going to need to bring in at least one or two of the tools below to gain access to everything.
Here are nine of my favorite to try out.
1. Owlmetrics
Owlmetrics is basically a one-stop shop for all things Instagram analytics.
It tracks all of the key data points of your Instagram account, such as follower growth, engagement, hashtag activity, competitor accounts, and click-through rates, while giving you real-time insights in an easy-to-use dashboard.
But that’s not all it can do. It offers a wealth of data beyond Instagram Insights’ underwhelming offerings.
When it comes to tracking engagement, everybody knows that it’s the details that matter. You’ll get insights on things like the most engaging photo and video filters, top tags by interactions, the best time to post, posts that have received the most engagement, sources of the most engagement, and so much more.
Plus, you’ll be able to keep close tabs on your hashtag performance. Hashtag usage is critical to a good Instagram strategy, so you’ll need to keep a close eye on how they’re benefiting (or hurting) your brand.
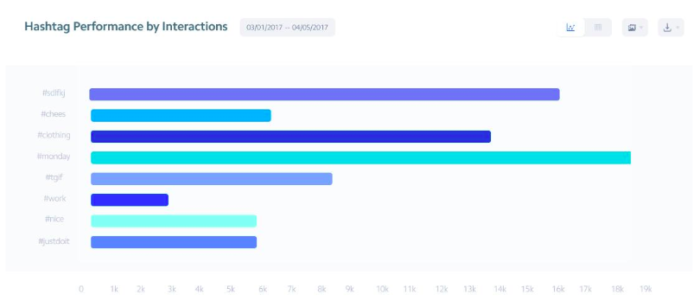
Altogether, their insights generate a goldmine of information for content strategizing. You’ll get daily data regarding your post engagement rates, top posts by engagement rate, and the best-performing types of posts.
With these real-time details at your disposal, you have all the information you need to post dynamite content every single day.
You’ll also know exactly where your followers are spending the most time through click rates. You can find your total clicks, average clicks per post, and your clicks change rate.
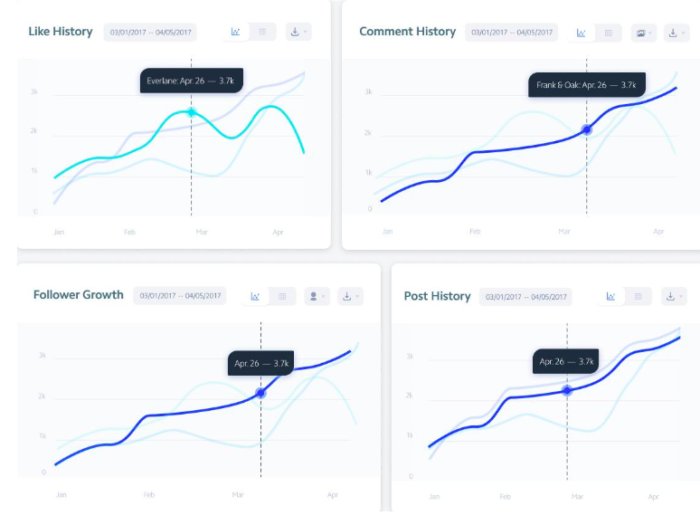
Of course, the tool shows you these ultra-useful numbers in easily readable graphs, so if you’re not a numbers person, you’ll still be able to see areas of change.
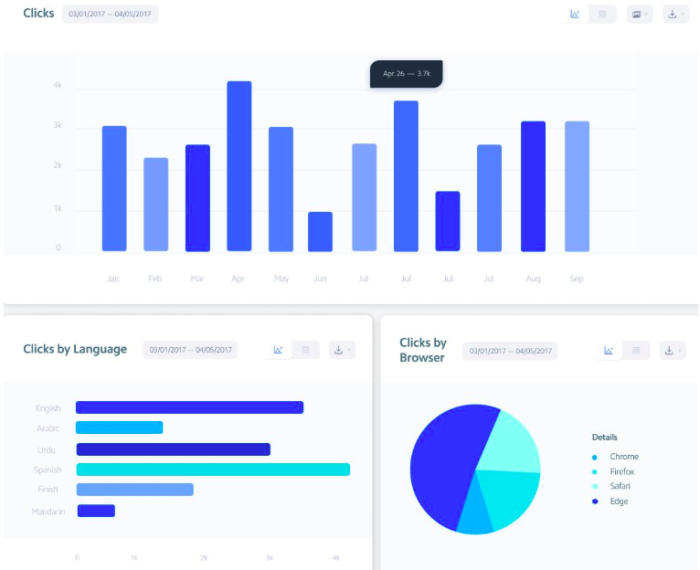
As you can see from these visuals, there’s no shortage of details for your clicks. You’ll see clicks by language, clicks by browser, clicks that are referred from another source, and clicks by location.
All of this contributes to gaining a better, more complete view of your audience.
And since you need an excellent connection with your audience if you want to make it on Instagram, the Owlmetrics audience insights can help you achieve just that.
It gives you all the details when it comes to your followers, including their age, gender, language, city of origin, and other basic demographics that paint a clearer picture of your audience to help you form better posts.
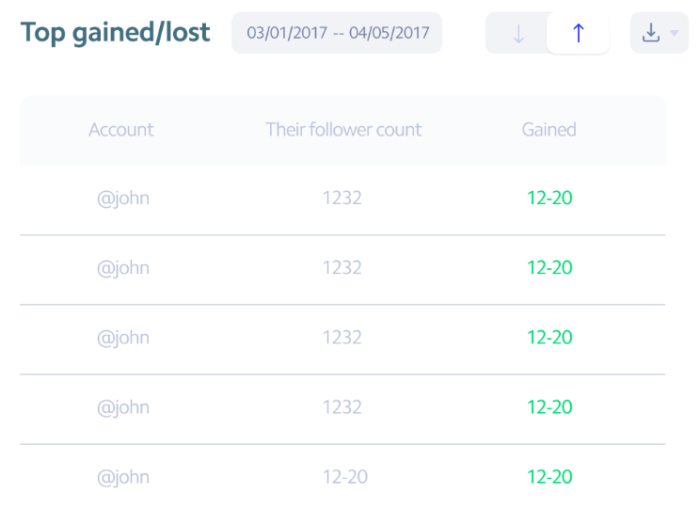
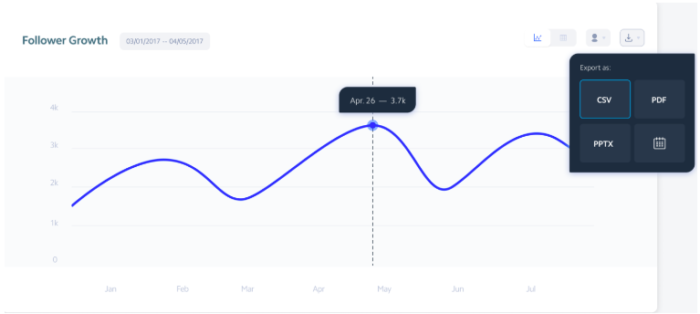
You also get definitive numbers that help you set and track goals for follower growth. You’ll see your total followers and the growth of total followers. There’s also info about the followers you’ve gained and lost, with insights into your top gained followers and top lost followers. This will help you better curate your content to keep your existing followers and attract even more.
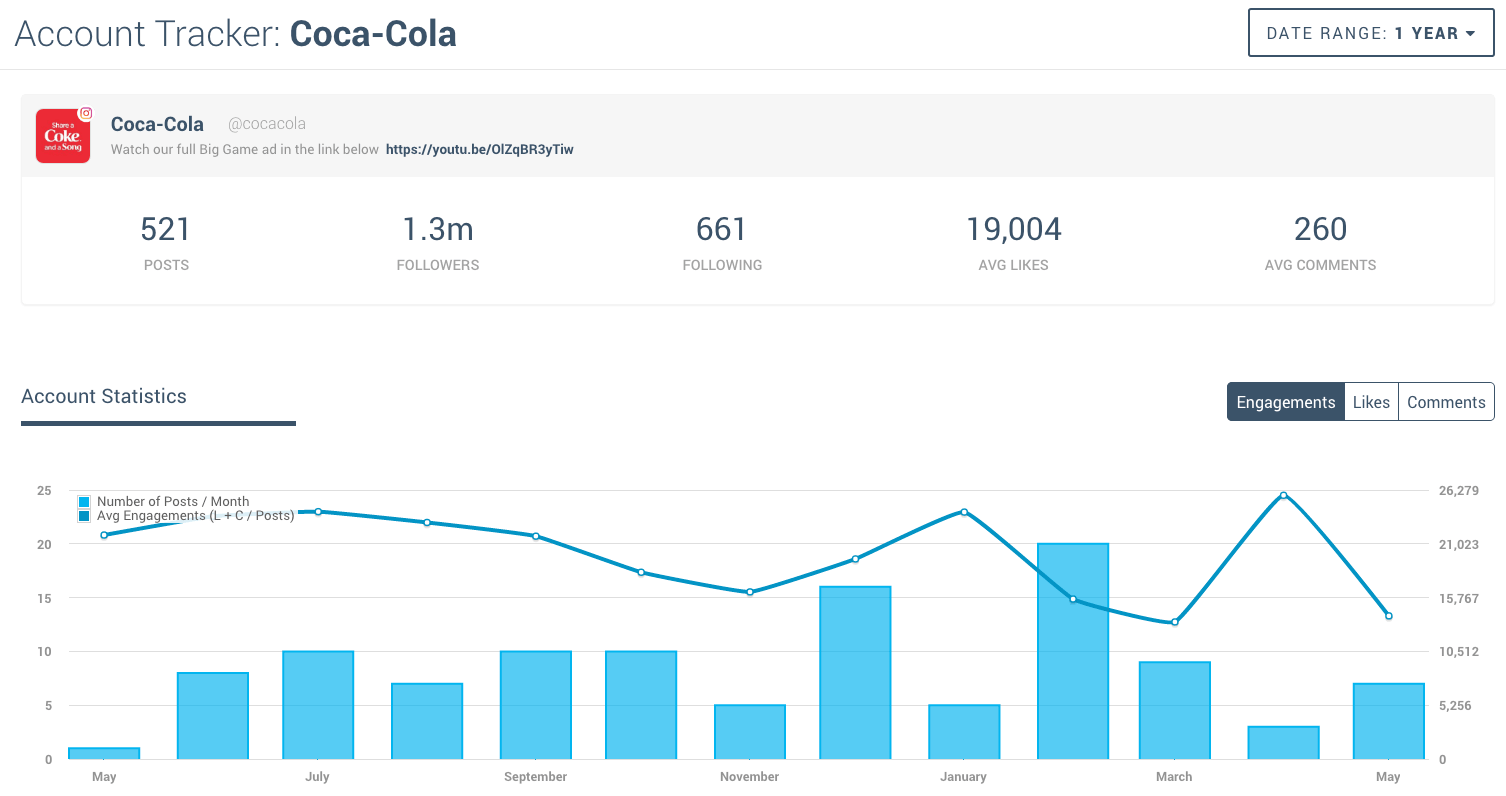
One of the most beloved Owlmetrics’ features is its competitor tracking. You can learn a great deal about executing a quality Instagram marketing strategy by spying on the strengths and weaknesses of multiple competitive Instagram accounts.
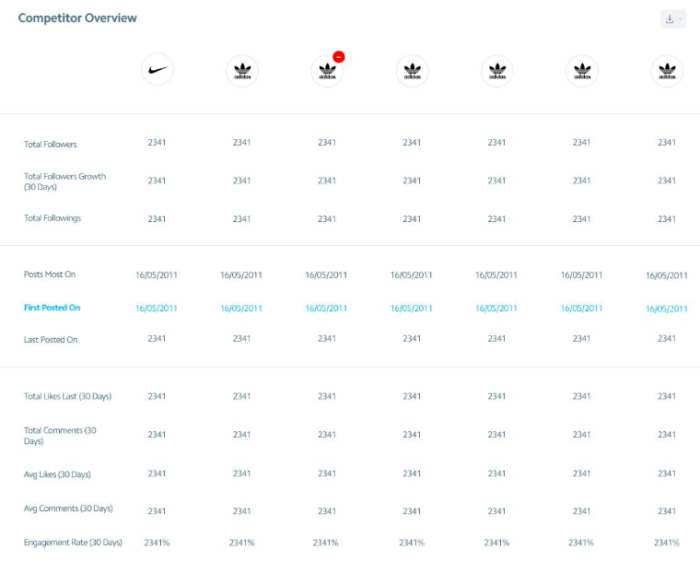
As you can see, it gives you a detailed overview of the Instagram insights for competitors you choose in numbers and graph form. These insights are updated in real-time, so you’re getting the most accurate numbers for high-performing businesses to compare to your own.
To top it all off, you can schedule exports of any data to CSV, PPTX, and PDF for easier reporting, not to mention it integrates seamlessly into Slack so all your team members can be on the same page.
Your Instagram insights are clear, detailed, collaborative, and always in real-time.
2. Simply Measured
As the name suggests, Simply Measured helps you see how far and wide your brand spreads on Instagram.
Monitoring your new and total follower growth is a good start.
However, there are plenty of other ways you should be tracking growth potential over time. One good example includes the hashtags you use and how many people those are potentially reaching.
You should also be able to get a complete snapshot of how your videos are performing, from basic views to retention and even conversions.
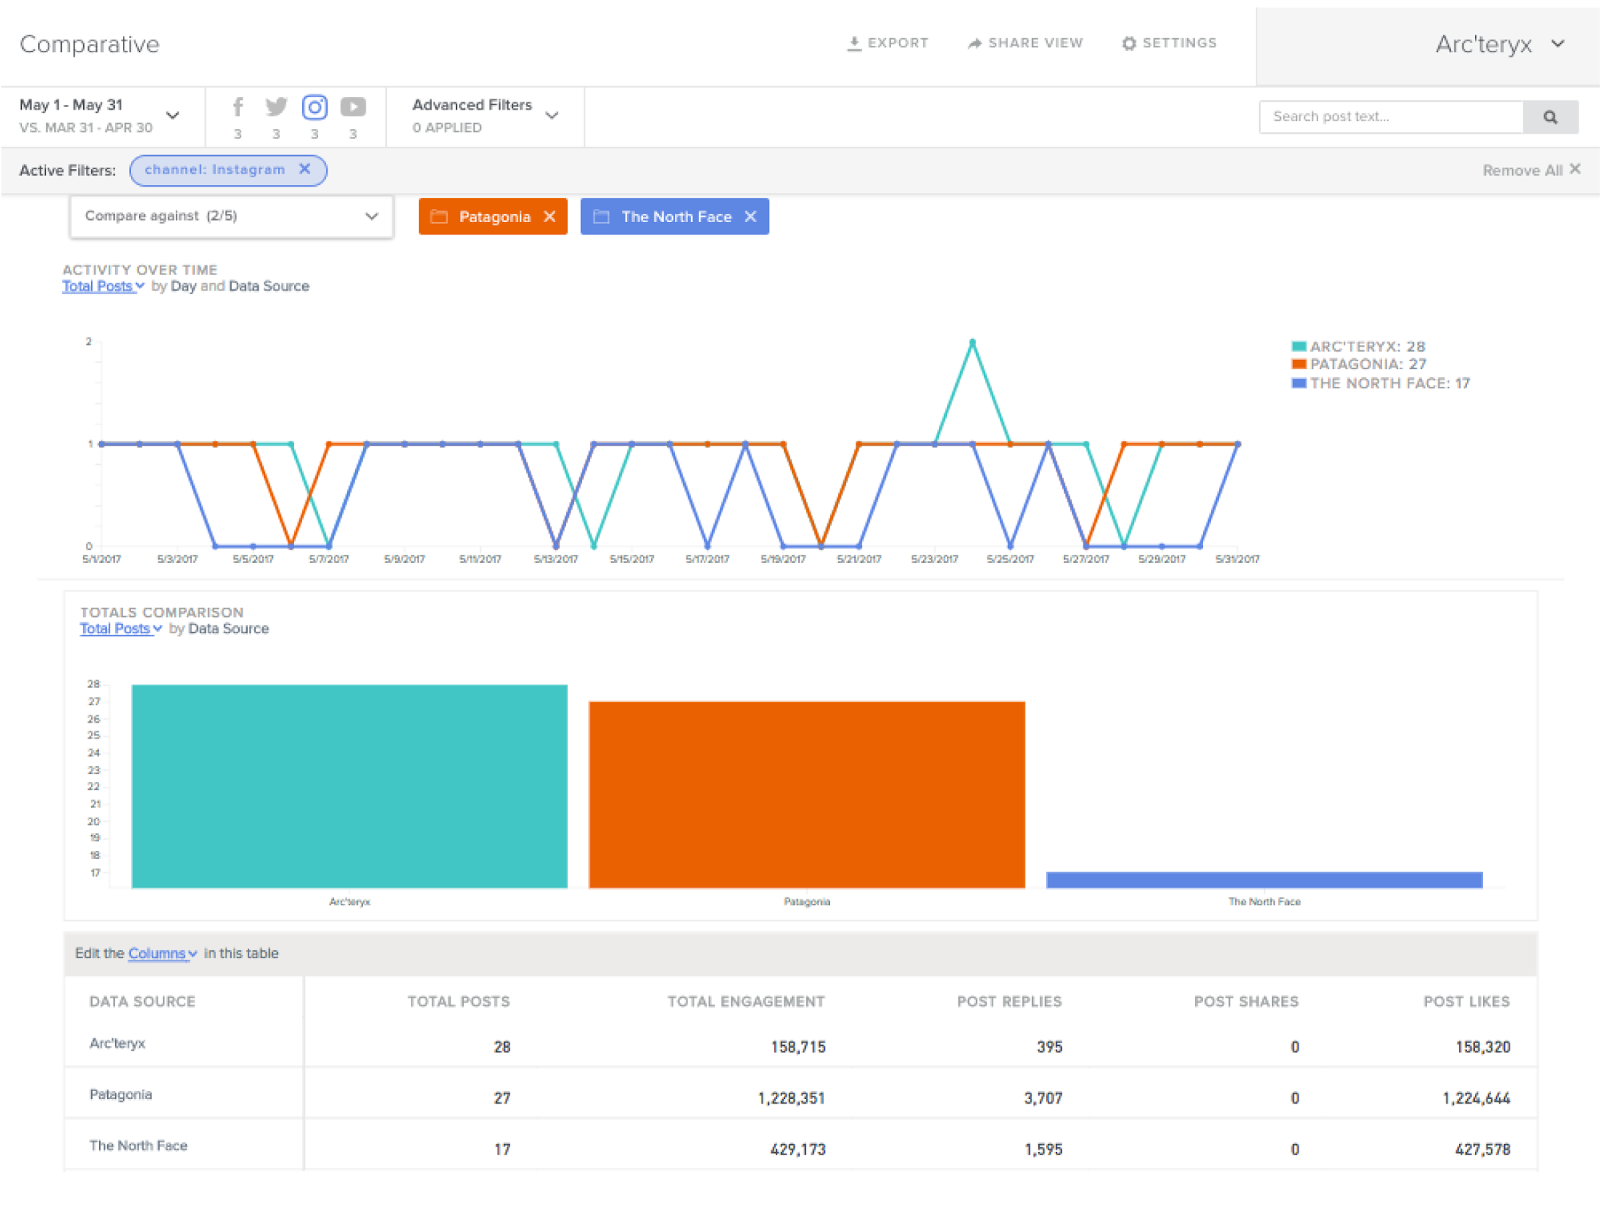
Simply Measured will also help you benchmark performance against competitors.
For example, you can spy on what works best for them before reverse engineering which content or campaigns are bringing in the best results.
Best of all, you can even see which potential influencers already follow you.
That way, instead of spending big bucks on a massive influencer campaign, you might be able to work out some other similar arrangement for a fraction of the cost (by donating products, for example).
All of this is displayed in a simple-to-read visual dashboard to help give you an idea of which posts are providing the best bang for your buck.
It can also point you in the direction of new comments and related community discussions that you might want to participate in.
Simply Measured even features a “Social Conversion Funnel” feature to help you see how all of these engagement-based activities eventually increase your bottom line.
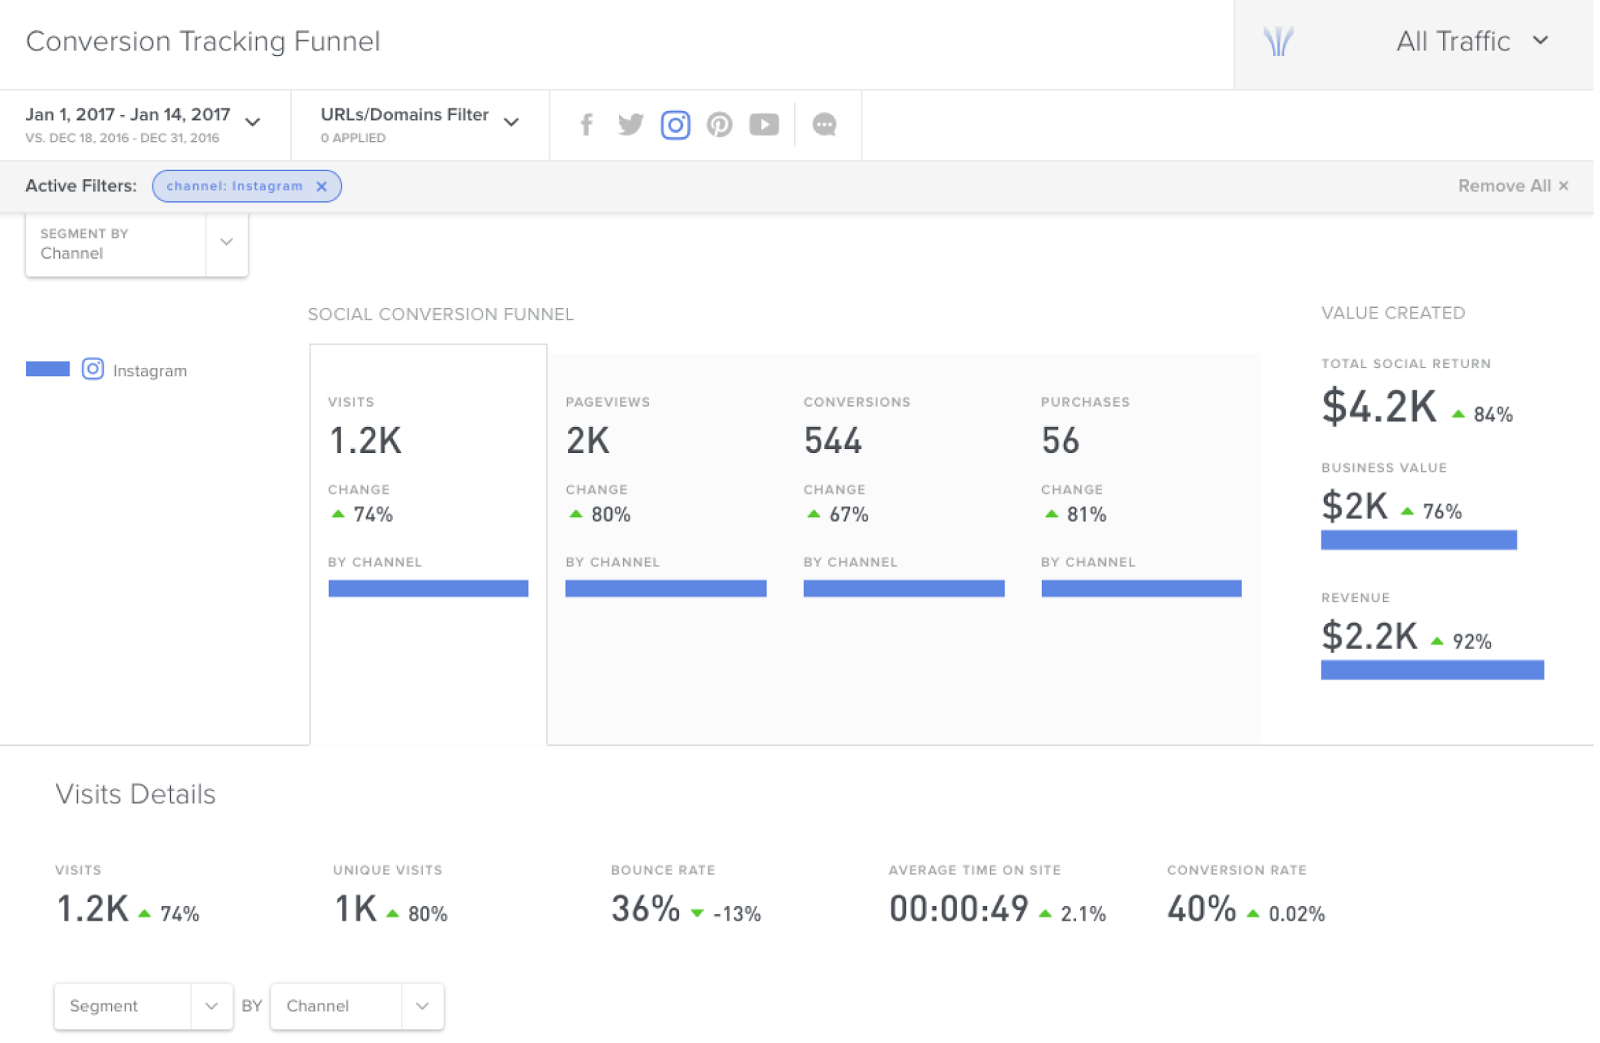
For example, you can narrow down your metrics to a specific channel (like Instagram). You’ll see how Visits (Acquisition) lead to Pageviews (Behavior), and then to Conversions and Purchases.
Each ‘step’ or transition in between will give you a percentage-change calculation so you can see if each one is improving or lagging behind previous results.
Watching these ‘micro conversions’ in between can help you pinpoint exactly where a conversion roadblock might be forcing visitors to ‘drop off’ before ultimately purchasing.
For instance, your problem might not be related to conversions, necessarily, if your rate of Visits to Pageviews has been falling like a rock over the past few weeks.
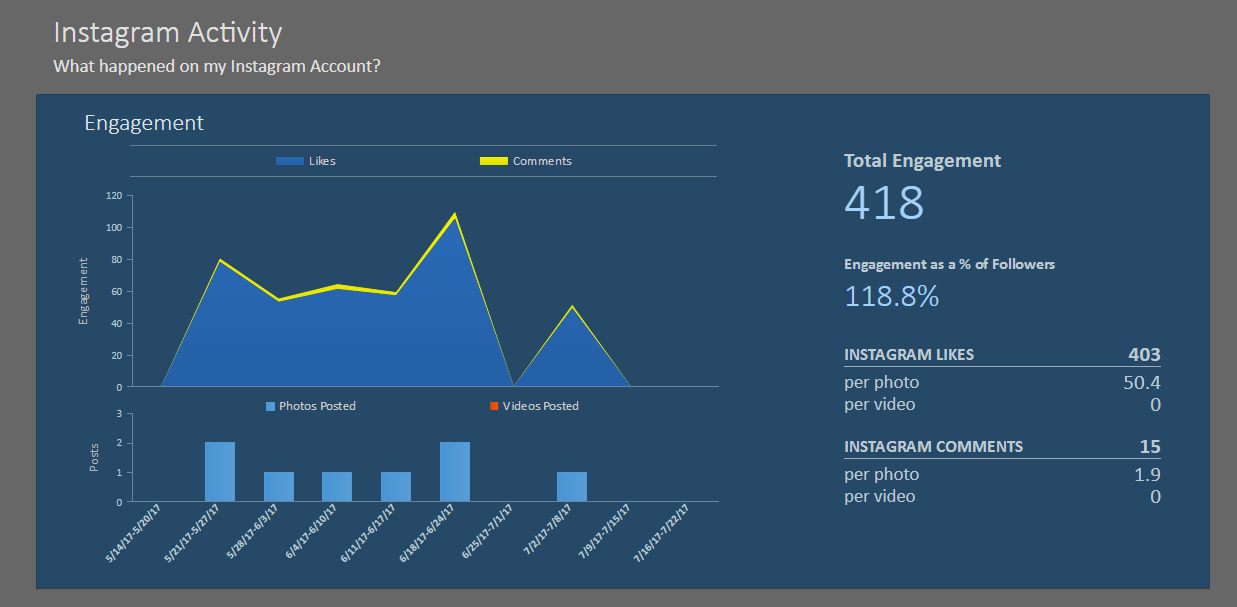
If you’d like to start with a test drive, Simply Measured offers a free scaled report for basic Instagram analytics.
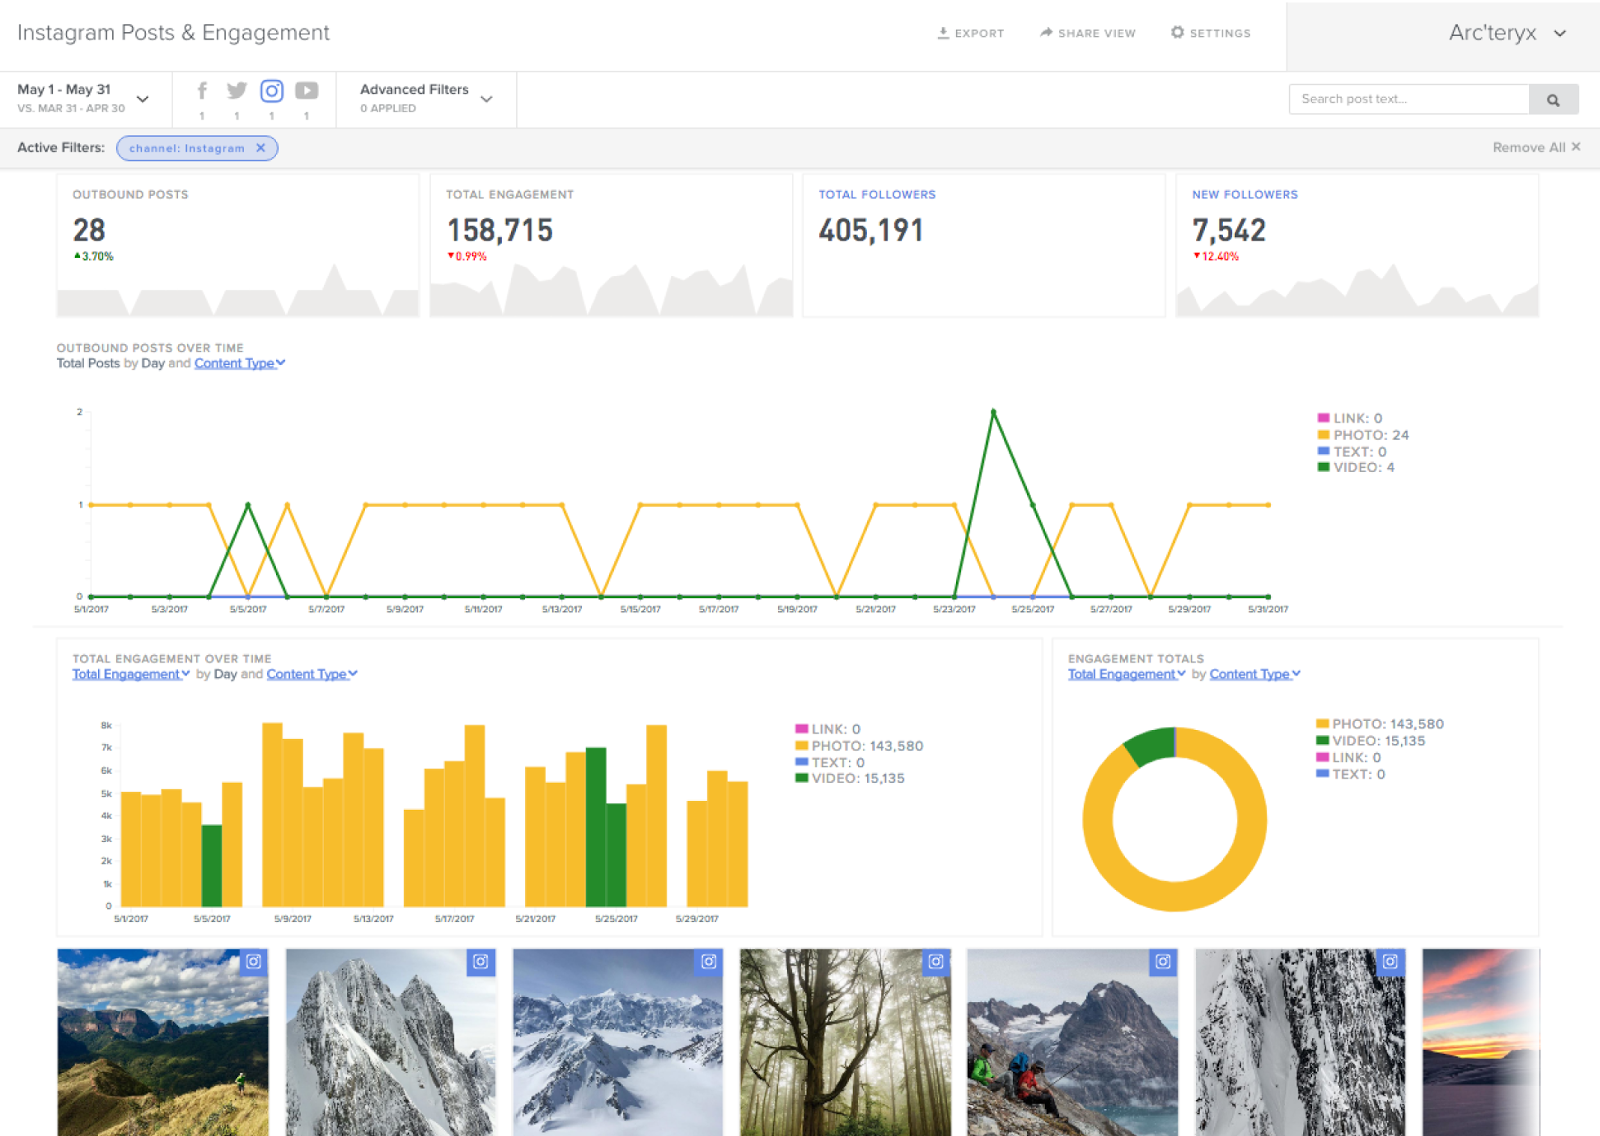
You’ll be able to instantly see how many likes and comments are rolling in on a daily basis (overlaid against your posting schedule so you can correlate results).
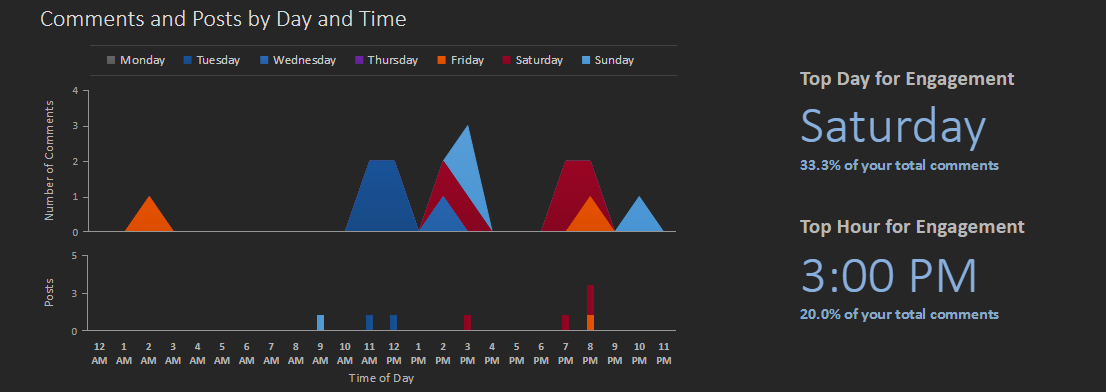
It will even break down these results on a daily basis so that you can identify the best day of the week and time of day you post. These seemingly small changes maximize the amount of interaction each post gets.
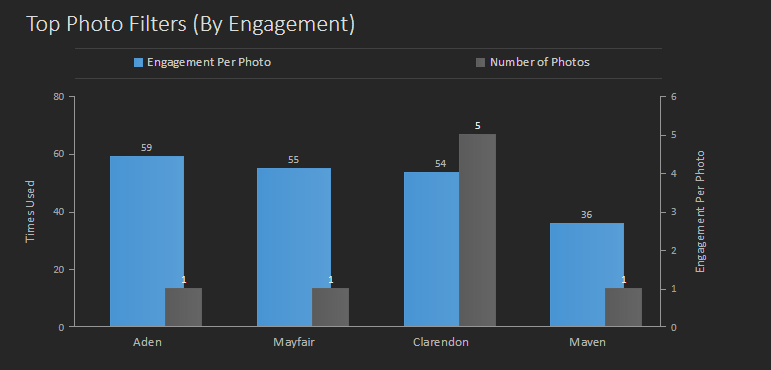
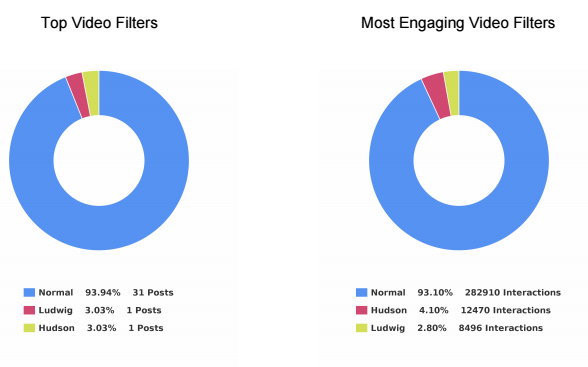
Last but not least, you’ll also be able to get instant feedback on which photo filters drive the most engagement with your own specific audience.
They’ll overlay the number of photos you’re posting with each filter with the engagement per photo. That way, you can tell if an engagement number is legit, or simply just looks good because you’ve only posted one or two photos with it recently.
Pretty nice, right?
But we’re just getting started. Let’s take a look at Iconosquare next to see how it adds content creation and management tools alongside analytics reporting.
2. Iconosquare
There’s going to be some analytics overlap in a few of these tools.
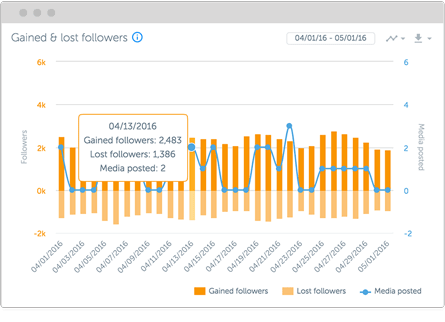
Iconosquare kicks off by helping you understand how your posting frequency relates to or drives either new followers or lost ones on a daily basis.
Iconosquare also gives you a Buffer-like tool to manage how you post across several different accounts at one time.
That makes it a perfect tool for freelancers or agencies that want to save time when managing multiple clients (or even multiple departments within the same company) from the same dashboard.
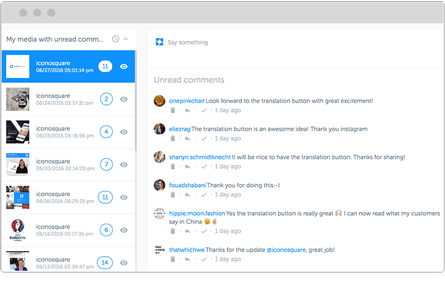
Iconosquare will even show you comments and interactions on each post so you can keep the conversation going without ever leaving.
But that’s not even the best part.
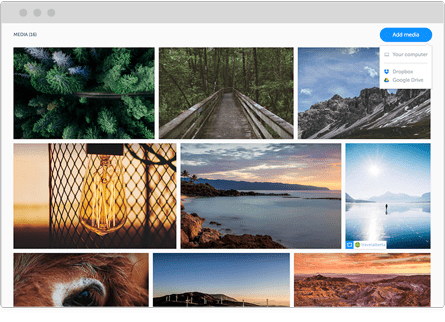
My favorite Iconosquare feature is that they offer a library of awesome content that you can pull from at the ready.
You can quickly search the media library and grab beautiful, high-resolution images to use within seconds.
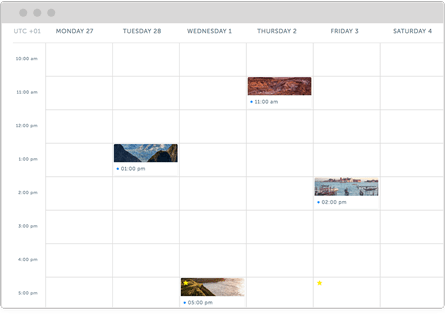
Iconosquare also features an editorial calendar view so that you can schedule posts out ahead of time. It’s easier to manage social media when you plan out content in advance.
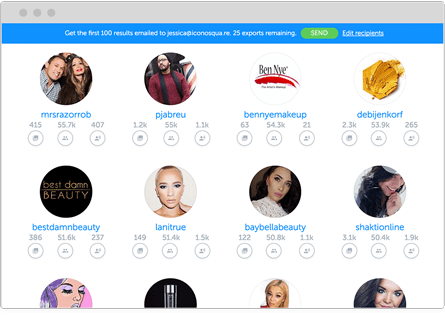
Next, you can use it to search for influencers who might help you get the word out about new campaigns and posts.
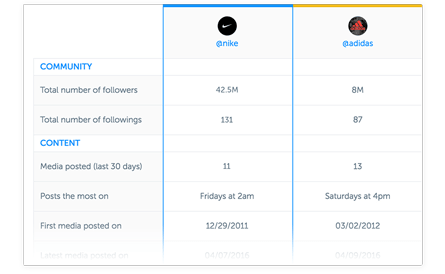
It will even let you compare influencers based on their own follower and engagement metrics, so you know what you’re dealing with before reaching out to them.
All of this sounds great, right?
But we haven’t even touched on their analytics yet.
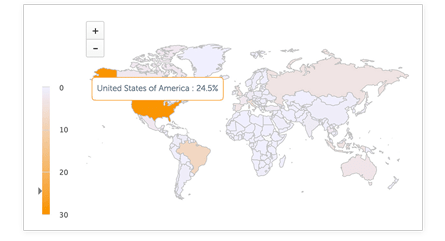
Iconosquare has the basics down, including follower growth over time, gains and losses each day, and even a world view of where followers are located.
In addition, you can see how your individual hashtags are performing, view the best days and times to post, and also benchmark your engagement rates against the competition.
Iconosquare has a 14-day, no credit-card-required free trial. Play around with the analytics before you commit to it with your cash.
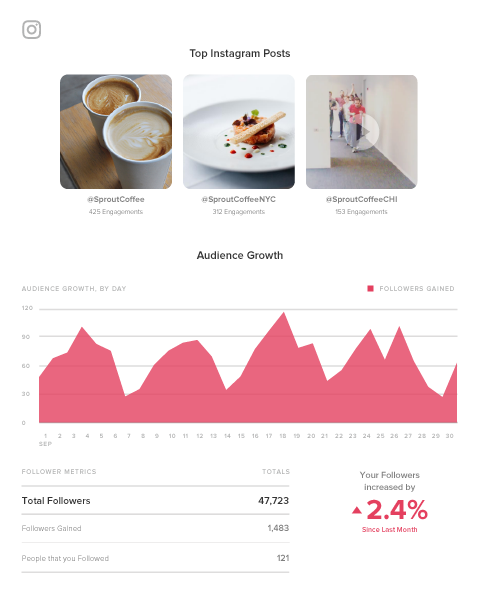
3. Sprout Social
Sprout Social is similar to Iconosquare in that it combines analytics with content creation and management tools.
It has a fully featured editorial calendar for scheduling new content across multiple different social account platforms (including Twitter and Facebook).
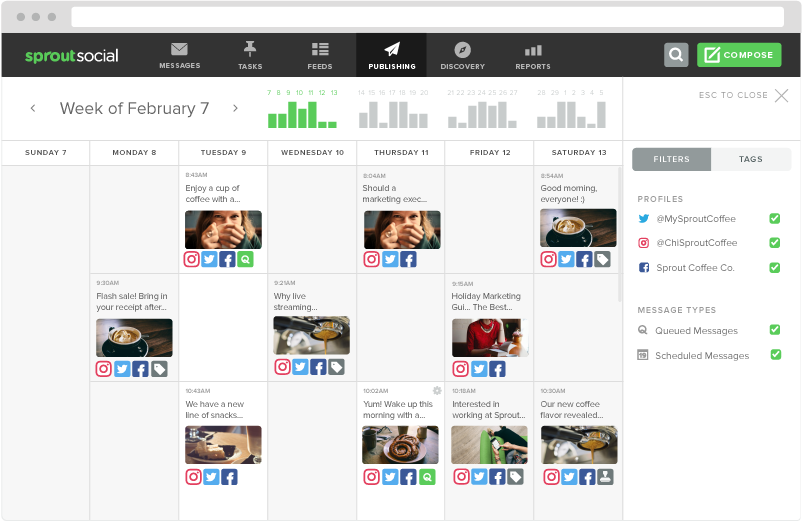
Sprout Social is perfect for larger organizations with rigid guidelines, too, because it has a centralized media library to manage with built-in editing tools.
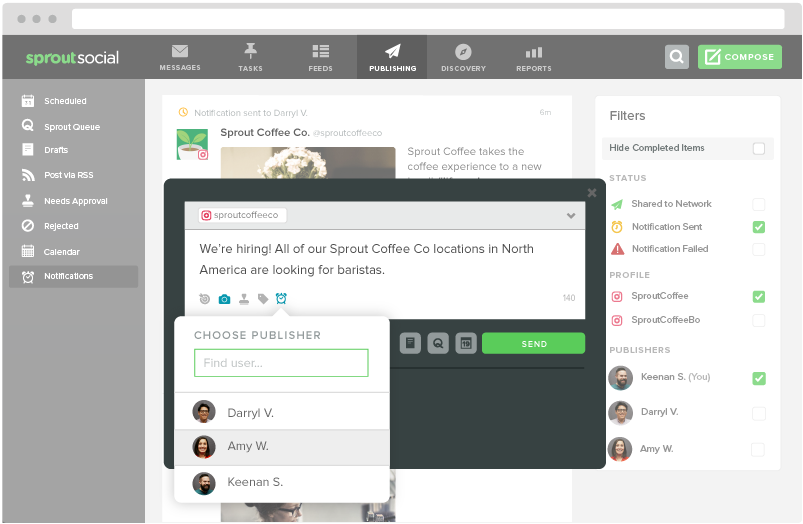
When a piece of content is ready, you can use the push notification tool to update the person responsible for taking the next step (like moving it from draft to preview and from scheduled to published).
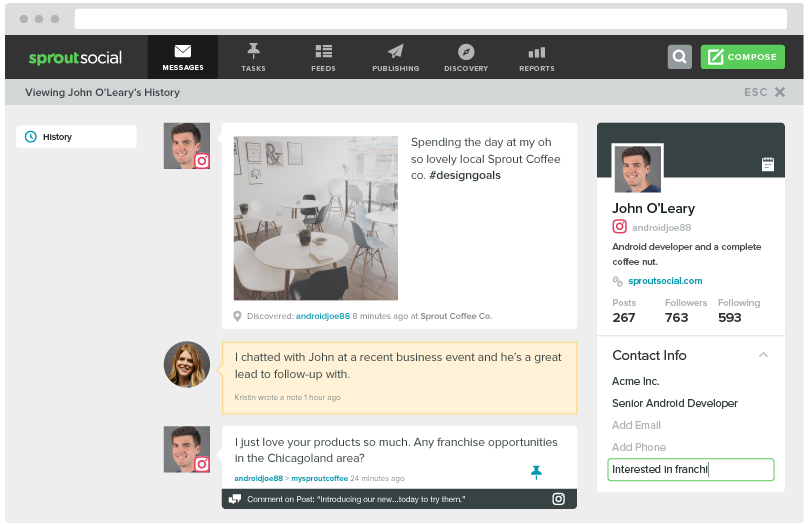
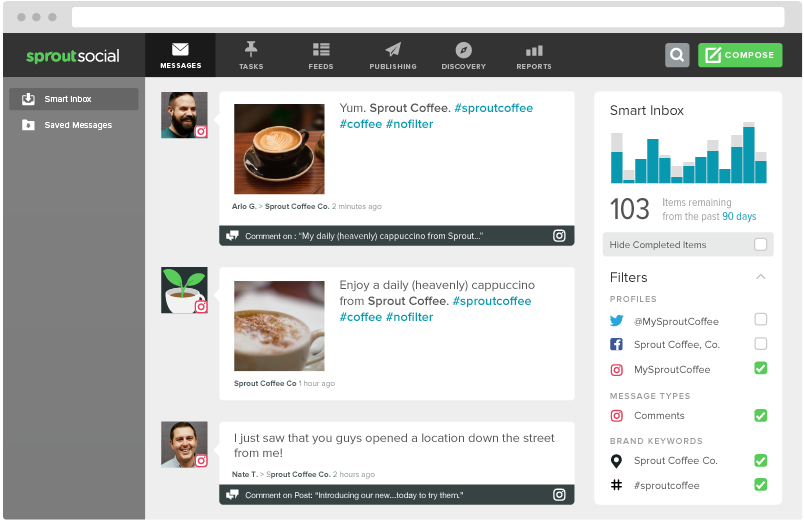
Sprout’s tool set includes a social CRM that will funnel conversations into a central ‘smart’ inbox. Gaining access to this feature can help you boost conversions over time.
You can view the entire contact history with those individuals and then tag messages or assign tasks to your team internally. That way, the responsible team members can follow up appropriately.
You can also dive deeper into individual hashtag performance or even locations that have been geotagged. Pay careful attention to the ways in which your performance compares across each.
Then you can compile all of this insight into “presentation-ready” reports that can be exported or downloaded by clients and bosses alike.
You can also take a spin with the free trial to preview all of these features before paying a single cent.
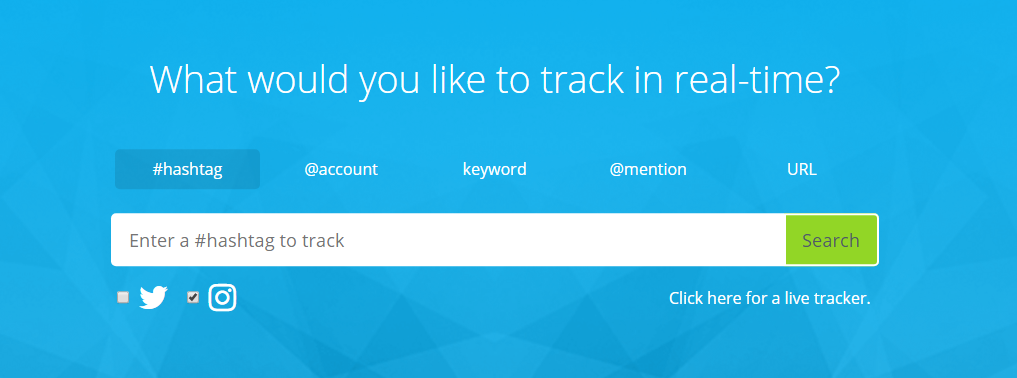
4. Keyhole
Each tool we’ve looked at so far will give you daily reporting features. You need those metrics to track your progress.
However, Keyhole prides itself on giving customers real-time feedback. For example, you can drop in a specific hashtag, keyword, or account to see what trends are starting to emerge.
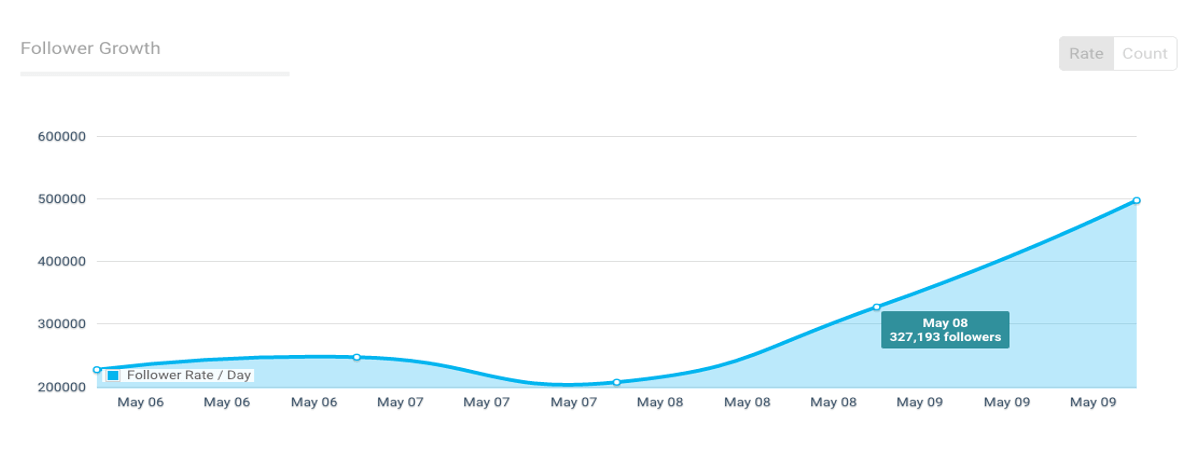
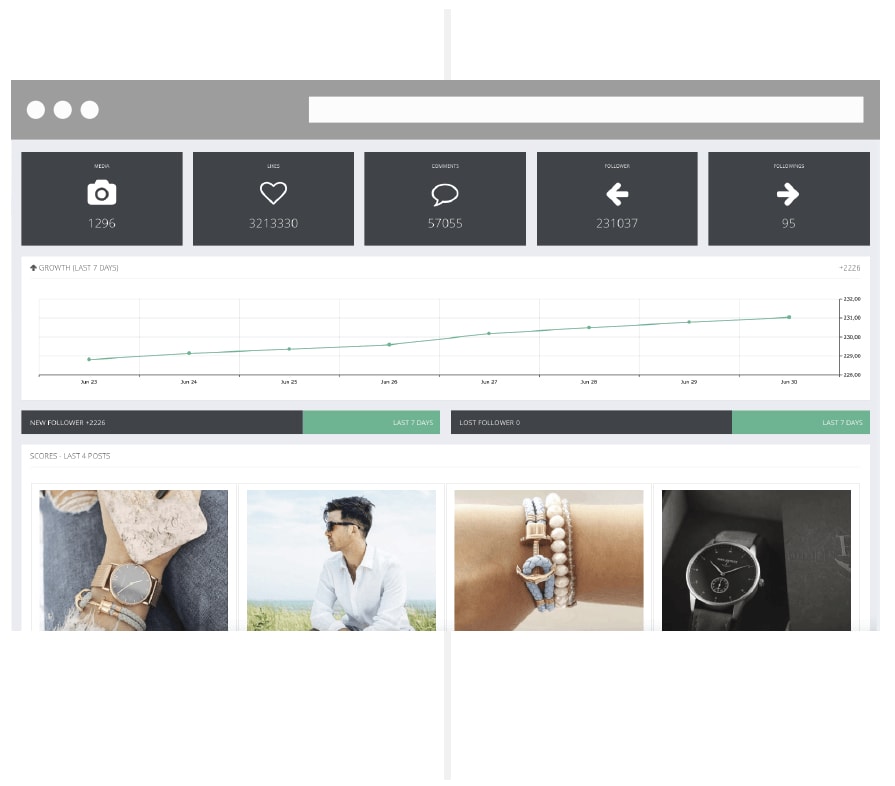
Keyhole will also help you figure out which of your own internal trends are providing the best results, giving you at-a-glance data into what activities are driving the most follower growth over time.
You can also create a feed that will automatically track your competitor’s Instagram accounts to see what’s working for them versus what’s not (then capitalizing on the former while avoiding the latter).
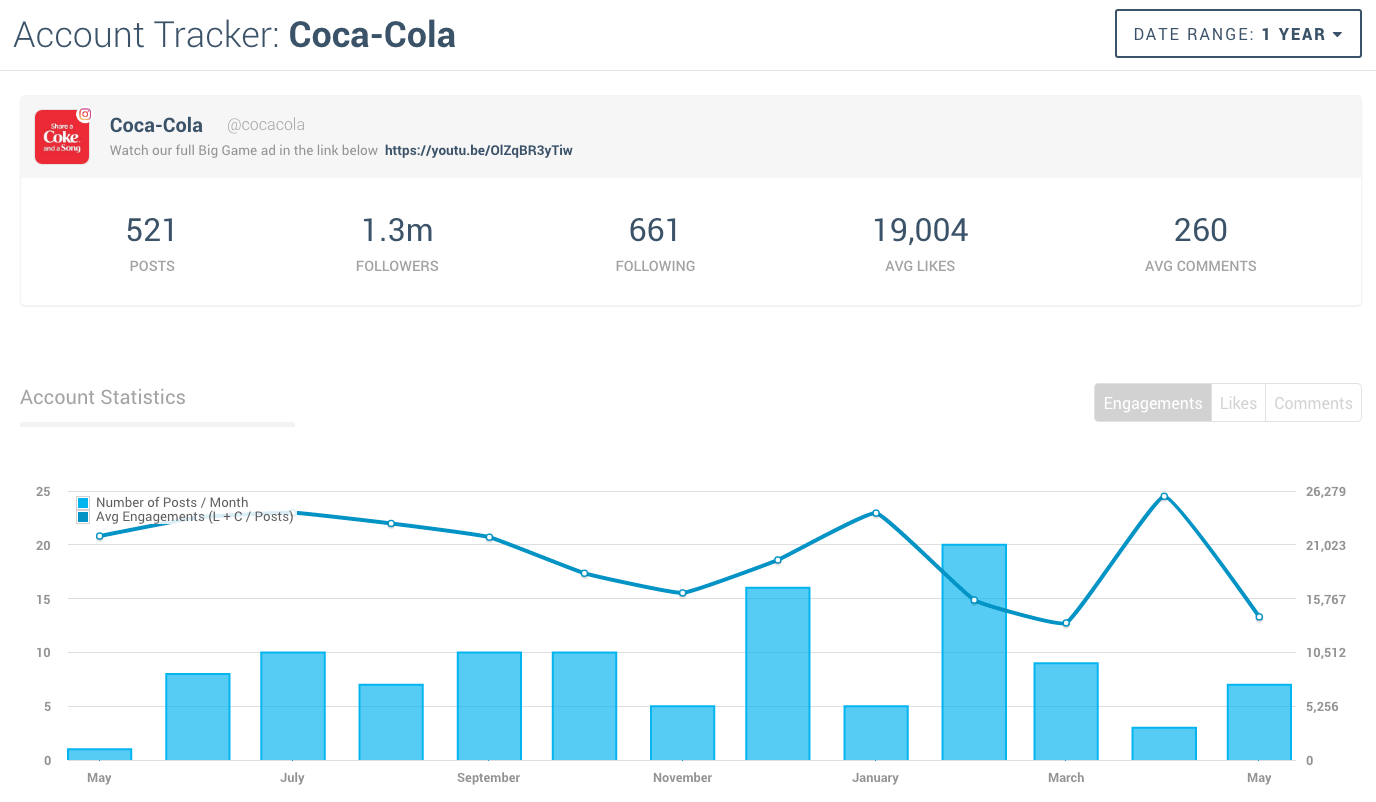
Plus, you can save time by selecting a few predefined KPIs to track. Keyhole will automatically report on those, organizing your data into an easy-to-read dashboard that you can share with team members.
5. SquareLovin
SquareLovin (spelled like McLovin) combines both aggregate data (like overall views and follower counts) with individual metrics on each post (by ‘scoring’ the overall engagement).
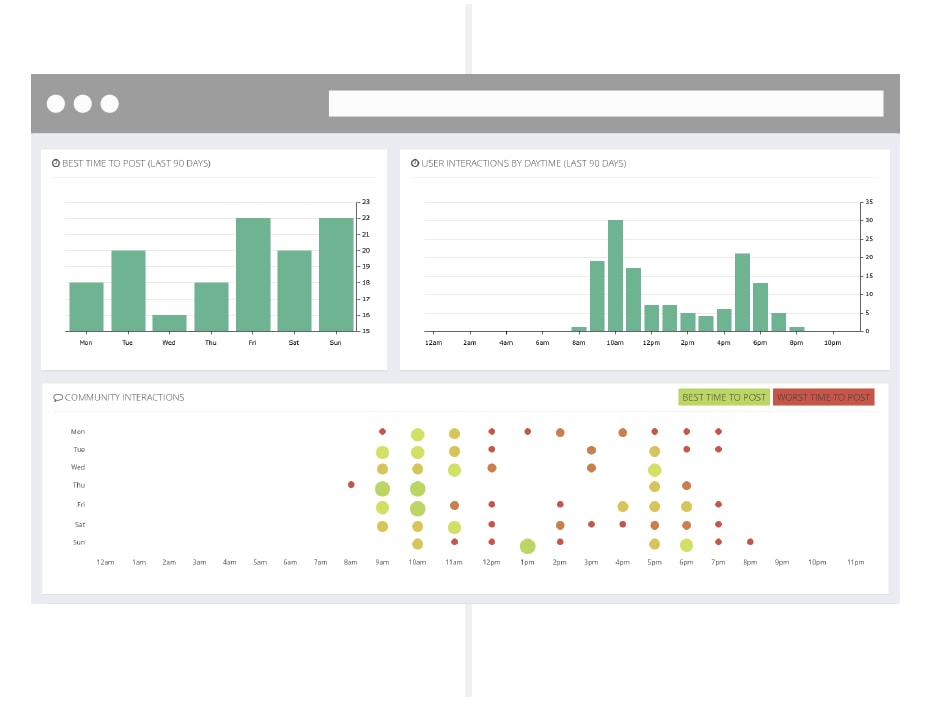
One of my favorite features, though, is the deep dive it gives you into the best-performing times to post.
Like some of the other tools on this list, Keyhole tells you the best time frames for posting based on metrics. However, this tool also explicitly lets you know when you shouldn’t post. This data can be just as valuable, especially if you’re posting all the time.
You might want to constantly test a few of the ‘best’ times to improve performance. However this way, you’ll always know exactly what hours of the day to avoid like the plague.
6. Minter.io
Many of the tools already featured give you information about how your Instagram account or your individual posts perform based on your specific KPIs.
Minter.io takes the next step by providing tactical insight into the content decisions you’re making.
For example, this tool can help you figure out which photo filter performs best among your audience based on a comparison of multiple metrics. Instead of using a single piece of data to decide which filters to use, compare several data points.
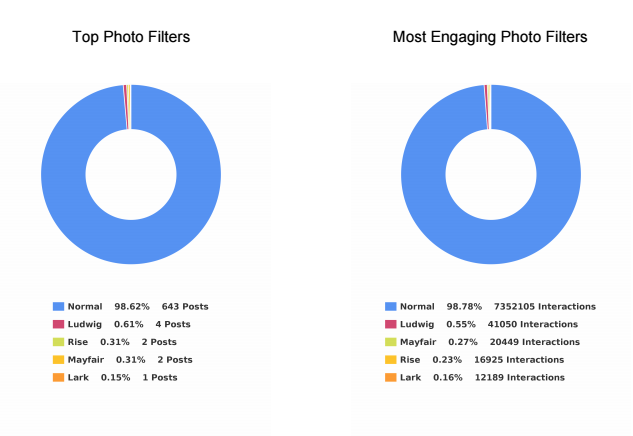
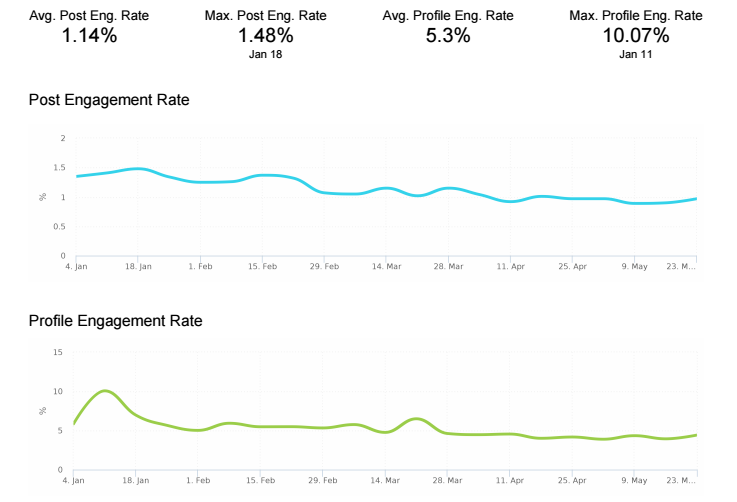
I also love how this tool can break down your post engagement into performance rates.
Here’s what I mean.
If you see that you have 1, 10 or even 100 comments on a post, you’re probably pleased with yourself. But when you stop to think about it, there’s not a lot of actionable insight to draw from comment numbers alone.
Let’s say one account has 100 followers and another has 1,000 followers. Each account gets 10 comments on a single day.
Now, which one is performing better?
The first one, right? That’s because it’s getting a 10% engagement rate on that post as opposed to only a 1% engagement rate. That makes a huge difference at the end of the day!
Minter.io helps you track these performance metrics over time and create benchmarks to see if the quality of your audience is growing as quickly as the quantity.
All social platforms use internal algorithms to determine how many of your posts will be seen by your audience.
That means that, if your engagement is low, the social network might artificially ‘restrict’ how many of your own followers end up seeing your content on a given day.
That’s why we constantly talk about the importance of engagement in social media.
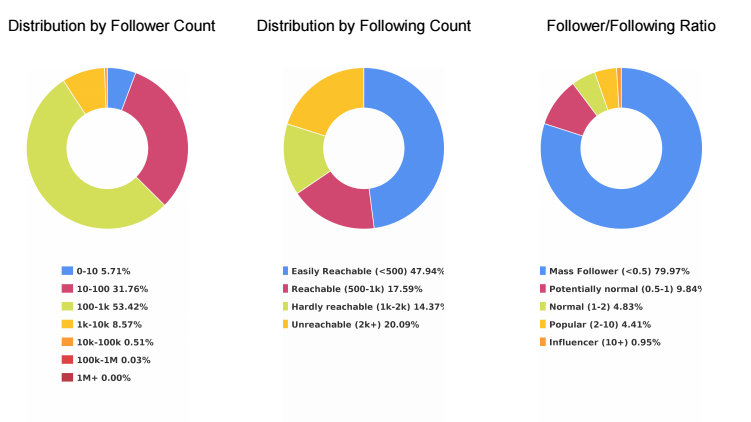
Minter.io will also help you pinpoint big players who are already part of your audience. It’s a great way to identify potential influencers who might amplify your brand message.
For example, followers are split down into several different ‘buckets,’ including:
- Mass Follower
- Potentially Normal
- Normal
- Popular
- Influencer
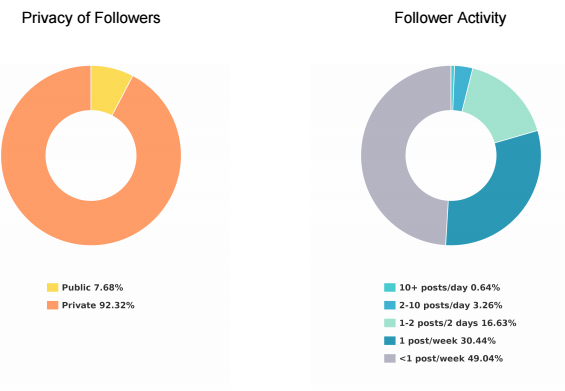
Last but not least, this tool also gives you insight into how active your followers are on the platform.
For example, you can see how many posts each of your followers push live each day so that you can mimic the frequency you know your followers are comfortable with.
If you’re only posting twice a day, but the bulk of your audience posts four times per day, you can easily start increasing your posting frequency without fearing any backlash from your community.
7. Picture.io Influence Score
Picture.io is one of the few completely free analytics apps listed here.
Feature-wise, it’s more limited compared to the other tools you might use, but if you’re just getting started with social media — or if you’re on a strict budget — you can’t beat free.
Additionally, Picture.io does have a few notable features that other tools might lack.
For example, it gives you a simple Instagram influence score that assigns weights to your network size, engagement, and community interactions. All three of these metrics can help you make important decisions about your Instagram usage.
So instead of tracking dozens of hundreds of individual metrics, you get a single, easy score that boils everything down to for simplicity.
You can check out this score across competitors, too, to easily benchmark performance. For example, Buffer’s influence score is a strong 71.
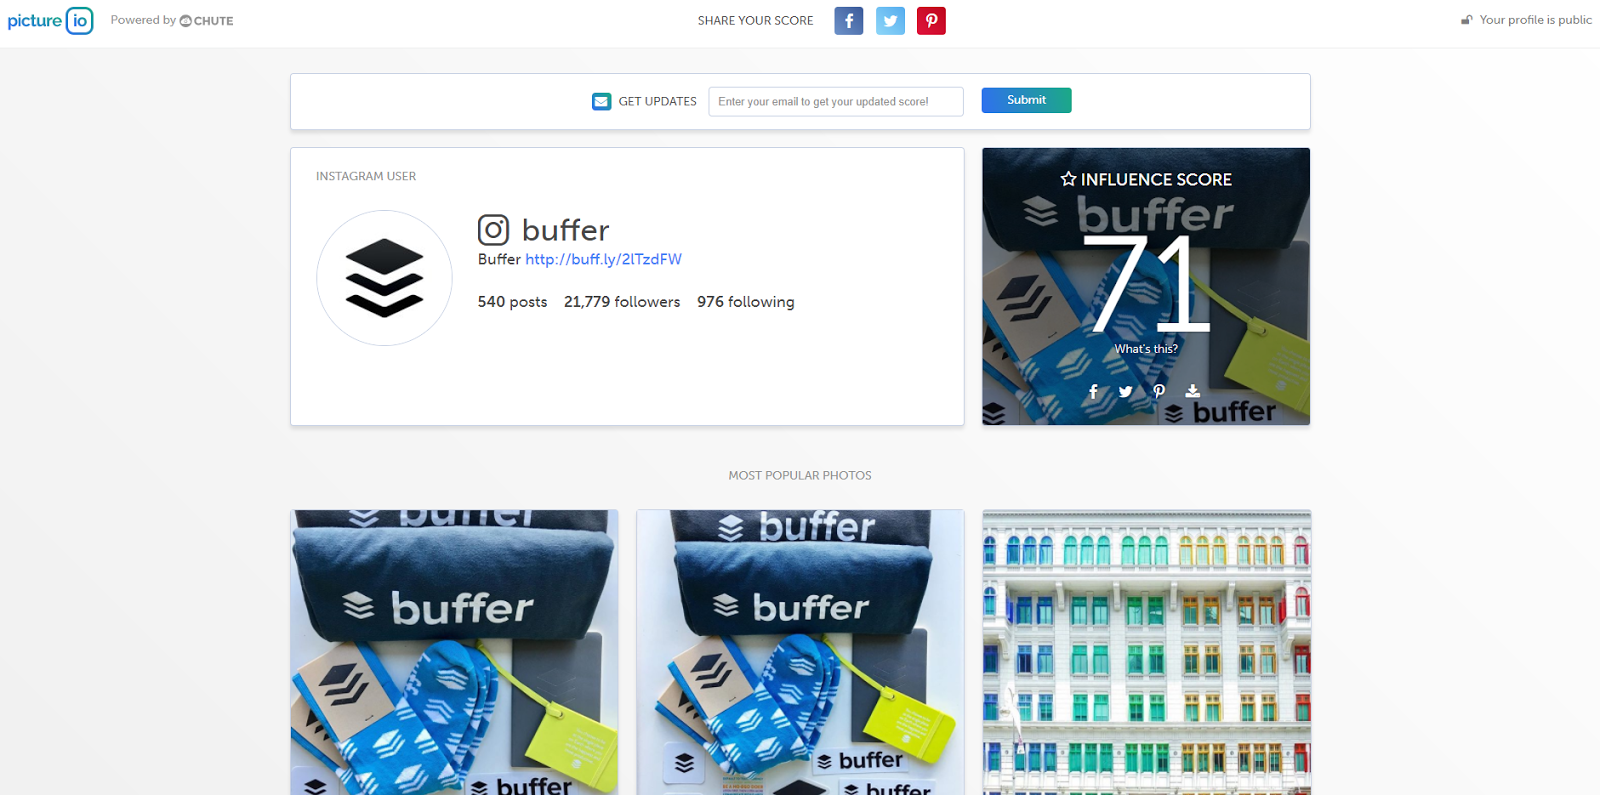
If you just need some informal feedback on how you’re progressing relative to your competitors, Picture.io is the easiest solution on the market.
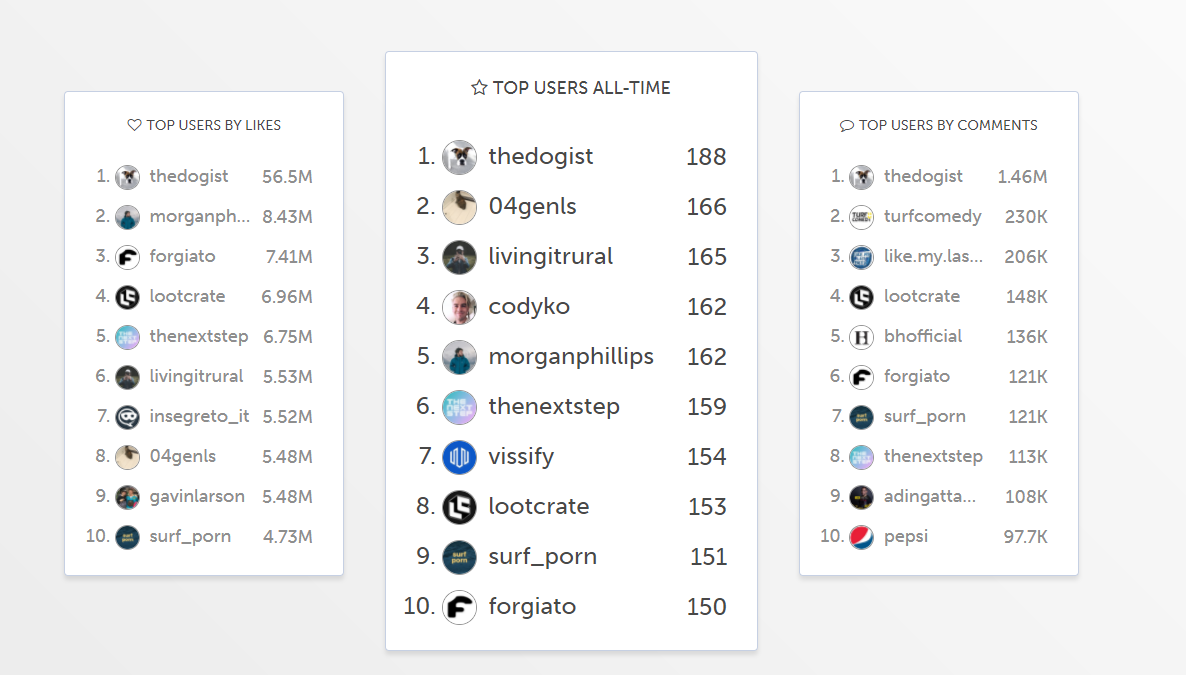
8. SocialRank
SocialRank provides detailed audience metrics for both Instagram and Twitter.
For example, many of the other tools listed above are more focused on hard data or your posts’ individual performance metrics.
SocialRank will do some of that, but it’s more concerned with identifying follower patterns so that you can better tailor your content updates to your audience.
That means it will provide details like the most popular words used in your followers’ bios and posts. You can even see the most popular emojis among your target market.
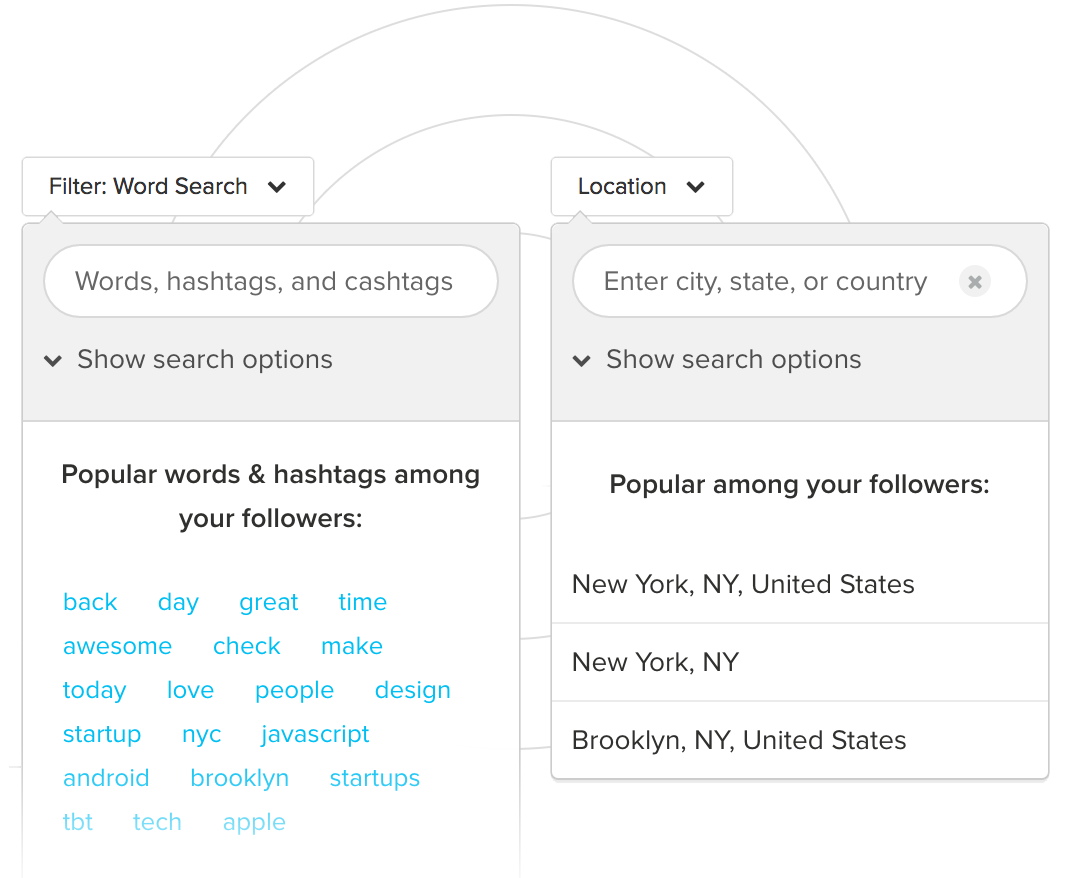
Let’s say you’re trying to find certain types of people, like bloggers or influencers. You can search prospects’ bios based on keywords.
You might also use it for local marketing. Filter your target users by location so you can reach out to potential candidates for local live events and other engagements.
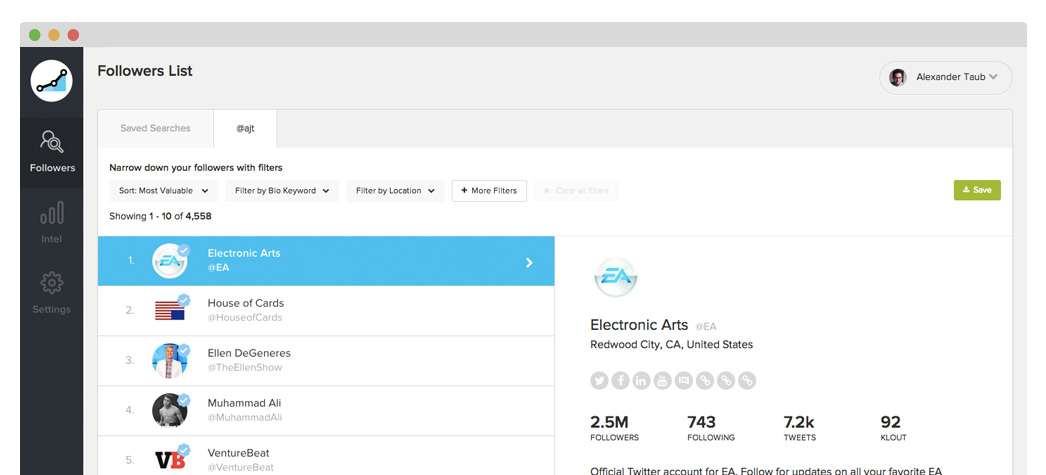
Follower filters help you narrow down the audience into small segments based on some criteria, including the number followers they might have, specific companies, gender, and any combination of those.
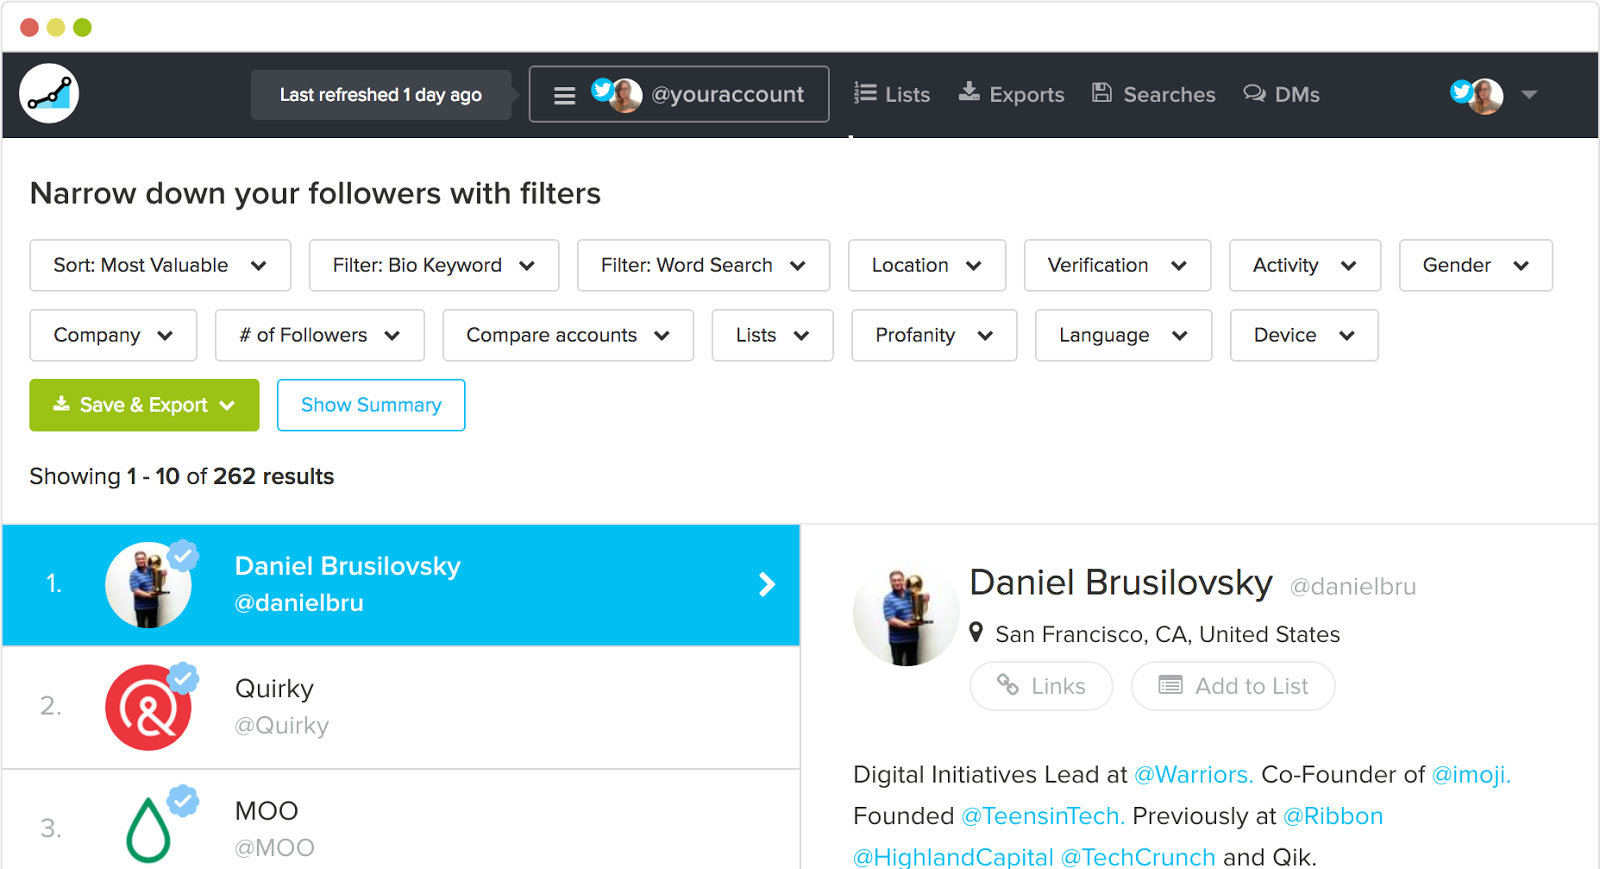
Once you pull up a segment, you can then rank or prioritize these people based on their own engagement with you or their own popularity (by follower count).
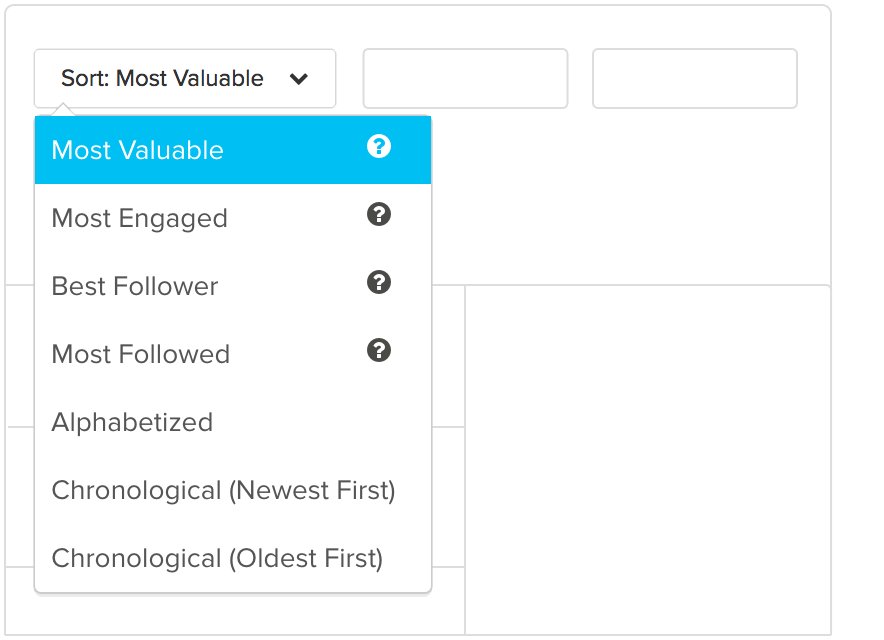
These filters come in handy when you’re trying to pull very specific lists of followers.
For example, let’s say you’re opening a new location in a new city (or simply just visiting a new area for an upcoming conference).
You can overlay these filters together to find people who’re using certain hashtags (such as #craftbeer) and located within a specific city (like San Diego).
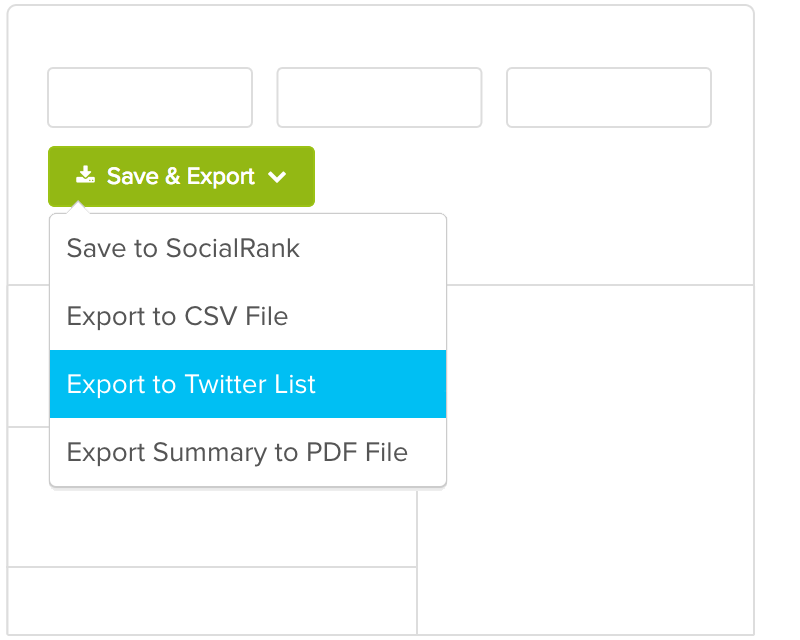
Then you can pull these follower lists into an Excel or PDF document for easy sharing with your team.
It’s incredibly powerful, but not among the cheaper options listed here. I’d recommend using it for larger influencer or PR campaigns. It works best when you need deep audience insight to build buzz around your latest launch.
Conclusion
Social media is fairly simple at the end of the day.
First, you need to understand what your audience wants and is looking for. The second, you need to give it to them consistently.
In reality, it’s a lot tougher than it sounds.
But not if you’re using the right tools to that are telling you what your audience is already interested in, talking about publicly, and reacting to online.
Instagram is often used to reach new audiences, increase your brand visibility, and deepen relationships with the people you already know.
Unfortunately, you can’t always track those things back to new Goal completions inside Google Analytics.
They’re ‘soft’ goals used to move people along your sales funnel, as opposed to ‘hard’ goals that result in a new lead or sale.
That doesn’t mean they’re any less important. It simply means that you need to look for different ways to measure progress and results.
While Instagram’s built-in analytics are helpful, the nine tools listed here go far beyond those metrics. You’ll be able to quickly identify your target customers, figure out what they’re interested in, and learn how to better serve them with new stuff.
After all, that’s what analytics are for, anyway. Not long, in-depth reporting that takes you hours to compile. You’re often better off with quick insights so that you can take action, update your marketing campaign, and grow faster.
What is your favorite Instagram analytics metric to track?
Comments (42)