Can you get your users to do something simply by asking them to do it? If so – congratulations! You have some awesome users 🙂
Most of us aren’t that lucky. As a matter of fact, asking our users to do something, sometimes has the opposite effect!
There is a usability feature called a completeness meter that is employed by companies like Google, LinkedIn, and Box. These types of progress bars inform users of how close they are to completing a set of tasks by showing percentages of completion along the way.
Normally, these are used to encourage new users to add personal information or perform activities to develop a much richer user experience. You can think of a progress bar as missions or levels for a web application.
A Little Flash Back To Social Gaming
This area of onboarding fascinates me because of my social gaming background where I realized something. A lot of our games weren’t that great. But we had millions of users…who were addicted! One way we achieved this was by using proven game mechanics such as missions, points, social dynamics, and engagement loops.
If you do it right, you can make your game more addictive than semi-hard street drugs. In my first year of college, my roommate stayed up until 4:00 a.m. every day playing World of Warcraft. And this other guy lost his job as an English professor. Tragically, this guy actually died. And, sadly, this mom got 25 years in jail. That’s pretty powerful stuff if you can kill someone or make a mother forget her baby with it.
We can use the same techniques to make business applications better and more engaging. In fact, if I had to pick out the most effective tool for onboarding a user, it would be the progress bar.
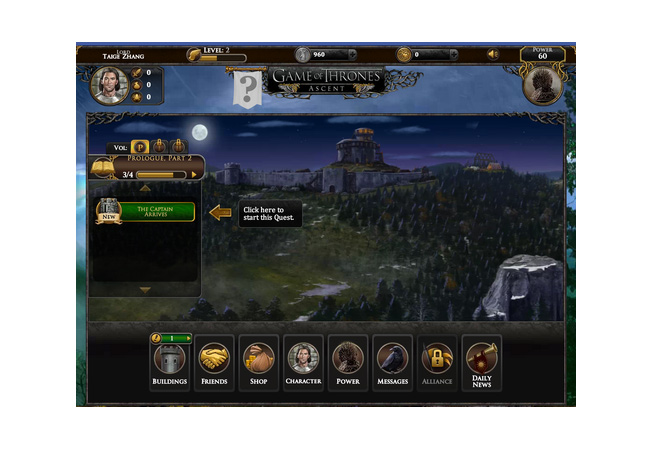
Progress Bar/Quest List on Game of Thrones Ascent (Facebook game)
Psychology of the Completeness Meter
People want progress bars. In the famous paper “The importance of percent-done progress indicators for computer-human interfaces,” Dr. Brad Myers of University of Toronto found people prefer to have progress indicators. Research companies, Lightspeed Research and Kantar, did a study on progress indicators for surveys which also corroborates the idea that people want a progress bar:
- Progress indicators increase survey satisfaction.
- Progress indicators increase respondent engagement.
- When respondents in the no-progress-bar group were asked whether they prefer to have some indication of progress, 75 percent said yes.
Okay, so people want progress bars. But why are they so powerful and effective for engagement?
It’s because, as people, we are driven to:
- Have goals; and then
- Accomplish goals.
We inherently feel good about achieving something. Dr. Hugo Liu from MIT and Hunch.com says in his article Need to Complete, “It turns out that when you finish a complex task, your brain releases massive quantities of endorphins.”
In their book Rules of Play, Dr. Katie Salen at Parsons the New School for Design and Dr. Eric Zimmerman of MIT explain, “Without a measure of progress to give a player feedback on the meaning of his or her decisions, meaningful play is not possible.”
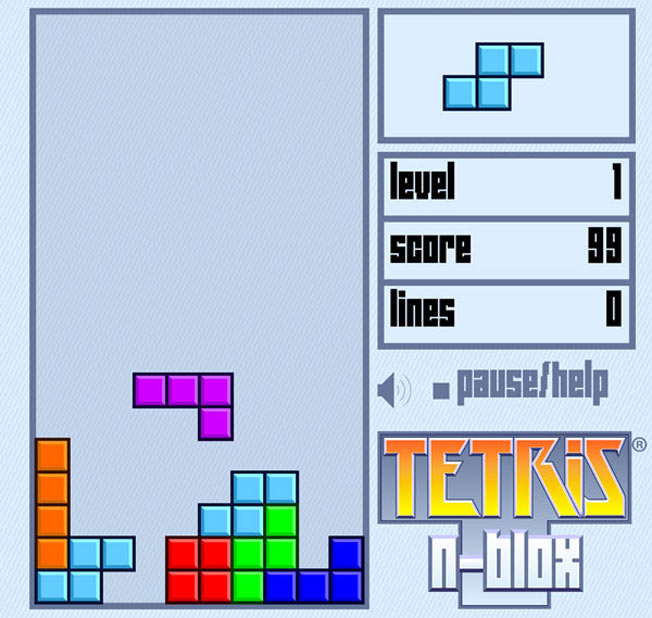
Let’s look at the psychological effects at work in more detail. Dr. Tom Stafford from University of Sheffield, wrote a fascinating piece on BBC about why Tetris was such a massive success. In short, we have a deep-seated psychological drive to clean up, and Tetris holds our attention by continually creating unfinished tasks:
“Trivia takes advantage of this goal orientation by frustrating us until it is satisfied. Tetris goes one step further, and creates a continual chain of frustration and satisfaction of goals. Like a clever parasite, Tetris takes advantage of the mind’s basic pleasure in getting things done and uses it against us. We can go along with this, enjoying the short-term thrills in tidying up those blocks, even while a wiser, more reflective, part of us knows that the game is basically purposeless. But then all good games are, right?”
So what is it about uncompleted tasks? It’s basically the need for closure and the Zeigarnik Effect. In the 1930s, psychologist Bluma Zeigarnik noticed waiters had fantastic memories for orders, but only until the orders had been delivered. She describes this phenomenon as incomplete tasks that remain stuck in memory until they are completed. Both of these effects are built into progress bars.
First, we try to mentally fill in the gaps under Gestalt psychology’s Law of Closure. Our attention is held there as we envision completeness. The incompleteness causes tension (stress).
Second, we do things to resolve the tension. In operant conditioning, this is called negative reinforcement or removing something distasteful. For example, Apple’s iOS has shown us we can remove the ugly and annoying persistent badge if we update our apps. Some people are happy with their apps, but they will update just to make those numbers disappear because they are an annoyance (negative stimulus). With a progress bar, a person can achieve something (positive reinforcement) and remove an annoyance (negative reinforcement) at the same time.
I believe product designers can use this knowledge to hold users’ attention and get them to better understand and derive value from the app. So, if you don’t, you’ll have lost your users before they even know how great your application is. And whose fault is that?
Examples of Progress Bars in Web applications
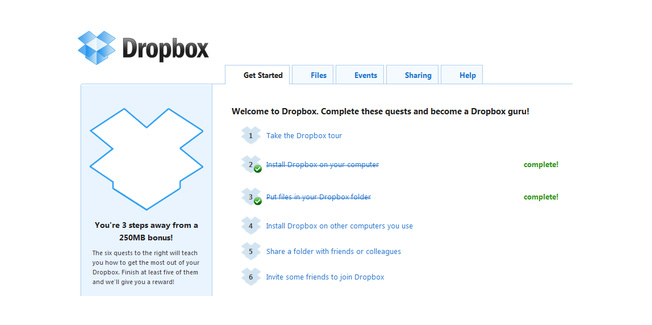
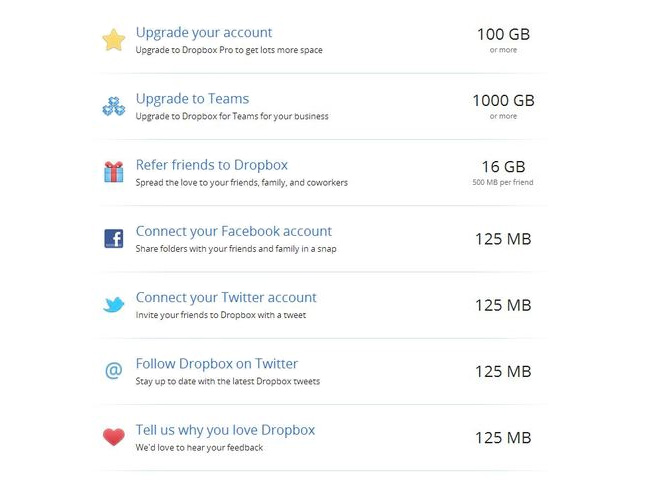
Dropbox has a wonderful “Get Started” interactive task list. I like the way it makes all those tasks seem fun with its cute visuals. (They also went a step further with Dropquest.)
LinkedIn has a brilliant completeness profile bar. Recently, it has been replaced with a cooler profile strength indicator. As a new user, you’ll have a little profile meter on the bottom right of your page. It’s not very intrusive, but there’s a small link that says “Improve Your Profile Strength.”
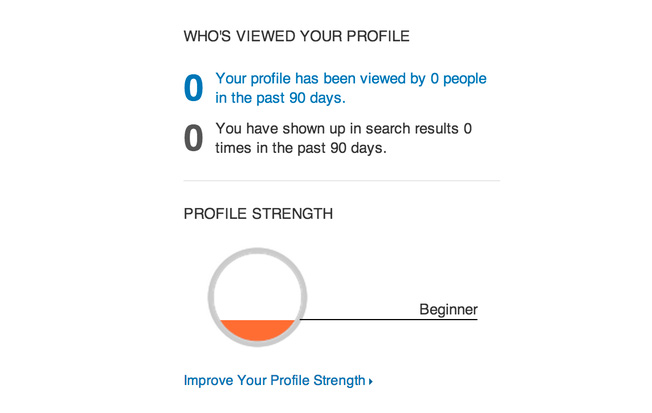
Once you click on it, you’ll see all the things you can do to complete your profile and move up a level.
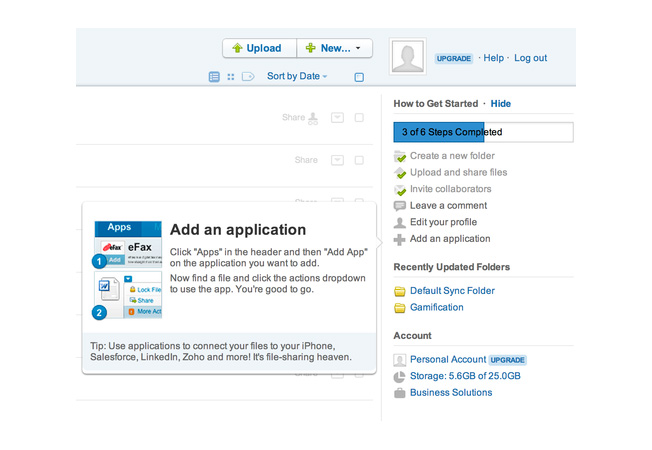
Box has a great “How to Get Started” progress bar implementation as well. I didn’t notice it until I had completed 3 of its 6 steps. If you hover over the task, you’ll see a picture that gives the task context, instructions on how to complete the task, and in most cases a call to action link. This is very well done.
Building Your Own Progress Bar
Right now, most sign-up funnels and progress bars are built in-house. If you’re looking to make an awesome progress bar to help your users and get more activations, I highly recommend checking out UI Patterns’s completeness meter guide. There also are some great progress bar design examples on Quora.
To get an idea of how much effort it takes to build with custom code, we asked 7Geese and Socialscape. At 7Geese, it took them 7 days of development time to build a progress bar with interactive guiders. At Socialscape, it took them 1 day to build a hard-coded, 4-step getting-started bar. Neither one had the resources available to set up analytics.
Let’s estimate the cost of a basic progress bar with no analytics. Say you take their average and use 4 days. Assuming your developer costs $90,000 a year and works 40 hours a week, that’s about $43.27 per hour. Four days is worth $1,384.61.
Let’s see what results would be required to make this worth building.
Break Even Analysis
(new users) * ( lift in activation) * (value of an activation) = cost of development
Imagine we’re Shopify and assume, after building the progress bar, we get 100 new users. Each user has a LTV of $4,158 because they stick around for 3.5 years, pay 12 times a year, and the average payment is $99/month. We want to solve for the X which is the lift in activation break even point.
(100) * (X) * ($99*12*3.5) = $1,384.61
If they can get more than a 0.3% lift in activation because of the progress bar, it would make the investment worth it.
Shopify has 40,000+ stores right now, so I’m assuming they’ll probably see more than 100 new signups in the future. If they have 1,000 new signups, the required lift goes down to just 0.03%. Any more than that, it approaches zero. And that’s not even factoring in missions that can drive virality, which adds more users into the equation.
The numbers show it might make sense for your company to build a progress bar into your application, if you don’t have one already.
Final Thoughts and Tips
In summary, users want a progress bar, your app will benefit from a progress bar, and it’s generally financially profitable to build. Now that you’re all excited about making a cool progress bar, I’d like to offer a few tips:
- Don’t shortcut analytics. It’s important. A progress bar is not only for the user. Wouldn’t you like to see at what point users most frequently abandon, where most of your users are, and which users might need help? Utilize analytics that can help you and your users.
- Make meaningful missions. Even though the progress bar is powerful and inherently rewarding, you still should try to provide interesting missions for the user. It’s just like building a form – don’t ask for things you don’t need. Build only missions that are part of your funnel or drive value. For example, one of Dropbox’s missions is to “Upgrade your account.” That’s the last step of its funnel.
- Add rewards. Dropbox gives free storage every time you complete a mission. Can you do something like that? If not, explain the value. For example, LinkedIn shows “Users with complete profiles are 40 times more likely to receive opportunities through LinkedIn.”
Finally, there is very little data on the actual effectiveness of progress bars. I guess it’s kind of like setting up an experiment to see if riding a bike is faster than walking after buying a bike.
About the Author: Taige Zhang is a well-traveled product marketer at Kera.io, a software startup specializing in onboarding for SaaS businesses. He previously worked in analytics and product management at Apple, WPP, and Rocket Internet startups. You can find him on Twitter here.
Comments (12)