The Real-Time reports section in Google Analytics allows you to monitor activity on your website as it occurs from moment-to-moment, providing insights on how people are reacting to your marketing campaigns and infrastructure.
This feature is great for measuring marketing initiatives that have a temporal nature, like a promotional campaign on Twitter. You can also use it to gauge the reaction of your audience to an email campaign or a new piece of content published on the blog. Moreover, Real-Time reports aren’t just a marketer’s tool––various departments can utilize real time analytics, from IT to customer service and PR as well as developers looking for in-app data.
In this post, I’ll focus specifically on how marketers can take advantage of Real-Time reports to extract meaningful data about activity on their websites. First I’ll review everything you can find in Real-Time, and then I’ll go over a few practical ways to use these reports.
Let’s get started!
What You’ll Find In Real-Time Reports
To see Real-Time reports data, navigate to the Reporting tab and select Real-Time from the left-hand report navigation column.
(Note: A user qualifies for the Real-Time reports section if he or she has triggered an event or pageview within the past 5 minutes. Conversely, in standard reports a session is defined by a 30-minute window.)
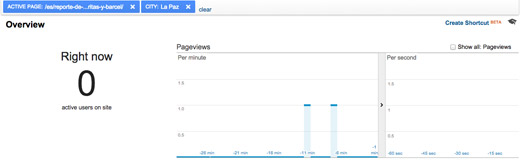
Overview
The Overview section gives you the big picture in terms of what’s happening on your website at any given moment. You’ll see how many visitors are currently on your website, what pages they are spending time on, the top overall traffic sources, your top social traffic sources and what country your active users reside in.

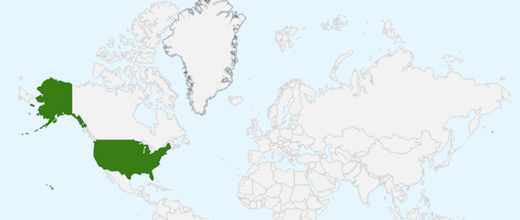
Locations
The Locations report tells you which countries your active visitors are from––both in list form and on an interactive map. You can filter your data by country by clicking on one of the options in the list or on one of the points on the map.
Traffic Sources
The Traffic Sources report lets you zero in on what websites your current visitors come from. The data is organized by Medium, Source and the number of visitors from each one.
This is useful if you’ve gotten a couple of major press mentions and you want to quickly gauge which is generating more traffic, or maybe you’re running a promotion on social media and you want to see if it’s working.

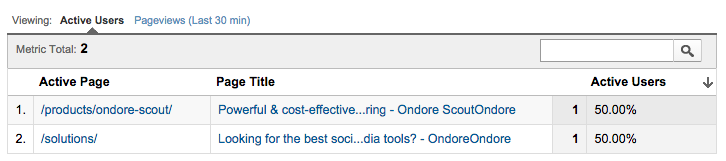
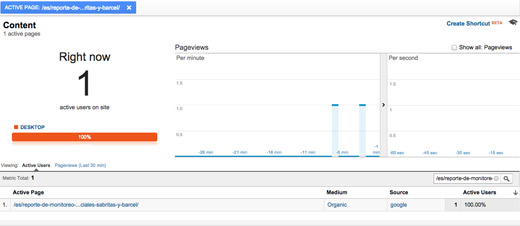
Content
The Content report shows which pages your current visitors are spending time on, including the page URL, the page title and the percent of active visitors that are on each page. You can toggle between active users and a list of page views in the past 30 minutes.
Events
The Google Analytics Events feature allows marketers to create custom events for interactions on their website, including button clicks, downloads, video plays, and ad clicks. You can track the top events on your website as they occur in real time and drill down on specific event categories and actions with the Real-Time Events report.
As with the Content reports, you can toggle between events currently being triggered and those activated within the past 30 minutes. This is great for testing, which I’ll talk about in more detail below.
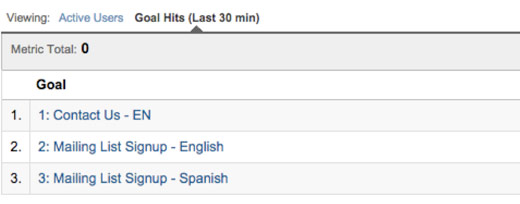
Conversions
The Conversions report shows you which goals active users are completing. You’ll also learn the total number and the percentage of active users who have completed a goal. And, as with Content and Events, you can cycle between data on Active Users and Goal Hits in the last 30 minutes.
This is useful for testing conversion form and goal configurations, and it’s also good for seeing if a campaign you just launched is driving the results you’d hoped for. More on that in the next section!
Shortcuts
This feature is pretty cool. In the top-right corner of each report within Real-Time you’ll see a button that says “Create Shortcut”. This button, which is still in beta, is designed to help you save time by storing the configurations for customized reports you run frequently.
To create a shortcut select a filter to apply to your real time data. You can create a filter by clicking on any hyperlinked data point listed in Real-Time reports, such as your #1 Active Page or the 3rd-most popular country driving traffic to your site. You’ll notice that Google Analytics immediately filters your data to display information pertaining to your chosen variable(s).
Once you’ve segmented your data according to your needs, click the “Create Shortcut” button. This will generate a custom report displaying your real-time data with the segments you’ve selected. You can revisit this report anytime by clicking on its name under the Shortcuts section in the main sidebar.
4 Smart Ways to Use Real-Time Reports
1. Troubleshoot UTM Parameters & Events
Real-Time reports are a great tool for testing the analytics system behind your marketing. For example, you can instantly see if the UTM parameters you’ve created for your next email marketing campaign are working as desired by clicking through the link in your email and tracking how your UTM parameters show up in your Real-Time reports.
Similarly, you can use Real-Time to test the configuration of your Events. In my last role as a Marketing Manager I set up Event tracking code for several buttons on our flagship product’s website, and I used Real-Time to make sure that each event was firing correctly and that the naming conventions were implemented properly before taking everything live.
2. Monitor Temporal Campaigns As They Unfold
As Chuck Liu points out, more often than not looking back on historical data after executing a campaign is the best way to cull meaningful insights from data, but highly-temporal campaigns can benefit from real time monitoring as well.
For example, maybe you’re launching a social media promotion and you want to see how your audience is reacting at the moment and shape additional content based on their reactions––in this case, the Real-Time feature will be your best friend. You can react to the information seen in the Real-Time reports and “pour fuel on a fire” by asking influencers to promote your campaign or activating ads. You can also gauge when traffic from a tweet drops off so that you know when it’s time to post again.
3. Fine-Tune Your Content Strategy By Capitalizing on Trending Topics
If you run a media site or oversee an aggressive content marketing strategy, Real-Time reports can help ensure you’re showing the right content at the right time. For example, if you check the Content report and notice a blog post is suddenly gaining attention due to something happening in the news, you could highlight it on the front page of your site.
4. Run A/B Tests in Real Time (High-Traffic Sites Only)
This post explains how to use Real-Time Reports to a/b test new features on your website. For example, an e-commerce site can test two different versions of a buy button for its most popular product, or they can switch out the order of product links in the sidebar to see what drives more sales.
Keep in mind that this only works for sites with high levels of traffic as you’ll need a significant amount of data in order to make an informed decision.
Wrap Up
It can be tempting to click on the Real-Time reports tab and pass time watching whatever’s happening on your site at any given moment (“Wow, there are 1,003 people on my site!” … “YES, someone just clicked on the link to my blog in this morning’s email!”). And it’s OK to do this now and again, but make sure you focus on using Real-Time to extract actionable, meaningful insights about the activity on your website.
Now we’d like to hear from you: How do you use Real-Time reports? What role do they play in your analytics?
About the Author: Chloe Mason Gray specializes in digital marketing and growth strategy for small businesses and solopreneurs. Be sure to say hi to her on Twitter.
Comments (2)