Google Analytics is a tool that can help you find insights into what’s happening with your website.
You can use it to access information about your traffic sources, engagement levels, the overall success of your campaigns, and so much more.
The majority of companies are using data analytics to make decisions for every marketing area of their business, so you’re the odd one out if you’re not.
But if you’ve never used Google Analytics before, the vast number of different reports that are available can be a little overwhelming when you’re just starting out.
Once you’ve set up the tool on your website, what reports should you run first? Where can you find reports that will help you drive sales?
You can find the answer to all of these questions in real-time reports.
Here’s how you can use real-time Google Analytics reports to drive live sales.
To begin, let’s talk about the different types of Google Analytics reports that are available.
The different types of Google Analytics reports
Reports on Google Analytics can typically be divided into two different types.
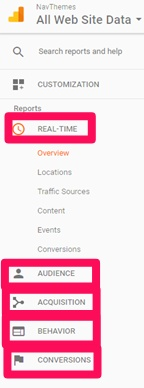
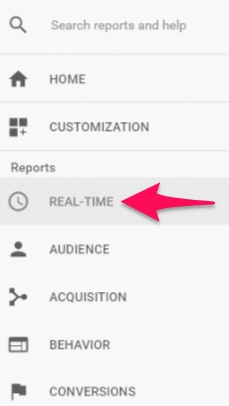
First, there are your regular, standard reports. These are the pre-set reports you’ll see listed on the left-hand side of the dashboard.
These are divided into the following segments:
- Real-Time
- Audience
- Acquisition
- Behavior
- Conversions
Google Analytics pre-sets the data appearing in these reports. But you also have the option to customize the data if you want.
This means that you can tweak standard reports to suit your brand’s specific needs.
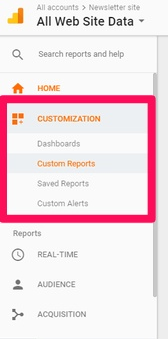
Which brings us to the second kind of reports, known as custom reports.
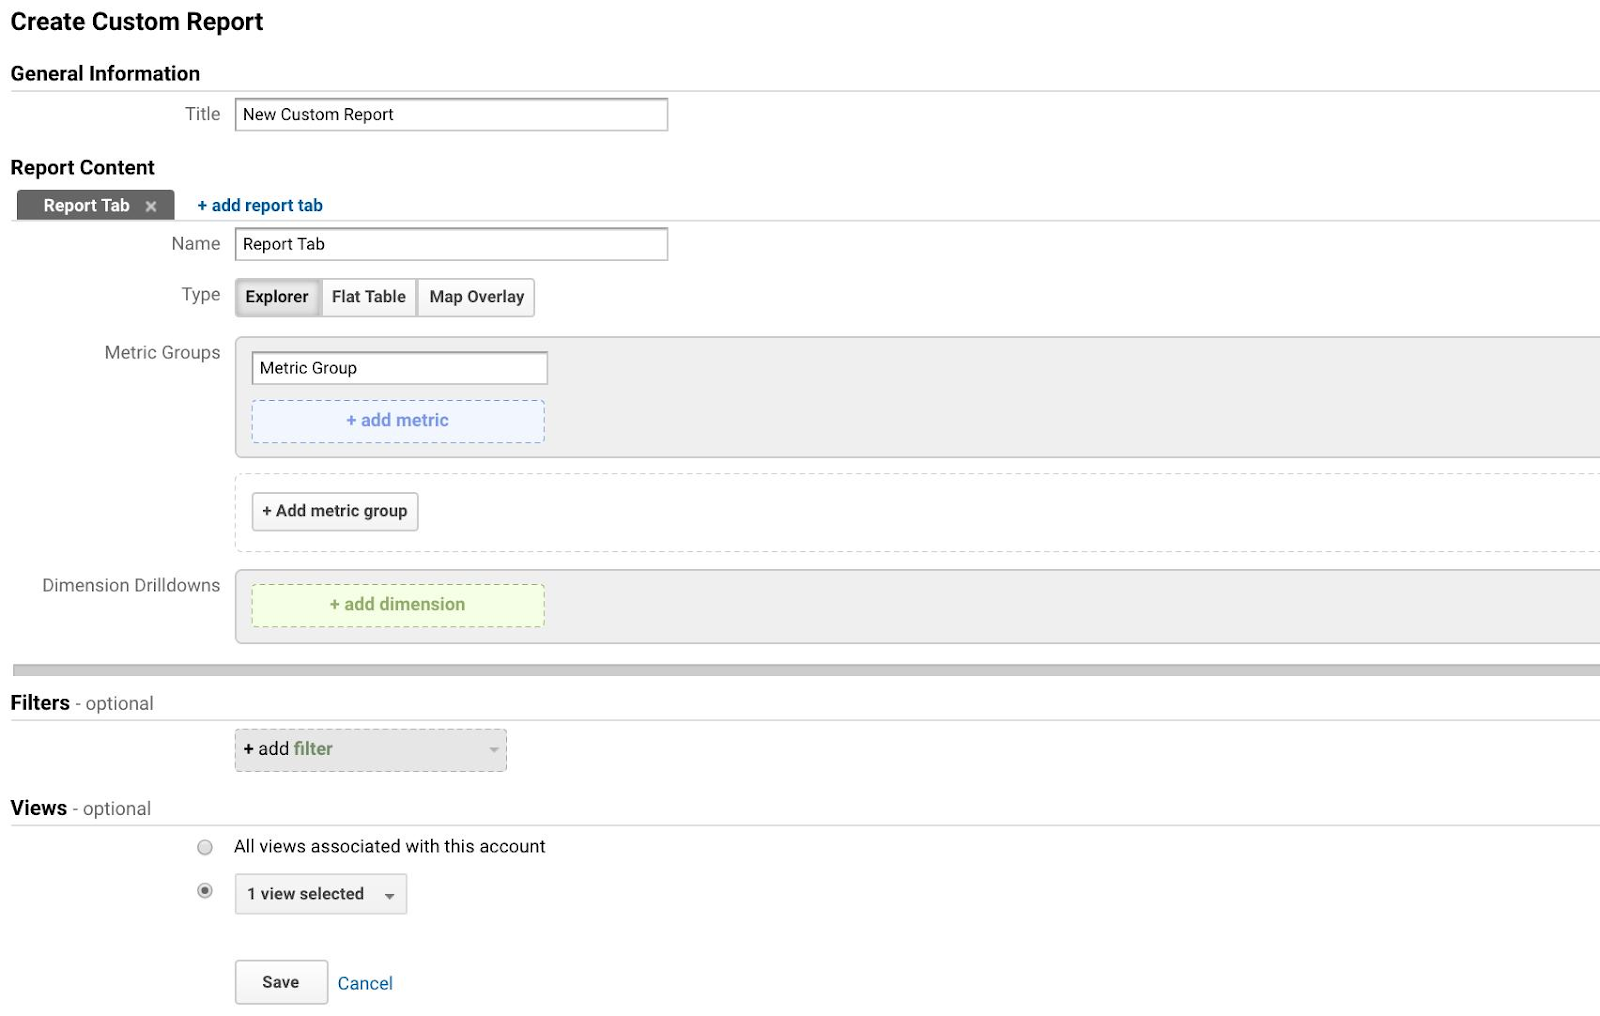
These are reports created from scratch that target the data you want to gather, or they can be based on a standard report with additional segments added.
To create a custom report, “+ New Custom Report” button and complete the required fields.
Real-time reports are a bit different than custom reports.
They are a group of live reports that are pre-set by Google. In-the-moment data reporting is what they’re all about.
This means that you can get a view of how visitors are accessing and interacting with your website as it happens.
The data is available within two seconds of a visitor hitting your site, so there’s no waiting involved. You can get insights about your site in just seconds.
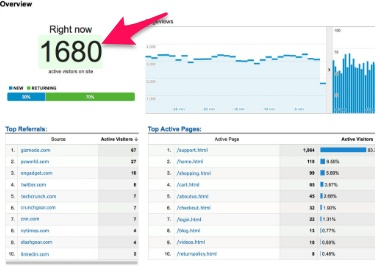
When there is an increase in active visitors on your site, the “Right now” number increases and is highlighted green.
When this number decreases, it will become highlighted in pink.
Real-time reporting is available to all Analytics users. No changes to your tracking code are needed.
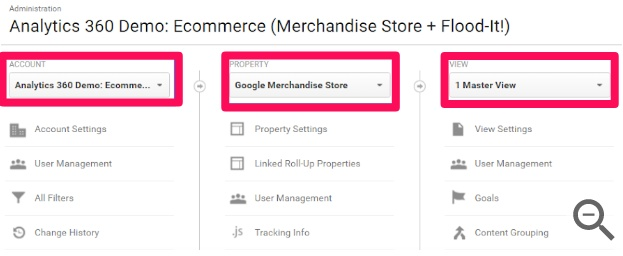
To view real-time reports, start by signing into your Google Analytics account.
Then, navigate over to your account view.
Open “Reports” and click on “Real-Time.”
The benefits of real-time reports
Marketo is a marketing automation company that partners with more than 3,750 B2B and B2C companies like Charles Schwab, Curves, and GE.
The company used Google Analytics to boost conversions 10x more than traditional display marketing.
Their goals for using Analytics were to generate more conversions, boost customer engagement, and complete an online remarketing campaign.
Other results included a 117% YOY increase in their qualified leads and 200% more conversions for B2C with 150% more for B2B users.
You can find similar success with Google Analytics reports.
There are tons of opportunities for you to take action based on data and findings from these reports.
For example, if you’re planning to post a new article, you can use real-time data to publish your piece at a time when there is a large number of active viewers on-site.
This will boost its chances of being seen and shared and give your article maximum exposure.
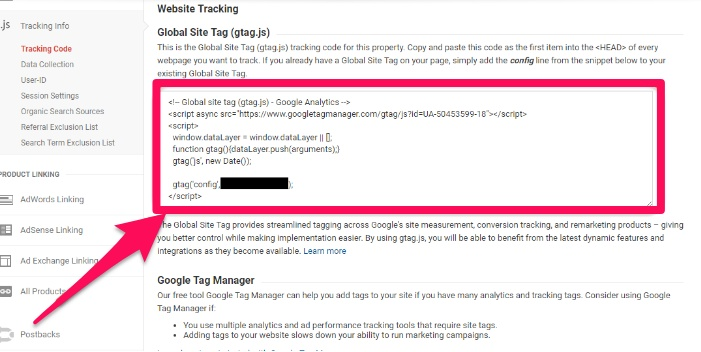
You can also check that your tracking code is installed correctly on your website with real-time reports.
That way, you won’t have to wait around for hours at a time for data to process before being able to check reports and find out if your page is being correctly tracked.
Real-time reports also give you real-time insights about whether site visitors are bouncing off of your site quickly.
This will help you determine whether or not your content is engaging or effective without having to do a ton of research.
Next, let’s talk about each section of real-time reports, starting with the overview report.
Get a bird’s eye view with the overview report
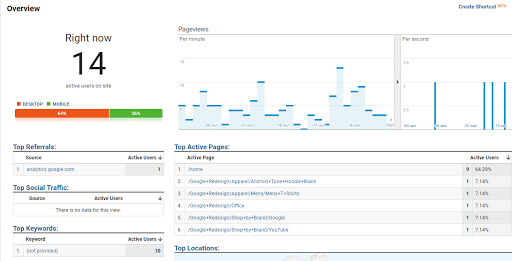
The overview report serves as an overall view to help you get the big picture of what’s happening on your site at any given moment.
Think of this report as the “central hub” of all things real-time.
This report shows how many people are currently visiting your site, a list of the top most active pages, top sources of referral traffic, and top traffic sources.
It also shows the top locations that users are visiting your site from, which can help give you real-time insights into your customer demographics.
(If you want more in-depth data about the location of your site visitors, you can always head to the “locations” report, which we’ll talk about later on.)
Information about top keywords is also available within this report, which can help you find out if your keyword research efforts are actually paying off.
Next, we’ll go over the importance of the events section of real-time reports.
View all events in one place with the events report
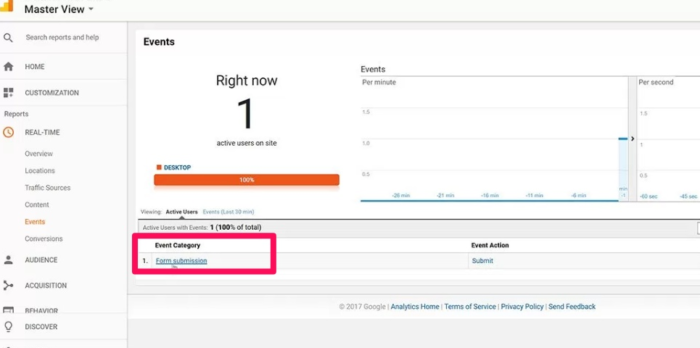
The events report shows which events are currently taking place on your site.
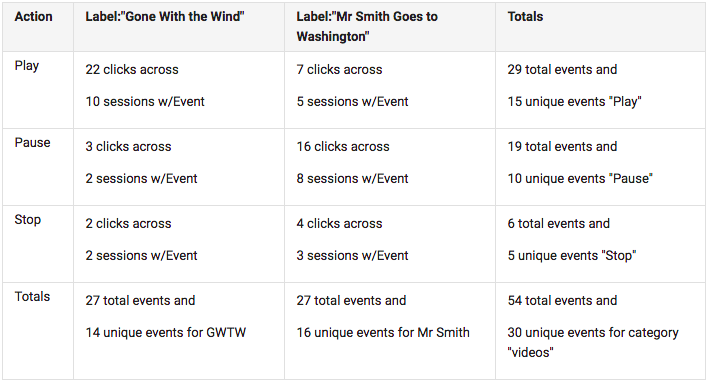
It also shows which events have taken place for the last 30 minutes. The “Event Label” is hidden by default, but you can uncover it by clicking on one of the “Event Categories.”
Events help you view what active users are actually doing on your site while they’re online, which can help you move them further down your funnel.
For example, if you know that a ton of users are heading to a form submission but aren’t submitting the form, you can A/B test different versions to find out which one works best.
Then, you’ll capture more quality leads that can be used to make sales in the future.
This report is especially useful if you’ve ever used the Google Analytics’ Events feature to add custom events like downloads, clicks, or video plays on your site.
And the real-time traffic sources report lets you see how users got to your site.
Access real-time traffic sources
Understanding your traffic sources is important.
If you’re not sure how people are getting to your site, you won’t know where to focus your attention.
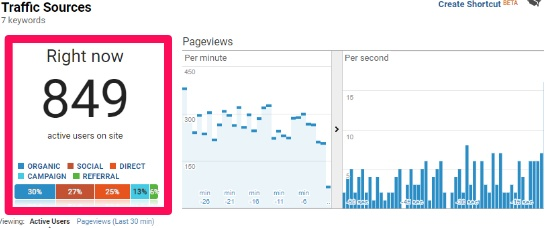
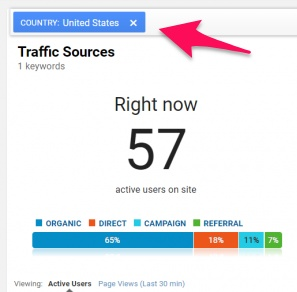
The real-time traffic sources report shows you how your active visitors found your website by categorizing visitors as organic, social, email, direct, campaign, referral traffic, etc.
This lets you see an instant picture when it comes to metrics like paid and organic search.
You can see exactly which campaigns are driving visitors, which helps you determine which social networks and alternative sources you need to take more action on.
This report can be useful if you’ve been mentioned in the media and want to gauge which press source is sending the most traffic to your site.
It can also be helpful if you’re running a social campaign and you want to gauge how well it’s performing.
The content report shows you which pages people are currently active on.
Check out the content/screens report
The content report, which is called “screens” if you’re looking at analytics for mobile apps, shows which pages of your website visitors are active on right now.
This report displays the page URL, the page title, the number of active visitors on a page, and the percentage of active visitors on the page.
You can look at page views broken down by the minute or by second.
You can also view this report by page views that have taken place in the last 30 minutes instead of getting a breakdown of current users.
The real-time content report also breaks down your user data based on the devices that they access your website from.
This is great because you’ll receive active data about which visitors are coming to your site from desktop, mobile, or tablet sources.
View where users are visiting from with the locations report
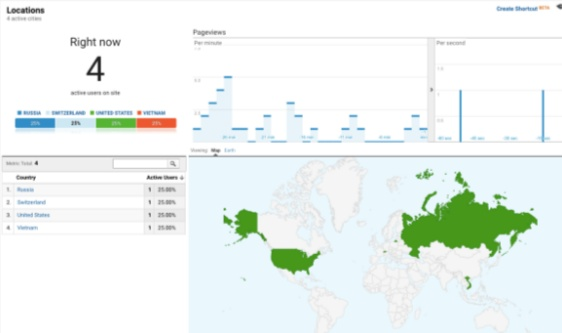
This report gives you a list of countries and cities, along with a breakdown of how many active users from those countries are currently on your site.
A visual of this data is provided in the form of a map and you can filter or zoom in on any specific country by clicking on its name from the table or the map.
If you select a city or country, you’ll be able to filter all of your data on other reports by that specific city until you clear the filters.
If you’re interested in tracking conversions, there’s a real-time report for that, too.
Tracking with the conversions report
If you aren’t already tracking your conversions, you should be.
Your conversion rates can show you how many of your site visitors are moving down your sales funnel and converting into customers.
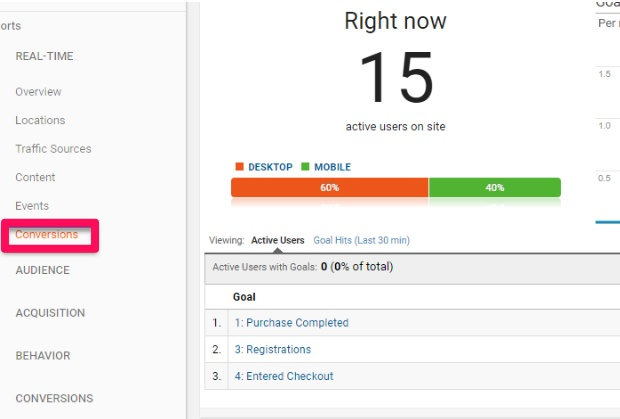
The conversions report shows which conversions have been recently completed on your site.
This report only shows goal conversions and doesn’t list any kind of transactional information or data.
Instead, it only provides insights into the event and destination-based goals, which are just as important.
With this report, you can see how many users have completed a purchase, registered for an account, or entered the checkout section of your site in the last 30 minutes.
This information can help you view how many desktop vs. mobile visitors are converting on your pages.
You can then use this data to make decisions about any changes you should make to the mobile or desktop version of your site to optimize them for users.
Now that you know how each of the real-time reports works, it’s time to look at how to implement them into your campaigns.
Using real-time reports in your campaigns
Usually, the best insights from a campaign are gathered after it’s completed. After all, a watched pot never boils.
While it isn’t always the best idea to sit around and watch the numbers on your site increase and decrease, there aren’t many reports out there that give you insights into what’s happening live.
But there are some kinds of campaigns out there that can really benefit from real-time monitoring because it allows you to influence and change campaigns in the moment.
And when you can change campaigns instantly rather than waiting until after they’ve already happened, you can change the outcome and overall success of them.
For example, if you’re running a social campaign, you may want to adjust your activity level in real-time depending on how your audience is (or isn’t) interacting with your pages.
Real-time reports provide site owners and marketers with the best way to monitor this.
You can tell when the activity from a post, tweet, or Facebook status has taken a nose dive, meaning that it’s probably time to post another one.
You can even ask influencers to give your campaign a shoutout on another platform, like Instagram, to give your campaign a quick, natural boost when the activity takes a dip.
Another reason why real-time reports can be so helpful is that they can help you capitalize on what’s trending.
You might need to react to something that isn’t part of a planned campaign, like huge breaking news in your industry. And you probably need to react to it right away as the news is unfolding.
Checking up on real-time reports can help you gauge when this is happening and how you can spotlight related articles on your front page or write a quick update on the situation.
If your article happens to go viral, you can monitor where traffic is coming in from as it happens in front of your eyes and plan on how to use the attention for all its worth.
When you know that people are searching for your brand right now, you can do some on-the-spot content promotion.
For instance, if people are reaching your site from Facebook, you can update your page or create a sponsored status to push even more people over.
Filters in Google Analytics can be helpful and powerful if you use them correctly.
That’s why you should set them up in a test view before officially using them.
Once you turn a filter on, head to the real-time reporting section of Google Analytics to monitor how the filter is affecting your data and your site.
This method is perfect if you want to quickly test an advanced filter to find out if it’s worth using.
You can also use real-time reports to troubleshoot UTM tracking.
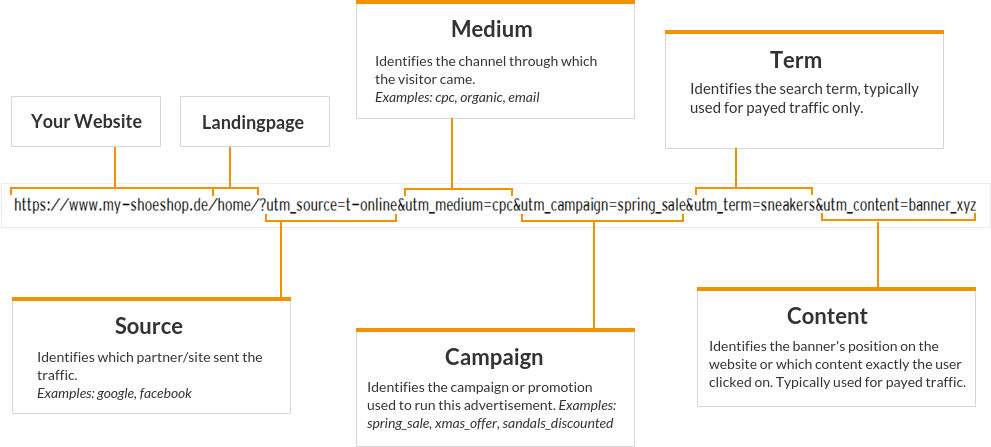
UTM parameters are the tags you add to a URL.
Then, once your site is clicked, tags are tracked and sent back to Google Analytics.
These parameters are the heart of Google’s tracking system. However, a ton of things could ruin your UTM campaign tracking, like redirects.
One good way to debug tracking issues is to monitor UTM tracking parameters in your real-time reports.
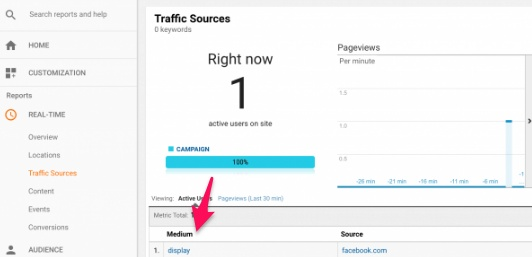
Look at the traffic sources report to see if test values that you passed are being picked up and reported correctly in Google Analytics.
If the parameters are correct, the source should show up under custom campaign parameters.
There are some limitations of real-time reports to be aware of, though.
Limitations of real-time reports
Real-time reports are great for quick monitoring or debugging.
However, there are a few limitations of these live reports that you should watch out for if you want to get the most out of Google Analytics.
For starters, the effect of filters might not be directly visible in real-time reports. That’s why Google recommends using an unfiltered view.
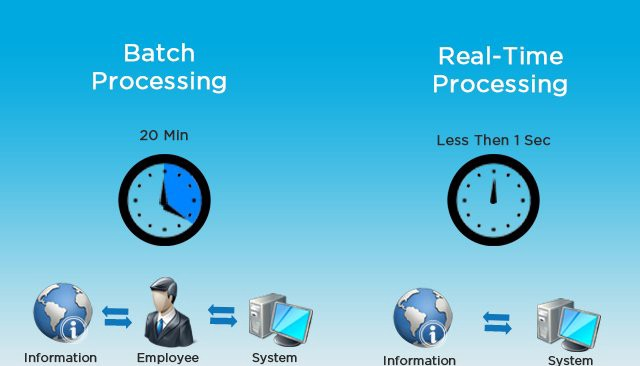
You might also experience brief delays in real-time app reports due to something called batched hit processing.
This refers to when the processing occurs on blocks of data that have already been stored for a period of time, which can take much longer than real-time processing.
That’s why you should never use real-time reports as a way to measure data exactly on the nose. Instead, view them as a rough analysis, even though they’re practically live.
Mobile app tracking with real-time reports may be delayed, as well, since mobile hits are batched to conserve battery life.
When you’re analyzing referral counts in real-time reports, you might also notice a direct referral instead of a specific campaign referral where there should be one.
That’s because traffic and conversions aren’t correctly correlated to the right source in real-time reports.
However, they’re correctly shown in standard reports. This typically happens when site users return to a site directly after originally getting there from a campaign source.
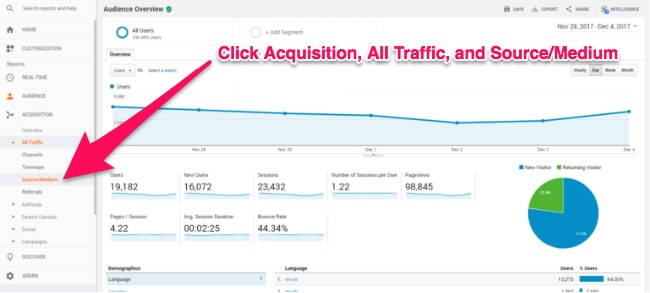
If you think something seems off about your traffic sources, click out of the real-time traffic sources report and head to the standard traffic sources report found under “Acquisition.”
Google is aware of this issue and plans to solve it in a future update.
If there isn’t any data in your Real-Time reports, there’s a possibility that there aren’t any current active users on your site.
However, real-time reporting can sometimes become temporarily suspended in views that you haven’t recently accessed, so this isn’t always the culprit.
Real-time views will become reactivated once you visit a real-time report in that particular view again.
Data collection and other reporting methods shouldn’t be affected in any way when this happens, but it’s something to be aware of.
Conclusion
Google Analytics can help you find out exactly what’s going on with your website when it comes to traffic sources, engagement levels, and overall campaign success.
But if you’ve never used it before, it can be a bit overwhelming.
There are two main categories of Google Analytics reports: standard reports and custom reports.
Real-time reports, which are a kind of standard report, can help you drive live sales and view data in real-time, as your visitors are taking action.
That way, you can take action now instead of having to wait for an accumulated set of data that was recorded over a period of time.
There are several different kinds of real-time reports, including the overview report, events report, traffic sources report, content report, locations report, and conversions report.
The overview report gives you a full overview of everything happening on your site.
You can view everything from top active pages to top referrals and the total active number of site visitors, here.
The events report shows all of the events currently taking place on your site in one central location.
The traffic sources report shows you where all of your live website traffic is coming in from.
Is it organic? Direct? Search?
You’ll be able to find that information.
With the content/screens reports, you can view the particular pages that your website visitors are currently using.
In the locations report, you can see live, detailed insights about which locations your visitors are accessing your website from.
You can also track how site visitors are moving through your funnel with the conversions report.
Real-time reports can be used in your campaigns for a number of reasons, like monitoring a social campaign or checking UTM parameters.
But keep in mind the limitations of real-time reports. For example, filters might not always be directly visible.
Which Google Analytics real-time report are you going to run first?





Comments (11)