Marketers have a new tool available to them with the release of Pinterest’s Analytics Tool for Businesses. Late last year, Pinterest began rolling out new business tools for companies using the social media platform, and Pinterest Analytics is the next logical step to help marketers use the medium successfully.
Many brands and companies have taken to Pinterest to promote products and share content. Rather than tell customers about your product, Pinterest makes it possible to show what you have to offer. And the online scrapbooking site allows your customers to share your content that they find interesting as well.
This is where the new Analytics feature comes in. Now you can track, in any given period, what content your customers are engaging with the most. What content resonates with your audience? What is driving traffic to your website?
The new tool offers several useful pieces of information for business users to track. Here’s an overview of the new tool and its unique features:
How to Access Pinterest Analytics
In order to gain access to Pinterest Analytics, users first must have a business account with Pinterest. You can sign up for a business account or convert an existing account. Make sure you’ve switched to Pinterest’s new look. Also, business accounts must have a verified website listed, allowing Pinterest to track traffic between the two sites. Accounts that have recently verified their website will not see any analytics data for a few days, while Pinterest begins collecting that information.
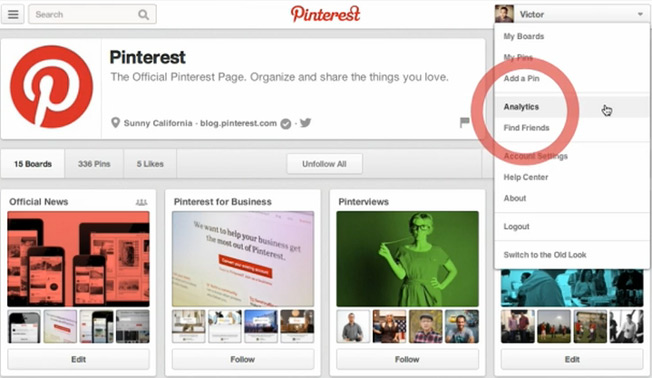
You can see your unique data by clicking on the main menu under your account name and selecting “Analytics” from the list.
Site Metrics
Pinterest Analytics will open up to the Site Metrics tab, which allows you to track the following:
- What pieces of content are being pinned directly from your website
- Unique visitors pinning content directly from your website
- Which of your pins on Pinterest are being repinned
- Unique visitors who are repinning your pins
- How many times your pins appear in search results across multiple platforms, including the desktop site, iOS, or Android
- How many unique visitors saw your pins on given dates
- How many users visited your website directly from Pinterest
- How many times users click on your website
- Whether your statistics are increasing or decreasing between periods
Understanding Your Data
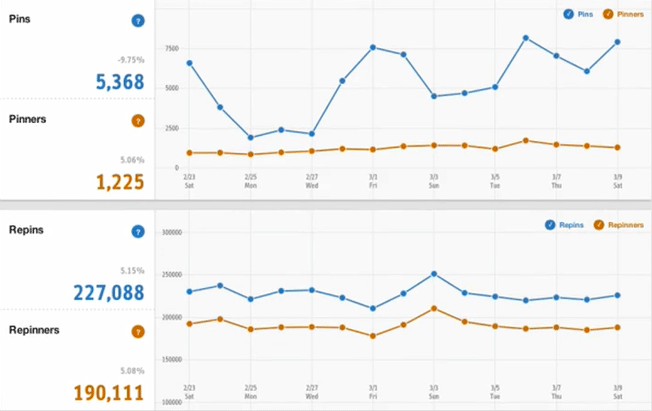
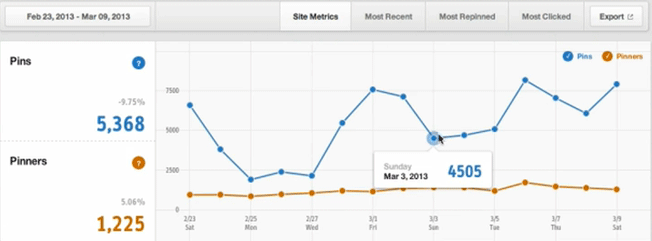
See how many pins and repins your site receives and how many unique visitors are pinning and repinning for a given period of time.
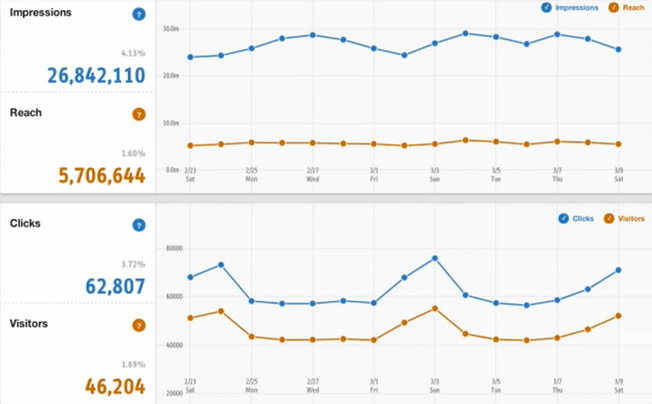
See the impressions and reach your pins are making, and track how many visitors access your site and click on your pins. Statistics on the left give you a total for the selected time period and a percentage indicating the increase or decrease from the previous period.
Fine-tuning Your Data
Clicking on a piece of information allows you to turn off that data and view specific data by itself.
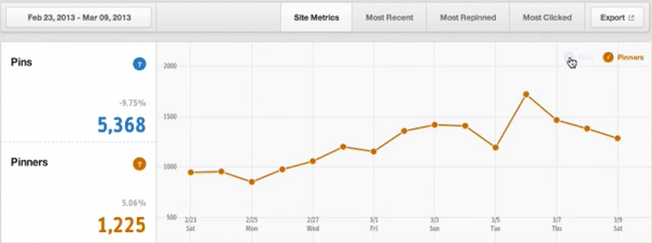
Click on the date range in the top left to customize your view. Compare data for any specific period. Any data can be exported to a CSV file by clicking the Export button on the top right.
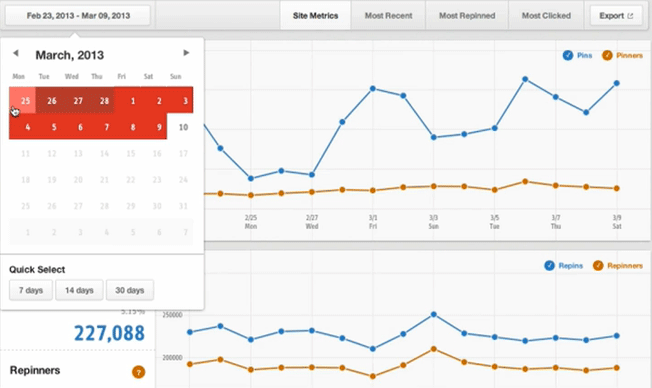
Hover over any point on the graph for a specific date to see the total number of pins on that day.
Similar to using Google Analytics to track links, search terms, and page visits for your website, you now can use Pinterest to see how successful your social media endeavors have been. This new tool helps you answer the following questions:
- What content is resonating with customers?
- How are customers engaging with your website and your pins?
Tracking Pinterest’s analytics will allow digital marketers to analyze their most engaging and effective content, both on their website and on Pinterest. Initial data returned will help marketers decide if Pinterest is an appropriate social media channel for their content, and how to use it effectively. This data, in turn, will help inform future content decisions that can continue driving traffic and encouraging sales. The data collected from Pinterest can be exported as a CSV file, allowing for easy reporting and future reference.
Most Recent, Most Repinned, and Most Clicked Tabs
Have you ever wondered:
- How popular your pins are among users?
- Which pins do users engage with the most?
- Which pins are less effective?
- How can you effectively tailor your Pinterest campaign to reach the appropriate market?
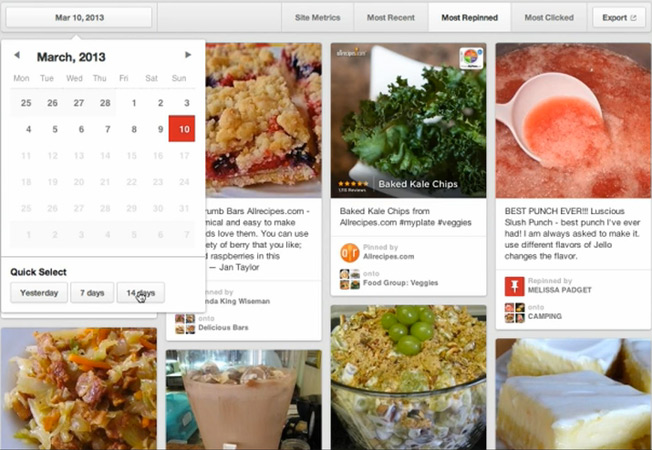
The Most Recent, Most Repinned, and Most Clicked tabs are for pages that look like standard Pinterest Boards, showing your most popular pins with users. Click on the date to view the most popular pins for a given date, or use the quick select to look at a recent period.
Now, rather than making informed guesses about the success of pinning content on Pinterest, marketers can track the numbers.
How an E-Commerce Business Can Benefit from This Tool?
Let’s say you run a clothing shop. You have boards full of fun fashions and styling tips for your customers. You pin your latest sales, the newest styles, and everything links directly to the sale page for that item. You’ve seen an increase in sales for items you pin to Pinterest, but you’re not sure if there’s a direct correlation. You may have questions like:
- Are your efforts on Pinterest driving traffic to your site and boosting sales?
- Is there any other product on your site that users are pinning that you should be pinning, too?
Using Pinterest Analytics, you can answer each of these questions.
How Can I Improve Online Sales Using Pinterest Data?
Pinterest’s Most Repinned content tab will tell you exactly what content is most popular over a given time period, and the Most Clicked content tab will show you which pins are driving the most traffic directly to your site.
Both of these metrics can influence what content is shown on the company website. Marketers can make changes to their site in real time to put their most popular content in front of their target market. This insight into your most popular pins makes it easy to measure interest in particular products or categories. The information can be vital when deciding which products to feature in placements, such as on the homepage, in display ads, social media updates, newsletters, and custom landing pages.
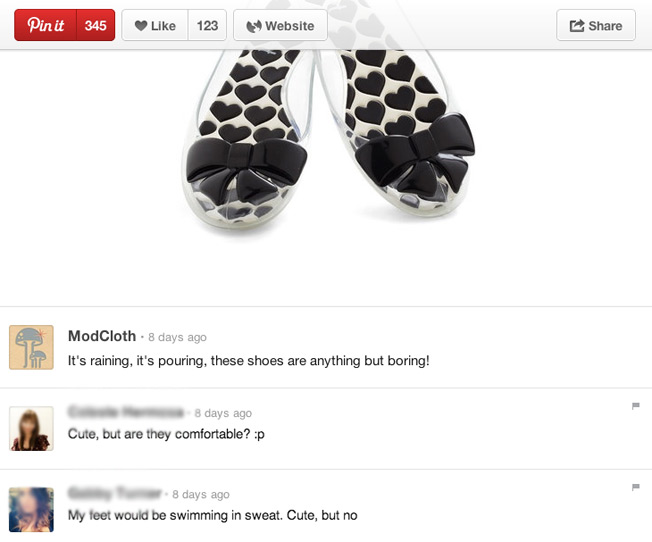
Unlike Google Analytics, the comments section on Pinterest can give you insight into customer opinion of your visual content. You have a chance to listen to what your customers like, don’t like, and wish they could see improved. Online clothing retailer ModCloth shares its new products and encourages feedback from customers.
About the Author: Sarah Wise is a marketing executive for Fast Web Media’s BIGprofile service. BIGprofile is a comprehensive digital marketing programme designed to help B2B businesses manage all their digital marketing activity.
Comments (8)