Churn prediction is one of the most popular Big Data use cases in business. It consists of detecting customers who are likely to cancel a subscription to a service.
Although originally a telcom giant thing, this concerns businesses of all sizes, including startups. Now, thanks to prediction services and APIs, predictive analytics are no longer exclusive to big players that can afford to hire teams of data scientists.
As an example of how to use churn prediction to improve your business, let’s consider businesses that sell subscriptions. This can be telecom companies, SaaS companies, and any other company that sells a service for a monthly fee.
There are three possible strategies those businesses can use to generate more revenue: acquire more customers, upsell existing customers, or increase customer retention. All the efforts made as part of one of the strategies have a cost, and what we’re ultimately interested in is the return on investment: the ratio between the extra revenue that results from these efforts and their cost.
As we saw in a previous post, there are a number of things you can do to improve customer retention overall. But individualized customer retention is difficult because businesses usually have a lot of customers and cannot afford to spend much time on one. The costs would be too high and would outweigh the extra revenue. However, if you could predict in advance which customers are at risk of leaving, you could reduce customer retention efforts by directing them solely toward such customers.
Churn Prediction for All in 3 Steps
Churn prediction consists of detecting which customers are likely to cancel a subscription to a service based on how they use the service. We want to predict the answer to the following question, asked for each current customer: “Is this customer going to leave us within the next X months?” There are only two possible answers, yes or no, and it is what we call a binary classification task. Here, the input of the task is a customer and the output is the answer to the question (yes or no).
Being able to predict churn based on customer data has proven extremely valuable to big telecom companies. Now, thanks to prediction services such as BigML, it’s accessible to businesses of all sizes. In this post, we’re going to see step by step how to predict churn. The process is as follows:
- Gather historical customer data that you save to a CSV file.
- Upload that data to a prediction service that automatically creates a “predictive model.”
- Use the model on each current customer to predict whether they are at risk of leaving.
Step 1: Gather Data
Churn prediction is based on machine learning, which is a term for artificial intelligence techniques where “intelligence” is built by referring to examples. When predicting whether a customer is going to leave within X months, he or she is compared with examples of customers who stayed or left within X months.
Feature Engineering
To make these comparisons, we need a way to represent customers based on information about them that impacted whether they churned or not.
Feature Types
Each piece of information we use to represent customers is called a “feature” and the activity of finding useful features is called “feature engineering.” For churn, we would have 4 types of features:
- customer features: basic information about the customer (e.g., age, income, house value, college education)
- support features: characterizations of the customer’s interactions with customer support (e.g., number of interactions, topics of questions asked, satisfaction ratings)
- usage features: characterizations of the customer’s usage of the service
- contextual features: any other contextual information we have about the customer
Feature engineering really is where churn prediction changes from one business to the other. You’ll note that of the features listed above, customer and support are quite generic, whereas usage and contextual are specific to the service you’re selling. Also, the more features, the better. Don’t fret if you’re not sure whether a particular feature is useful. If it isn’t, it will be easily discarded when creating the model.
Examples
For a telecom company looking to predict churn, the features could be:
- usage: average call duration, number of calls made, overcharges, leftover minutes
- contextual: handset type and value
For a SaaS company, we would be concerned with features such as:
- usage: number of times user logged in, time spent on app, time since last login, actions performed on app
- contextual: device type and user agent
Time Frames
In a company that sells monthly plans, we typically would be looking at who’s at risk of cancelling now (X=1), based on last month’s usage. This means that we would be computing usage feature values based on the previous month only. Alternatively, it may make more sense in your particular case to look at usage over 2 or 3 previous months in order to capture information that has an impact on whether a customer churns or not. In that case, we would average usage feature values over this duration.
In a SaaS company I founded that sells yearly subscriptions, we do things slightly different. We predict churn 6 months ahead (X=6), and we take into account usage during the previous year and during the first 6 months of the current year.
Extract Data
Once we have decided on a way to represent customers, we should gather historical data of up to X months in the past. Our aim is to create a dataset of examples that consist of “inputs” (customers) and associated “outputs” (yes or no; i.e., churn or no-churn).
For this, you have to create a script that: 1) connects to your database in order to extract the information required to compute feature values for each customer, and 2) dumps these values to a CSV file where each row is associated to a customer and each column to a feature (except the last column which is used for the output). The resulting CSV file contains the dataset, a.k.a. the “data.” It would look something like this:
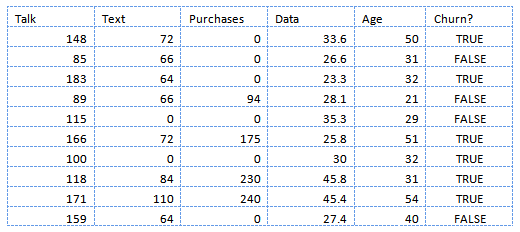
Snapshots in the Past
It is extremely important to understand that each customer in the data is represented as a “snapshot” of him taken X months ago, so that we could associate this snapshot with the fact that X months later (now) he churned or not (i.e., we associate the input with an output). As a consequence, we have to be very careful not to take into account any information about the customer that became available during the last X months (including his usage of the service) when computing the feature values.
Step 2: Upload Data
Prediction Services
We can upload the CSV file to a prediction service such as BigML or Google Cloud ML Engine through a web interface or through an API. The service will automatically create a model that it will use to make predictions. The beautiful thing about these prediction services / APIs is that they abstract away the complexities of creating predictive models from data, thus making machine learning / predictive analytics / data science accessible to the masses.
Datasets
If you’re interested in having a go at churn prediction without the hassle of extracting data first, you can use this Orange churn data. It’s been “anonymized,” meaning that you can’t identify the customers and features, but it is actual data collected by the telecom company Orange. There are 50,000 data points (i.e., customers), 230 features, and the CSV weighs 8.6MB when zipped.
In the rest of this article, we will use churn data provided by BigML that has not been anonymized. There are 3,333 data points, 19 features, and the CSV weighs 97KB when zipped. Actually, we will use only 80% of the dataset, for a reason I’ll explain later.
Upload Data and Create a Model with BigML
I have chosen to illustrate the rest of this article with BigML, and I have listed the actions to perform on their web interface so you can replicate them. Once you’ve been through the whole procedure, I recommend that you also try other services.
- Create a free BigML account.
- Drag-and-drop the CSV file (that you extracted from your own database or that you downloaded above) to the BigML dashboard. This creates a new “source.” BigML makes a distinction between a data source and a dataset, but in our case they can be thought of as being more or less the same thing. Alternatively, you can create the source by linking to the file I’m hosting on Amazon S3, the URL of which is “https://bml-data.s3.amazonaws.com/churn-bigml-80.csv.”
- Click on the source you created. This takes you to the source pane of the dashboard.
- Create a dataset by clicking the cloud-lightning icon in the top right corner and choosing “1-click dataset.” This takes you to the dataset pane where you can visualize the data as histograms. This is really useful for making sure the data is as you would expect and checking for potential bugs in the data extraction process. What you see should look like this:
- Create a predictive model by clicking the cloud-lightning icon and choosing “1-click model.” This takes you to the model pane.

Decision Trees
BigML creates decision tree models from the data. When you get to the model pane, you should see your churn model as something that looks like this:
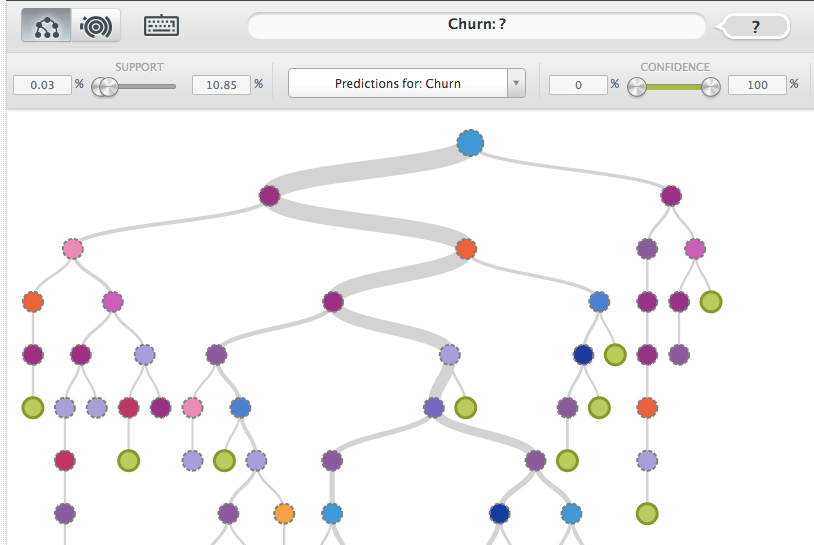
A decision tree represents a model where each node is associated with a question on a feature value, with a certain number of possible answers represented by branches, and where leaves are associated with output values. The first question is located at the root node. Choosing an answer takes you to a branch of the tree and to a next node. The process is repeated until a leaf is reached, where you get the associated output value as a prediction.
If you “browse” decision trees on BigML, you’ll notice that you can also get predictions at non-leaf nodes by hovering your mouse over them, and you also get confidence levels (in %) associated to these predictions.
Step 3: Make Predictions
Now that we have a model, we want to use it to make predictions on all customers and see who’s at risk of churning. In the same way we used a script to get a CSV file of snapshots of customers taken X months ago in Step 2 above, we need to create a CSV file of snapshots of customers taken now.
This time, the churn information does not reside in the database. The idea is to use BigML to expand this CSV file with two new columns: a “churn” column containing the churn predictions for all the customers, and a “confidence” column containing the confidence levels for all the predictions:
- Upload the newly created CSV file to BigML and create a new dataset. If you’re following this tutorial with the BigML churn data, now is the time to get the remaining 20% and to use it (note: the 80-20 split was arbitrary).
- Go back to the model, click on the cloud-lightning icon and choose “Batch Prediction.”
- In the new view that appears, choose the model in the left-hand drop-down menu and choose the new dataset in the right-hand menu. Expand the “Configure” section by clicking on it, then expand the “Output settings” section, choose the separator for the output CSV file (default is comma), and click on the 3 buttons to the right to activate the corresponding options (“Add a first row as header,” “Include all fields values,” “Add confidence”).
- Validate by clicking on the “Predict” green button on the bottom right of the page. You then get to a new page with the output CSV displayed in a text field and you can download it by clicking on “Download Batch Prediction.”
- On your computer, open the downloaded CSV file in a spreadsheet program such as Excel. Filter the churn column to keep only the “True” values. Then, sort the confidence column in descending order. This way, you see at the top of the spreadsheet which customers are predicted to be most likely to churn.
It Doesn’t Have To Be Fancier
Here’s a fun story about BigML and churn prediction. David Gerster was leading the mobile data science team at Groupon when he discovered BigML and used it to predict churn. He was so impressed with BigML that he joined the company as VP of Data Science! The takeaway message for us is that you don’t need more than a service like BigML to do churn prediction and to start exploiting the value of your business’s data!
About the Author: Louis Dorard is the author of Bootstrapping Machine Learning, the first guide to prediction APIs. He is also a data consultant and helps companies exploit the value of their data. You can follow him on Twitter @louisdorard.
Comments (27)