
Have you ever looked at your analytics dashboard and felt that something was missing?
Of course, all the traffic numbers, their sources, landing pages, session duration — that’s all reported. But, there’s something that Google Analytics doesn’t report…. It’s READER ENGAGEMENT AND LOYALTY.
Sadly, Google Analytics doesn’t come with any intuitive, out-of-the-box engagement or loyalty tracking.
You’ve got to look really hard to find indicators showing these values. While metrics like the bounce rate, session duration, rate or return visitors can help, they don’t show the full picture of user engagement.
There’s a reason that a definitive “engagement” metric is not present in your dashboard. Avinash Kaushik, author of Web Analytics: An Hour A Day, explains why a concept like engagement can’t be hardcoded. He says –
The reason engagement has not caught on like wild fire (except in white papers and analyst reports and pundit posts) is that it is a “heart” metric we are trying to measure with “head” data, and engagement is such a utterly unique feeling for each website that it will almost always have a unique definition for each and every website.
At the core of Avinash’s argument is the fact that a site’s engagement metric is too unique to be applied as a standard across all sites.
Which is quite true.
After all, a publisher site is different from an eCommerce site, and an aggregator site is different from a reviews portal.
Thanks to the different nature of the sites, a lot of “engagement and loyalty” evaluation is left to the analyst’s interpretation, based on the underlying site type and its objectives.
While Google Analytics misses the big picture, it does give you some stats that indicate how engaged and loyal your active user readership is. Let’s look at the different engagement and loyalty metrics in Google Analytics and how you can interpret them to improve your conversion rate.
Like I said above, a lot of user engagement is left to the analyst’s interpretation and is subjective to the site under consideration. However, to measure your site’s engagement, it will help to understand the following metrics such as bounce rate, average time on landing page and event tracking or traffic source.
Understanding bounce rate
The bounce rate shows the number of people who leave the site from the same page they landed on.
A high bounce rate on a blog could mean that the reader didn’t like what they saw.
But, the same bounce rate in an online store may not be too bad, because it could mean that a visitor landed on the item they intended to buy and clicked through to the checkout. Or, it could simply mean that a visitor came looking for some information, found it and left.
That’s not exactly a bad bounce rate, but you don’t want it to hurt you.
Here’s how the average bounce rates for different industries look:
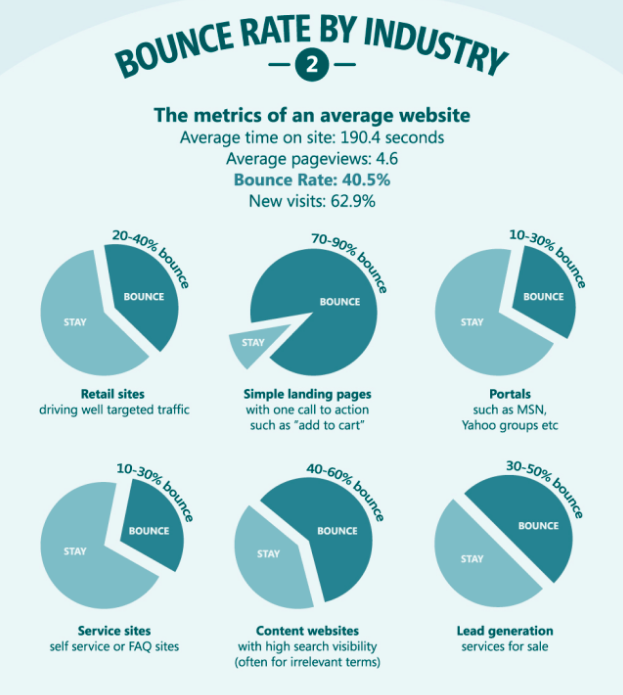
If you find that your site has an unreasonably high bounce rate for its type, fix it.
Demystifying session duration
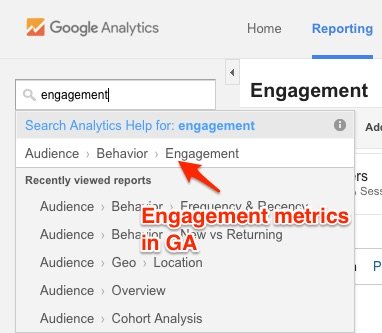
The session duration is the session length, in seconds. Go to Audience> Behavior > Engagement to find the Session Duration metric.
Theoretically, the more time that your readers stay on your site, the happier they are with your site’s content whether blog post, ecommerce or other. So, the longer the sessions, the higher the engagement.
That’s why blogs that publish long posts like mine should ideally see long sessions. If most sessions are found to be just 60-sec sessions, it could mean that the readers aren’t really reading what’s offered, because it’s not possible to read a 2000-word post in 60 seconds.
But, the same theory will not hold for a subdomain on a site that’s dedicated to FAQs. In fact, a low session length could be a good thing because it may be that readers might be coming and looking for help instructions, finding them, debugging their issues and leaving quickly.
In most cases, a longer session would ideally translate to more page views from an active user.
Determine what the session duration means for your site and then estimate your reader engagement level based on that value.
Identifying site issues with page depth
Page depth is a count of the pages that a visitor visits on your site beyond the page they landed on. It’s basically just the page views/session.
A high page depth figure would generally be an indicator of content that engages a reader and motivates the reader to further explore the site. Do they go from the first blog post to another and then another?
However, if you see that most of your site visitors visit just 1-2 pages on your site, you might want to find the reason behind their behavior. It might not be a lack of user engagement or desire by your active user base.
You should start by reviewing your site’s design and navigation, because a poor navigation experience could mean low page depth values.
Another thing that you could look at is internal linking. Low page depth could also be a result of poor internal linking. See if adding internal links improves your page depth metric.
You could also use this data to find the highly-visited pages on your site and optimize them for higher conversions, based on your site’s goals.
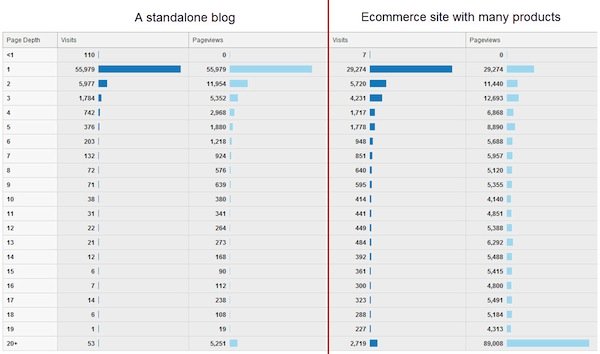
The following chart shows the page depth of a blog versus an eCommerce site. As expected, the page depth values are high for the eCommerce site (because there you have people browsing through lots of products).
The eCommerce site has many visits with more than 20 page depth!
Using the “new vs returning” metric to analyze user interactions
The new vs. returning metric helps you understand how your new and returning visitors interact with your site.
Chitika’s ad network, spanning across millions of people, found that the online ad CTR exhibited by new visitors is 24% higher than it is for return visitors across Chitika’s aggregate network traffic. And, 78% of the impressions were caused by the returning visitors.

There really is a difference between how new and returning visitors engage with your site. And, there are many ways that you could use this user engagement metric.
For example, if you show ads for revenue, after seeing how your readers engage with your site, you might want to draw new traffic to increase clicks. In the case of an impression-based revenue scheme, you might want to focus on building your email list and thus improve your returning visitor metric.
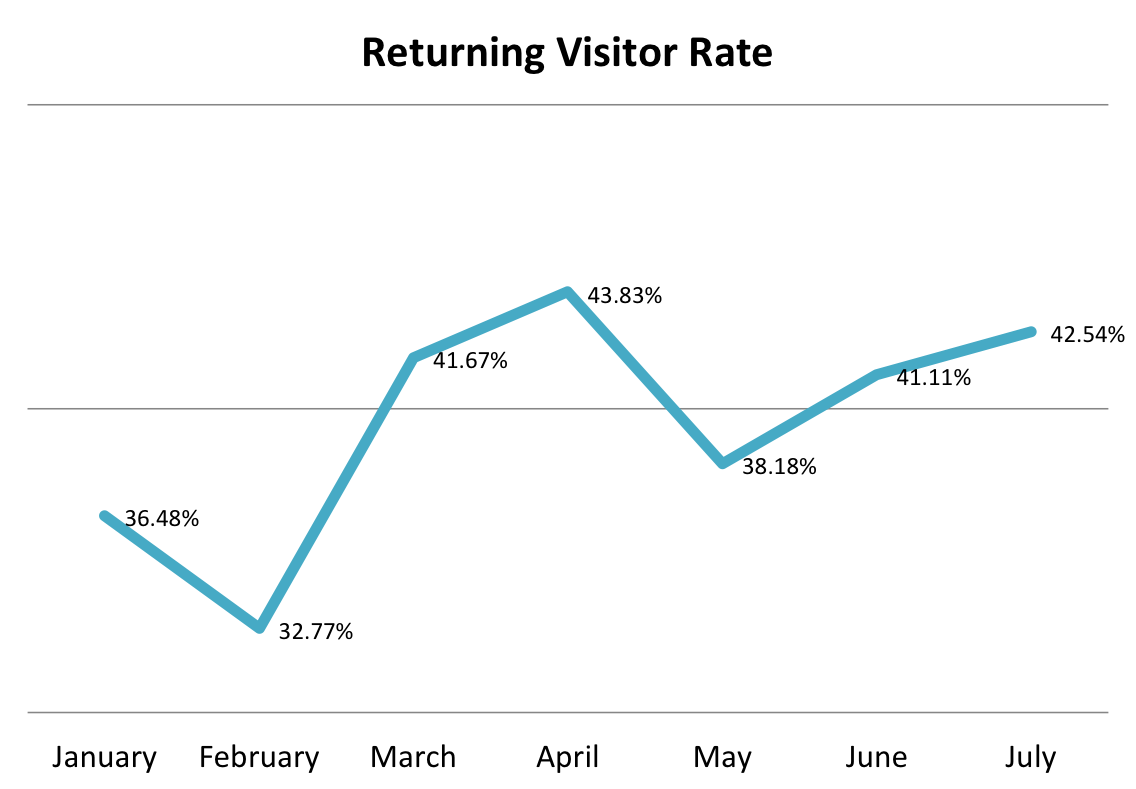
A word about RVR (returning visitor rate)
RVR is the rate of return visitors to your site. A higher RVR shows that you’re good at bringing return visitors to your site.
Contently gives an easy formula to calculate the RVR metric:
“To calculate RVR, you just have to divide the number of return visitors to your website by the number of total unique visitors for a given period of time. In July, if you had 10,000 total visitors and 3,000 were repeat visitors, your RVR is 30 percent (3000/10,000 = .30).”
Contently’s RVR is 40% (driven mainly by their blog). An RVR above 30 suggests that your content is engaging.
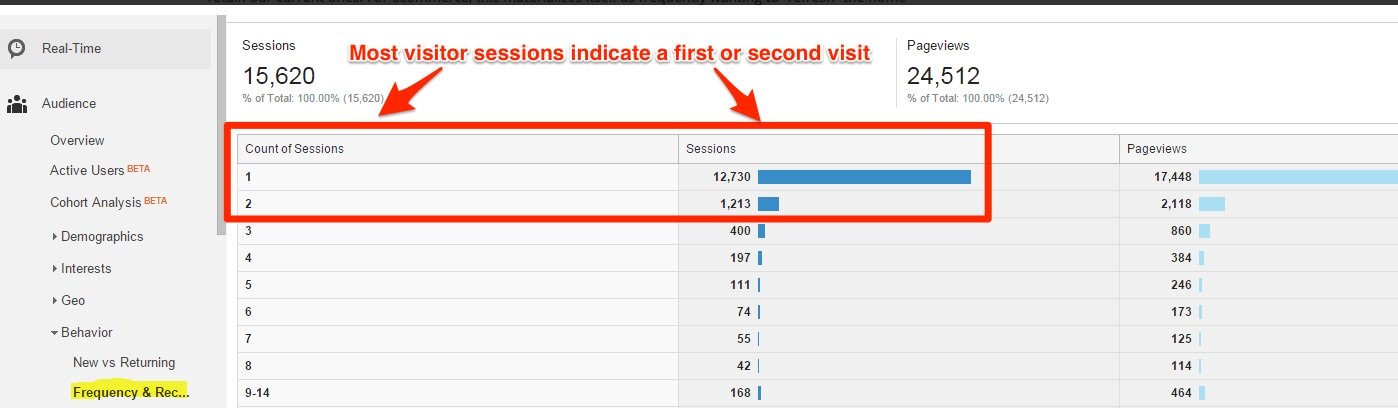
Interpreting the frequency & recency (the count of sessions and the days since last session respectively) metric
The frequency metric shows the session number on which your users are. Therefore, returning users will have higher session numbers. Following the same logic, all new visitors will be on their first session.
The recency metric, on the other hand, shows the number of days between the user sessions.
David Campanella, from CrossView, uses his frequency metric to
… compare different seasons to gauge the change in visitor frequency. This can shed insight into what seasons your loyal customers coming to the site and when does the site perform at acquiring new ones.
In the following screenshot, most visitors are in their first or second session, as indicated by their session count.
Measuring engagement levels with the average pages/time on site metric
The average pages or time on site metric gives a broad idea of your audience’s engagement level. They can mean different things in different contexts.
A high average time on a site with low page views, like NeilPatel.com, would be a good indicator, because it would mean that people are reading and consuming the content on the site. However, the same may not be great for a publisher site that needs more page views to make more ad revenue. They won’t necessarily aim for a high average time.
As the average pages/time on site are subjective metrics, spend some time to analyze what you need your visitors to do. This is a different type of bounce rate concern based on industry metrics and goals.
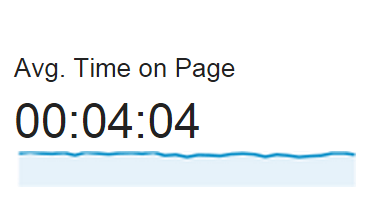
If you realize that you want to improve your average time on page metric, you might want to follow Brian Dean’s trick of using bucket brigades. Brian uses this writing technique to maintain a consistently high avg. time on page metric.
You can find many other actionable tips to improve your session duration in this blog post.
Using segments to detect patterns
By default, all of the engagement metrics will show data across all of your site traffic. However, to draw even better insights from the basic user engagement metrics, you can use segmentation.
Segmenting engagement statistics helps you to identify patterns in a particular reader/buyer segment.
For example, if you apply the new users segment to your page depth engagement field, you might find that new users show very low page depth values and that might lead to the discovery of navigation problems on your site.
Advanced content engagement tracking with events
If you’re worried about how many people actually read your blog post, you might want to check out Justin Cutroni’s script for measuring content engagement.
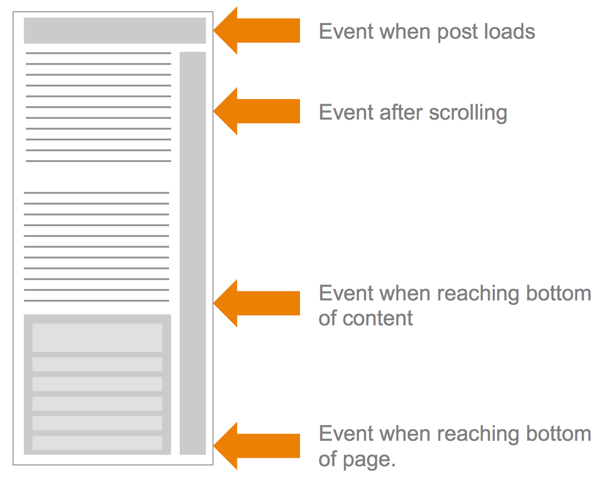
Justin (an Analytics Advocate at Google) created this script to help site owners measure content engagement using the scroll function. His script measures a reader’s engagement level by seeing how far they’ve scrolled on the site.
This script can be used to know:
- How many people scroll
- When a person starts to scroll
- When a person reaches the end of an article (not the end of the page, but the end of the article or post area)
- When a person reaches the bottom of the page (the bottom of the HTML)
- Which website visitors are scanning my articles and which are reading my articles (Visitors who spend less than 60 seconds to reach the bottom of the post get categorized as scanners while the others count as readers)
You can find all of the instructions to add this code to your Google Analytics script in the original blog post.
But, before you try this, you must know that this code could mess up your bounce rate and time on site metrics – the author says that you could see a decreased bounce rate and an increased time on site as a result of the script. Your traffic source will also affect this.
Mobile screens and multiple tabs could also cause fuzzy data.
I’m not sure if that’s what you’d prefer. However, if you’ve no idea if anyone’s ever reading your posts, give the code a try.
If this looks like a lot of work, you can use a tool, like CrazyEgg, that offers this functionality straight out of the box. In addition to scrollmaps, you’ll also be able to detect all of the clicks on your site without having to create events.
Conclusion
Before measuring your reader engagement and loyalty, define the purpose of your site. Without a clear idea of what you expect your readers to do, you won’t track and measure the right metrics.
And, don’t obsess with tracking engagement, because it’s intangible. You’ll never get the right formula or metric combination for that.
All of the metrics that I discussed above will also just give you fragmented ideas for estimating your audience engagement levels and event tracking for digital campaigns.
That said, I’d still recommend that you keep an eye on them. They won’t just show you how your readers interact with your site. They’ll also help you uncover problems on your site.
What metrics do you use to decide if your content engages your readers?
Comments (28)