
Do you want to dramatically improve the results of your content marketing campaign?
Yes? Well, there’s just one change that you need to make: eliminate guesswork.
You know you can be wrong about so many things!
For example, your assumption about the best days for posting, the right call-to-action, the most effective tone and so on could hurt your conversion rate results.
The only way to find out what works best is to split test.
And you don’t have to spend a fortune. Making small tweaks to your content and posting schedule can deliver great conversion rate results. Here are a few content strategy multivariate testing ideas to get you started.
Posting schedule/frequency
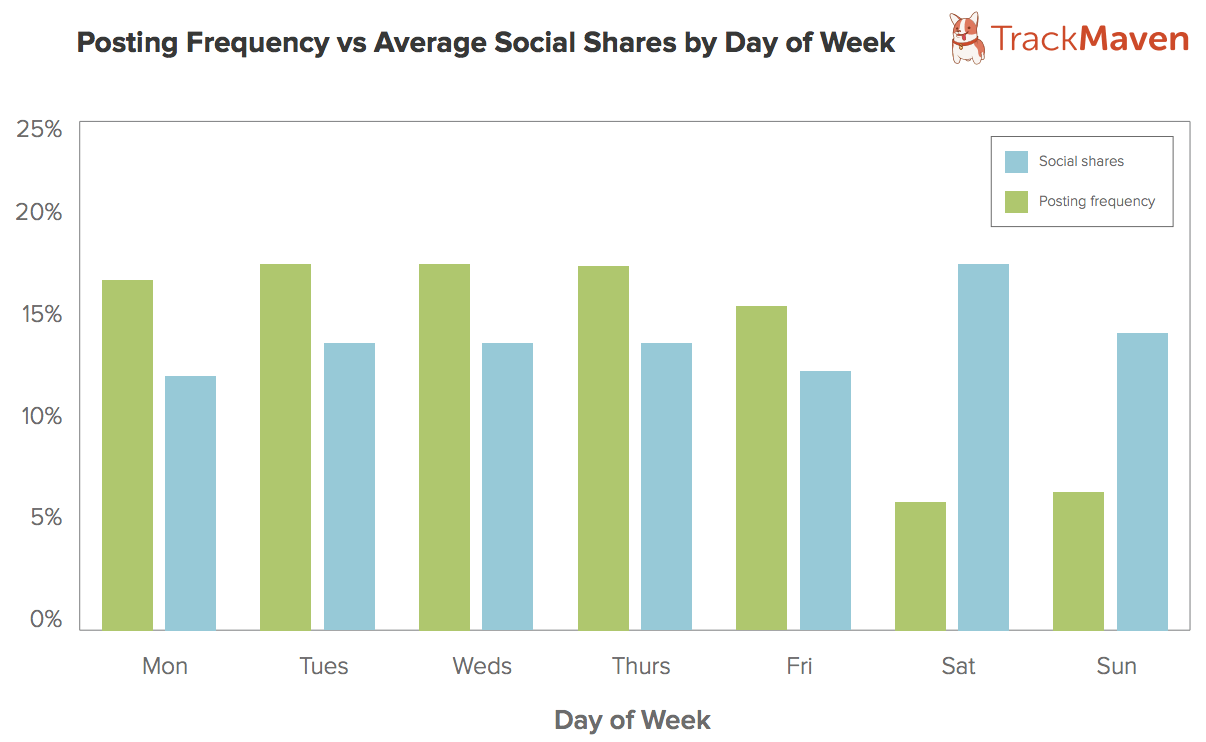
Most blogs prefer to publish their posts during weekdays.
However, if you look at the social media engagement around these blog posts, you’ll see that a lot of it happens over the weekend.
More than social media engagement, the real point that this research hints at is that a lot of content consumption happens over the weekend.
So, if you shun publishing on weekends altogether, don’t. You can only know when you try.
Buffer tested its publishing schedule and noticed that Fridays didn’t have to be no-posting days.
Because Buffer saw low traffic on Fridays, its publishing schedule included publishing new blog posts only from Mondays through Thursdays.
But, to split test their publishing schedule, they posted a guest post on a Friday.
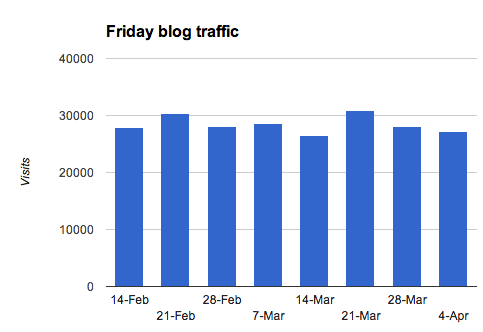
Kevan Lee, from Buffer, says,
On a typical Friday at the Buffer blog, we average 28,000 visits. On our multivariate test Friday, we had 30,796 visits—an 8 percent increase over our average.
Buffer projected that an additional 2,000 or 3,000 people might come to the site on Fridays to see the new content. However, they also concluded that content on Fridays got as much readership as their other blog posts on weekdays.
As you can see in Buffer’s case, split testing your publishing strategy could challenge some of your best assumptions about how people consume your content.
Another thing that you might want to try is publishing more content as part of your marketing campaign. Brands that create 15 blog posts per month average 1,200 new leads per month. If you currently publish a weekly post, try publishing bi-weekly. More blog posts might translate to more leads and higher engagement.
Some indicators for analyzing results:
- More traffic – At the most basic level, producing more content should get you more traffic. See if posting more frequently increases your site traffic.
- More signups – More content should ideally translate to more signups. Notice the impact of publishing more content on your average signups.
Content type
47% B2B marketers cite producing the right kind of content that engages as one of their top three content marketing campaign challenges.
The right kind of content is subjective and varies greatly, depending on your niche. But by looking at your business objectives, you will get a reasonable idea about the kinds of content that you might want to produce more of.
Before you start split testing different types of content, look at your business objectives. I’d love to rehash the advice that Rand Fishkin shared in his Whiteboard Friday series. He asks content marketers to be intentional about their content.
To do so, answer this question: What are you looking to get?
- Brand awareness
- Higher sales
- Better engagement
Brand awareness: If you’re looking to build awareness about your brand, you might want to try content that has the potential to go viral. This content doesn’t necessarily have to be about your product directly.
Higher sales: If you want to boost sales, you might want to create content such as customer success stories, case studies, or webinars. You could ask for emails to give access to this content and boost sales with the qualified leads that you collect in the process.
Better Engagement: If you’re seeking engagement, you should go for content that appeals to your existing customers. This content could be about enabling customers to do more with your product.
Evernote is great at this. If you look at their blog, you’ll see several blog posts that target existing Evernote users.
At a broad level, your business objectives will decide which types of content that you should experiment with. But, at a granular level, you can choose between different levels of depth in your content for meeting your different business objectives.
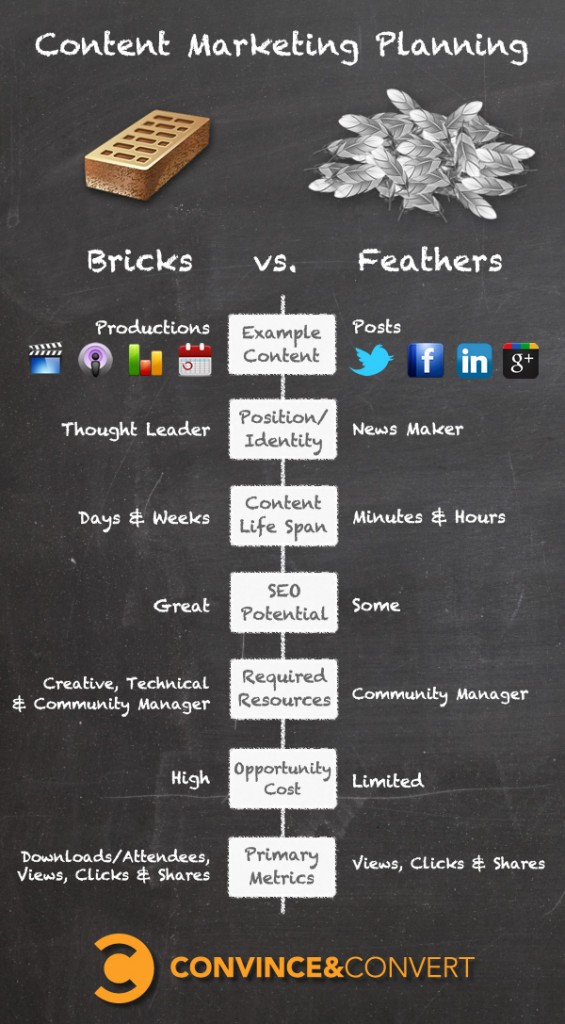
For example, you might want to create a mix of bulky content, like a guide, a long blog post, research reports, white papers, or a mobile series and also build some easy-to-produce content for your various social media channels.
The above content distribution is given by Jay Bear in his epic Bricks and Feathers concept.
To map the different content types with your specific business objectives, refer to this graphic from Convince&Convert:
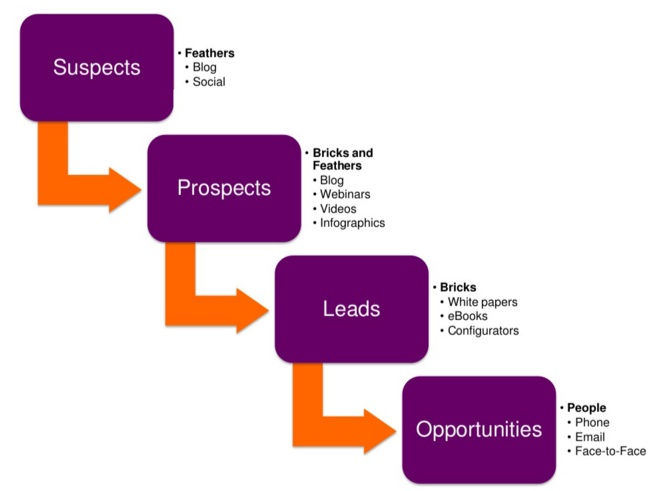
Depending on the stage of your customer’s buying journey, you can choose from the different types of content.
The very broad-level audience cares about feathers offering light snackable content while prospects show interest in detailed feathers and bricks, such as longer, more meaningful blog posts, webinars, and video content.
Leads respond well to bricks that offer very specific information, such as white papers, ebooks, and comparison tools.
Some indicators for analyzing results:
The indicators for content type tests would be increased awareness, leads, and engagement, because it’s these things that you try to optimize by multivariate testing the content type.
Increased awareness: This could be new visitors to your site sent via social media or fresh backlinks (A result of creating content with the potential to go viral).
More leads: When you create a content type like a webinar or a whitepaper, you should collect more leads and enjoy increased conversion rates.
Higher engagement: This could be returning visitors, people who keep coming back to your site regularly.
Headlines
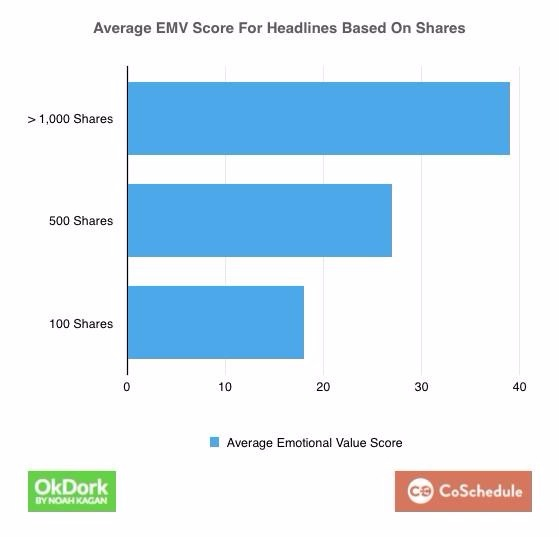
When CoSchedule analyzed 1 million headlines, they found that headlines that had a high emotional quotient got shared more.
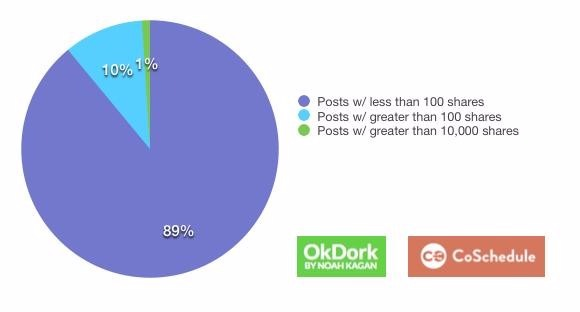
The same study shared that 89% of the content is never shared more than a 100 times. Moreover, just 1% of all content reaches the 1,000+ share mark.
By split testing your titles, you can get higher exposure for your content.
Imagine what it would mean for your business to move from the group with less than 100 shares to the one that gets 1,000+ shares. A/B testing your titles can impact your bottom line.
A good starting point for this aspect of your marketing campaign would be to begin with title templates that work. Then, work on improving their emotional content so that they appeal to your audience and get shared more.
CoSchedule’s headline analyzer tool and Advanced Marketing Institute’s Emotional Marketing Value Headline Analyzer are great tools to score your headlines.
After improving your title’s emotional appeal, you can focus on other elements, like it’s style and tone.
Blogs like BuzzFeed and Upworthy use elements like curiosity in their titles and so it’s common to see their content go viral. Buffer, on the other hand, writes long, descriptive titles and stays away from fear-based themes.
The length of your post title is another element that you might want to split test, as headlines with 6 words tend to do the best.
Some indicators for analyzing results:
Higher social media shares – More social shares are a sure sign that your readers found your headlines engaging. So, watch for social media shares when multivariate testing headlines.
Pageviews – If a particular type of headline produces more pageviews, it’s definitely working for your audience.
Email marketing – If you use your post’s title as your blog post update email’s subject line, then getting higher conversion rates for particular headlines will mean that those headlines resonated well with your readers.
Content length
Experimenting with your post length might yield surprising results. It might even improve your search engine rankings.
If you produce 800-word posts, try posting a couple blog posts in the 1,500-2,000-word range.
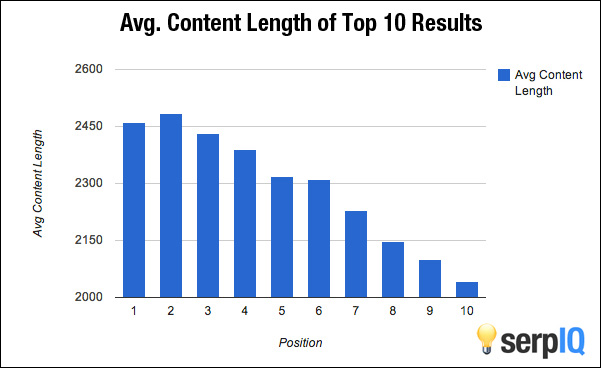
Research shows that posts that are about 2,000 words or so tend to secure higher search engine rankings.
Some indicators for analyzing results:
More backlinks – Since long posts get more backlinks, backlinks are a great measure of the long length working for you. If you see longer blog posts getting more backlinks (and thereby improving your SEO and driving traffic to your site), you can tell that it’s working for you.
Improved SERPs – Longer posts tend to get ranked better. If you see your longer blog posts rank better than your average shorter posts, it’s another sign that you should try more longform content.
Social shares – Long posts enjoy higher social engagement. So, yes, you can tell a long post works better for you if you see it bring more social shares.
Images
Meaningful images add a lot of depth to content. When used right, they can set the tone of the content. Nielsen reports that after headlines, online readers tend to look at the images and scan their captions.
If you don’t use image captions, try using them and measure how they impact your reader engagement.
Split testing images isn’t something you should restrict to just page copies. Extend it to your blog content and social media posts, too.
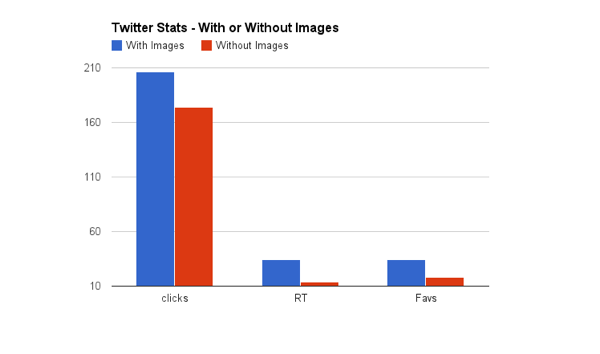
Social posts with images get more clicks, reshares, and upvotes.
When Buffer tested its social posts, it found that posts with images outperformed those without.
Experiment with different types of images: screenshots, charts, stock photos, and more. Image types can have a high impact on your reader engagement levels.
HubSpot shared that colored visuals increase people’s willingness to read a piece of content by 80%. So, colored images are another type of image that you might want to split test against whatever style of images that you use currently.
But, don’t use too many images in a post. I’ve found that too many images distract the readers rather than engaging them.
First, if you don’t use images in your marketing campaign or if you don’t use “enough” images, try using them.
Next, split test using relevant images against generic ones. Instead of using stock photography, try using charts, graphs, infographics, and screenshots. And, when you do, explain what you want your readers to see in them.
Estimating the impact of improved images is not so straightforward. The best that you can see is if using different kinds of images improves your users’ average session length. Social media shares could be another subtle indicator of a particular kind of image working better than the others.
CTAs
A conversion-friendly post always ends with a CTA. It could be anything: A simple CTA to share your post or to subscribe to your blog. Split testing CTAs will help you find what your readers respond best to.
When HubSpot tested a full-blown lead generation (first image) form against their standard CTA (second image), they found that the standard CTA outperformed the lead generation form. The view-to-submission rate for the form was 2.4%, while that of the standard CTA was 2.8%.
However, when Impact did the same experiment, but by replacing their standard CTA with a lead generation form, their conversion rates jumped by 71%.
If you use click-based tracking, i.e., tracking clicks on your CTA, you could use a heatmap tool, like Crazy Egg, to choose the winner. For other lead generation CTAs, you can simply compare the conversion rate, by looking at the number of form submissions in your CRM tool.
Conclusion
A/B tests produce the best and most decisive results, when you split test just one element at a time. Choose one of the above elements and test. Observe the results and keep testing the remaining elements one by one.
As I said in the beginning, guesswork is not good. Don’t be one of those content marketers who doesn’t know what content type works for them. Find out by multivariate testing. Next, find the optimal publishing schedules and writing styles.
A few simple tweaks can improve your content marketing ROI dramatically.
What elements of your content strategy do you test? And what are some of the most surprising results that you’ve ever got? Do share in the comments!
Comments (14)