“Wow, look at that traffic spike on January 15! Is that the day we announced the new product?”
“Conversions were really down the weekend of Feb. 22-23. Maybe that was when we were doing our website maintenance.”
“We received lots of submissions about properties in Oakville three weeks ago. That’s when we launched our print campaign, right? Or was that after the town ratified the tax abatement?”
The Danger of Now
When something is occurring, the chronology is clear: it’s happening now. “Now” steadily fades with the passing days, weeks, and months, quite harmlessly for most people.
For Web analysts, however, this kind of oblivion can be fatal. How can we begin to measure the impact of any circumstance on website (or mobile app) behavior if we can’t remember when it happened?
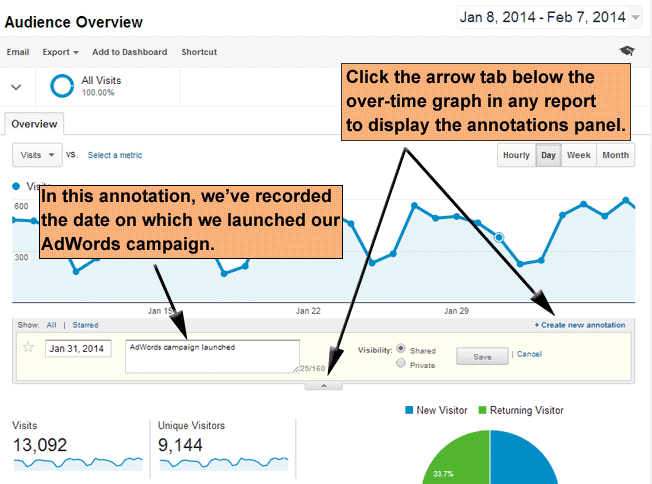
This fundamental principle of Web analytics is often overlooked. We can’t blame Google Analytics. As illustrated below, Google Analytics makes it very easy to annotate reports by date.
Occurrences to Record
You should annotate any occurrence that may positively or negatively influence activity on your website, such as:
- marketing campaigns
- website design and content changes
- website outages
- industry developments
- competitor activity
- general news
- weather
- any other time-specific factor that could affect website behavior
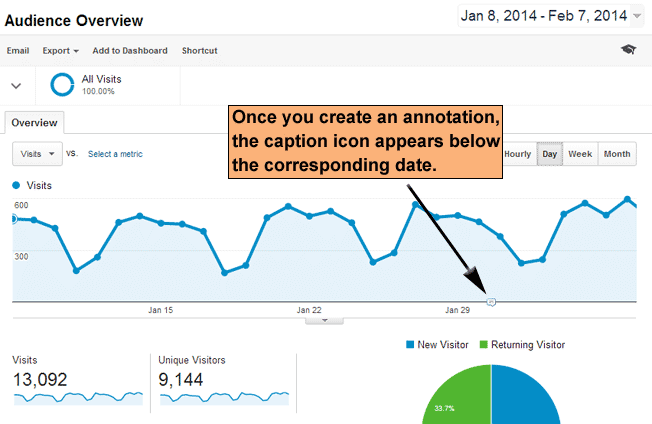
After you create an annotation, a small caption icon will appear below the corresponding date. You can click that icon (or the small arrow tab again) to display that annotation, as well as any others for the selected time period.
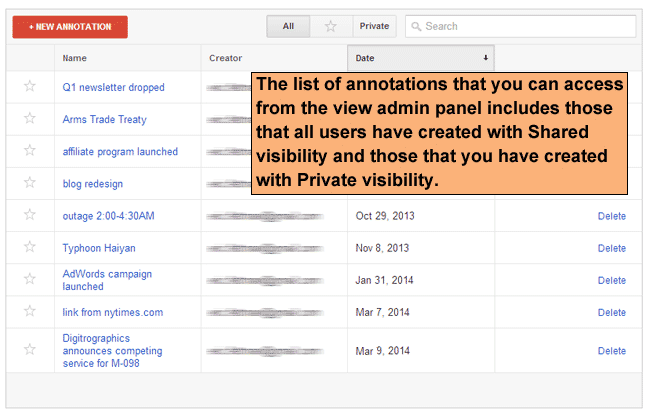
List All Annotations in Your Google Analytics View
To list all annotations, as shown below, you can click Annotations in the admin panel for your view.
Additional Points about Annotations
A few additional points about annotations to consider:
- To create annotations in a Google Analytics view, you need only basic Read & Analyze rights. So, anyone who can access a view can annotate it.
- The default visibility setting for annotations is Shared (as shown in the first screenshot above). If you don’t want anyone else to see an annotation you’re creating, select Private.
- Annotations are replicated among reports within the same view. For example, if you create an annotation in the Landing Pages report, the caption icon will appear in the All Referrals report.
- Annotations are not replicated among views. If you and your team work with multiple views for the same Google Analytics website or app property (which in many cases is a good practice), make sure you’re clear about which view will house all shared annotations.
Maintain an External Timeline
In addition to (or even instead of) creating your timeline directly within Google Analytics, you might want to record events in a separate spreadsheet so you can categorize, color code, or add one or more columns for status and follow-up notes. For example, you might want to note that two months after a modification to your website’s top navigation, you will check specifically for changes in pages/visit, goal conversion rates, and other relevant metrics.
The advantage of keeping the annotations within Google Analytics is that they’re in context. With the caption icons appearing directly in the reports, it may be easier to connect your data with the occurrences you have recorded.
Monitor Metrics Proactively
Annotations can help you retroactively make sense of your data. If, today, you notice there was a sharp increase in e-commerce transactions two months ago, you might be able to attribute that change to an annotation you made at the time.
However, you can take a more proactive approach to the annotation process by purposefully monitoring specific metrics that the annotated occurrences may affect. The table below lists several examples.
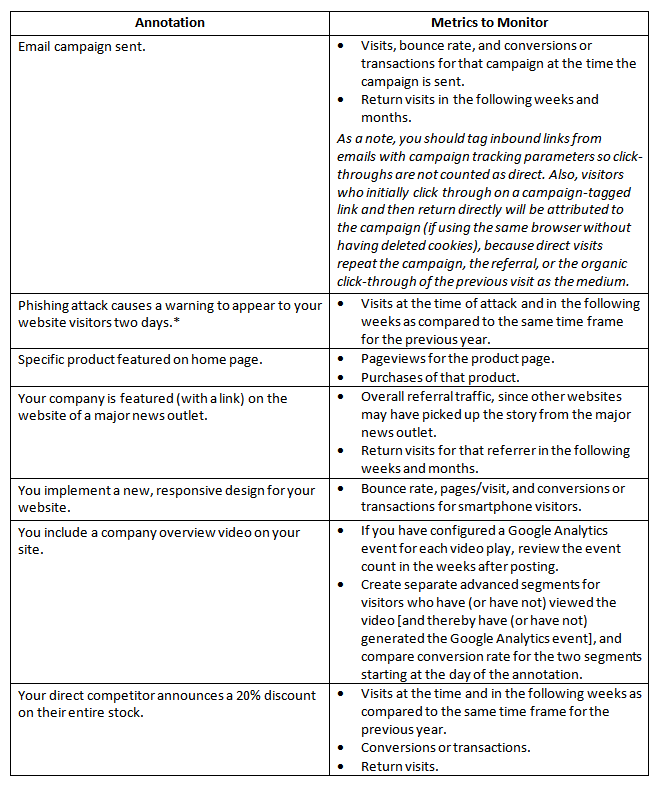
*This actually happened to my website this week. I’m monitoring the immediate impact; and a few months from now, I’m going to rely on the annotation to explain the decrease in visits.
Use Intelligence Alerts to Complement Annotations
As a complement to your annotations, you can configure Google Analytics to send custom Intelligence Alerts by email (or by text to United States phone numbers) when a metric threshold is reached for a given time period.
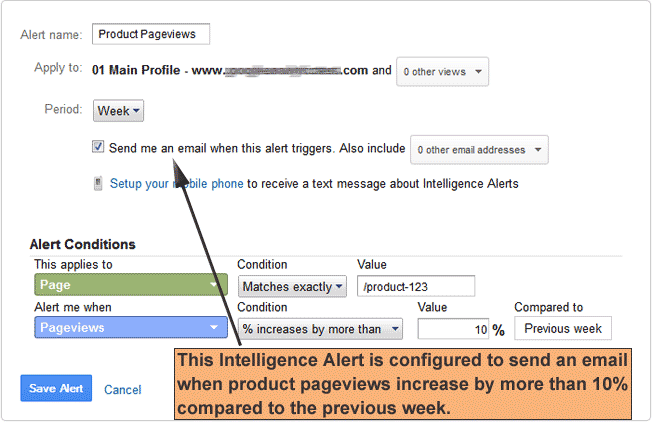
For example, after you feature a product on your home page (using one of the items in the table above), the following Intelligence Alert will generate an email if traffic to your product page increases by more than 10% compared to the previous week.
Keep in mind that the custom Intelligence Alert will be in effect until you delete it, so any factor can trigger it, not just the one you annotated. In fact, quite independently of annotations, Intelligence Alerts provide a useful mechanism for actively monitoring key metrics on your website.
Correlate Your Data with the Real World using a Chronology
Whether you maintain a chronology inside or outside of Google Analytics, and whether you create corresponding Intelligence Alerts, a chronology is not a recommendation, but rather a must. Without a chronology, there will be no correlation between your data and the real world.
You can’t be effective in Web analytics or marketing optimization if you don’t maintain a coherent, real-world timeline that helps to provide the narrative behind your data.
As with most things in life, good analytics begins with the basics.
About the Author: Eric Fettman is Analytics Trainer & Coach at E-Nor. He is also the developer of googleanalyticstest.com, a free resource for Google Analytics training and GA Individual Qualification preparation. He recently authored the Google Analytics Universal Guide: Best Practices for Implementation and Reporting and the 36-Point Google Analytics Implementation Checklist). He regularly provides GA pointers at gatipoftheday.com.
Comments (10)