
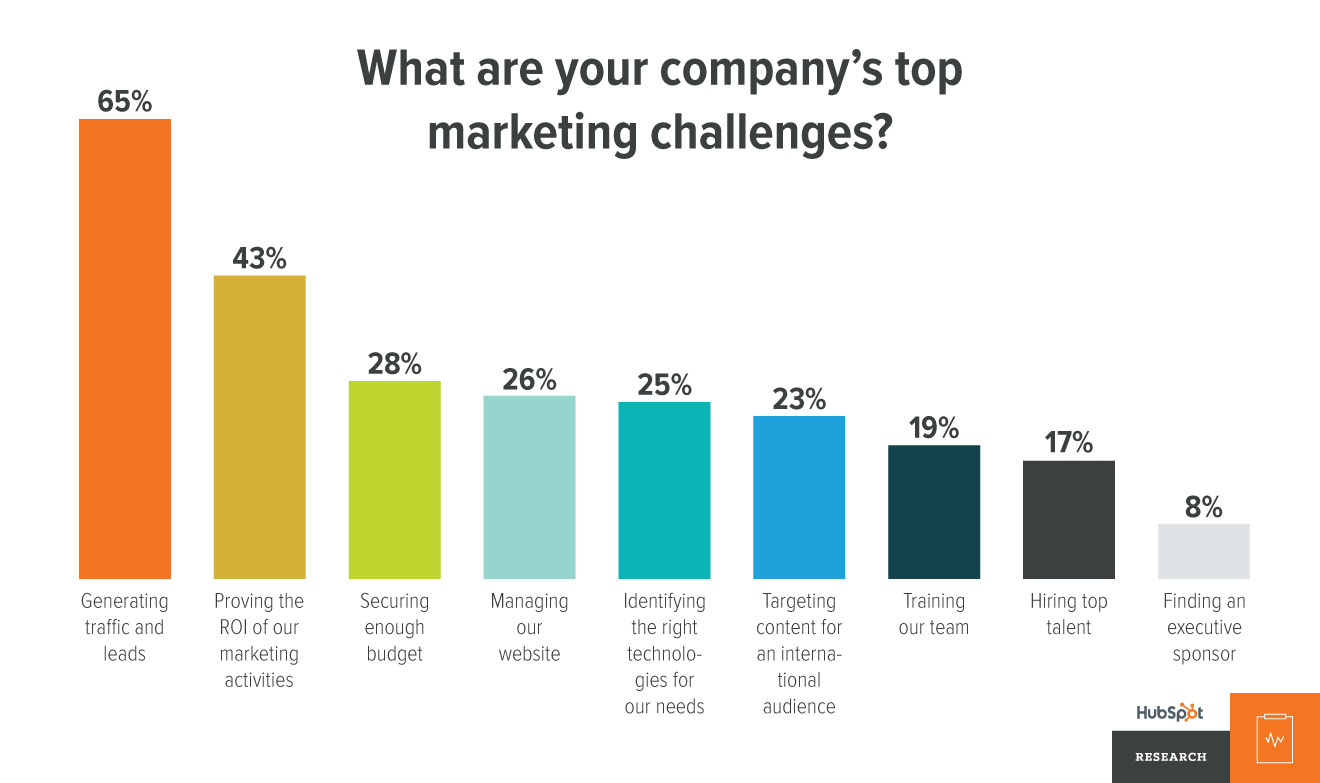
The top challenge that marketers face is generating traffic and leads to their website.
And the second greatest challenge they face is proving the ROI of the marketing activities.
Since you’re a marketer, you’re familiar with these challenges.
The goal of marketing is to generate traffic, leads, and conversion. And when that isn’t happening, you might feel like a bit of a failure.
I get it.
But here’s what’s even worse than not generating the attention you want:
Not knowing whether you’re generating that attention or not.
It’s one thing to say, “Our marketing efforts aren’t working.”
It’s another thing to say, “I don’t know if they’re working.”
With the first, you can change your strategy to do something better.
With the second, though, you can change or stick with what you’re doing, but you won’t know what’s productive and what isn’t.
That’s not a good scenario to establish for your business.
You want to find new customers. But to do that, you need to know who your audience is and which strategies are working best to reach those people.
Then, and only then, can you successfully target and retarget the people who are most likely to become new customers.
Luckily, Google Analytics has the answers you need.
How to install Google Analytics
But, of course, you first need to know how to install Google Analytics.
So let me walk you through that.
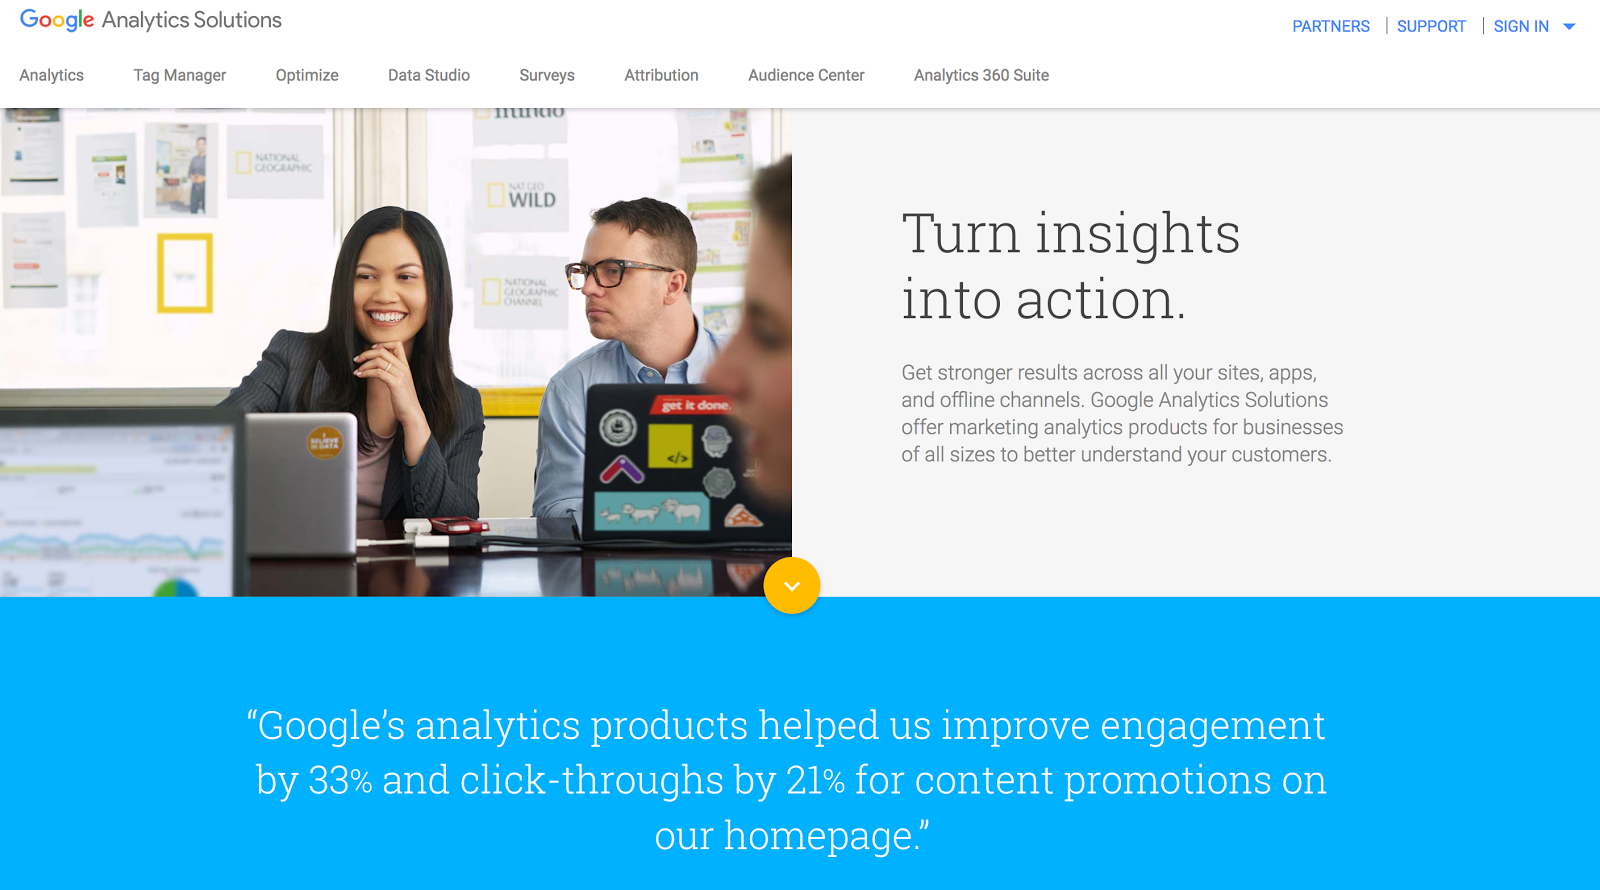
First, go to Google Analytics.
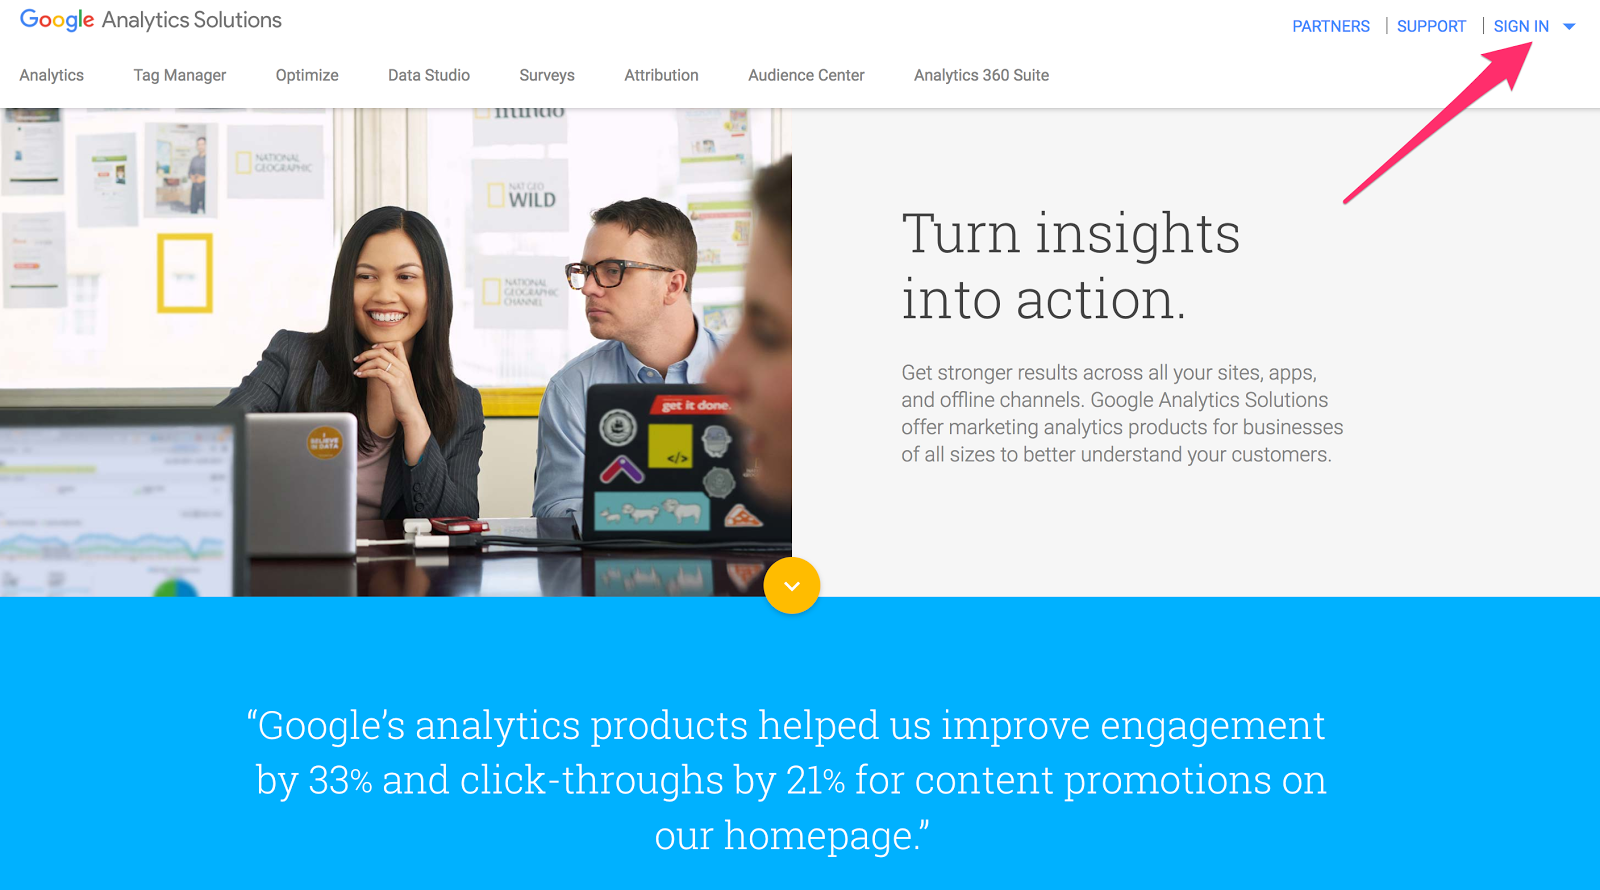
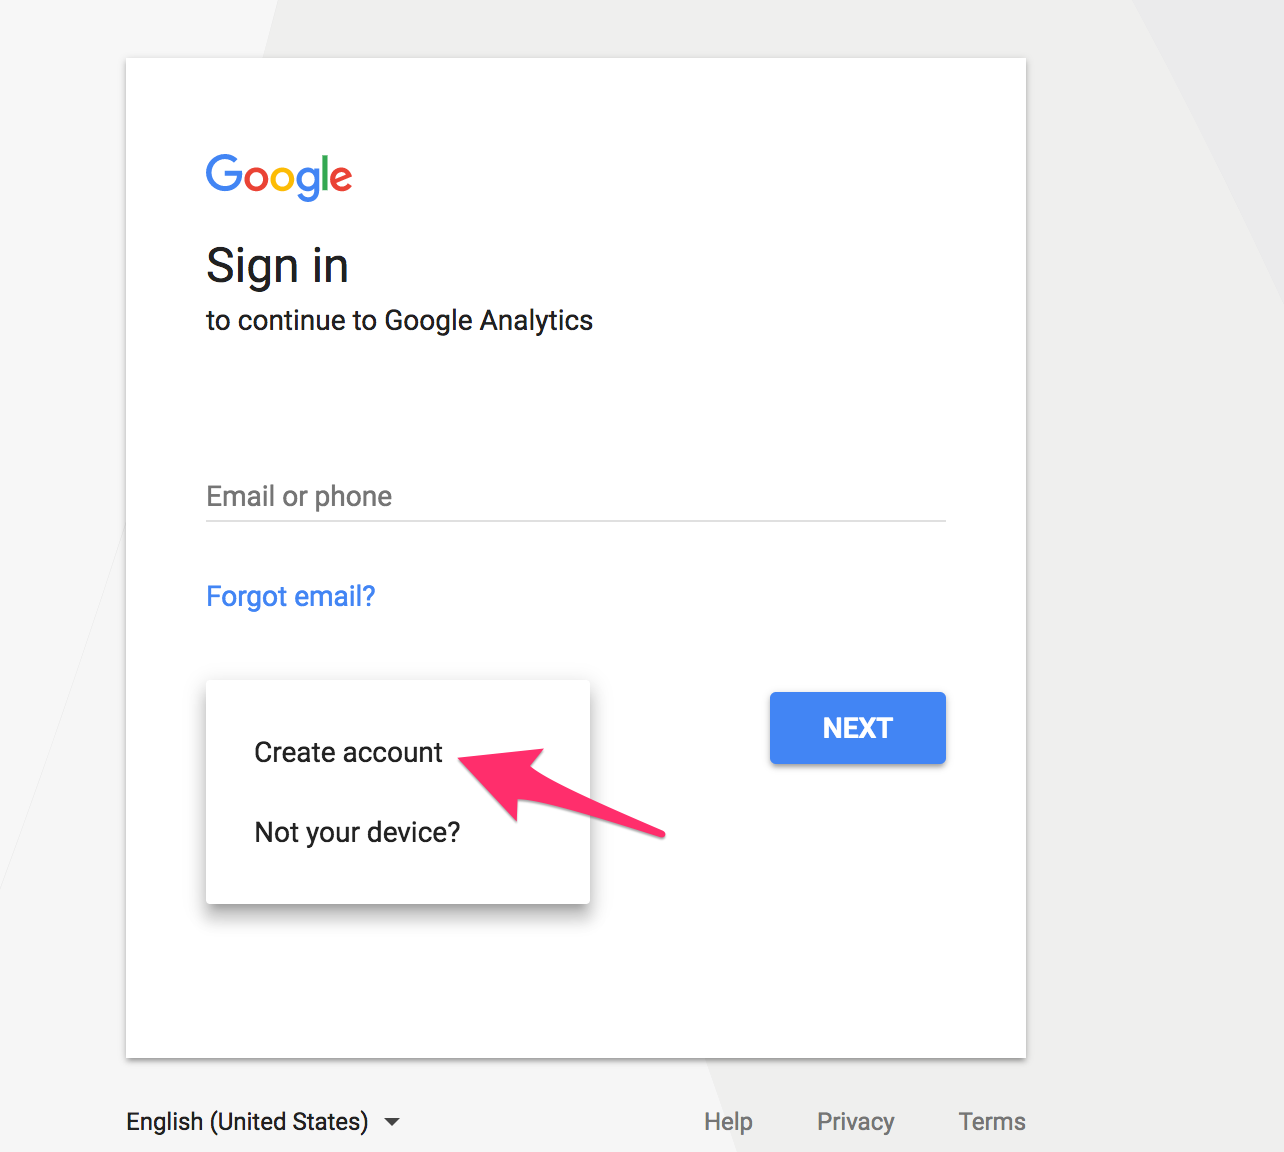
Click the button in the upper-right corner to sign in to your current account.
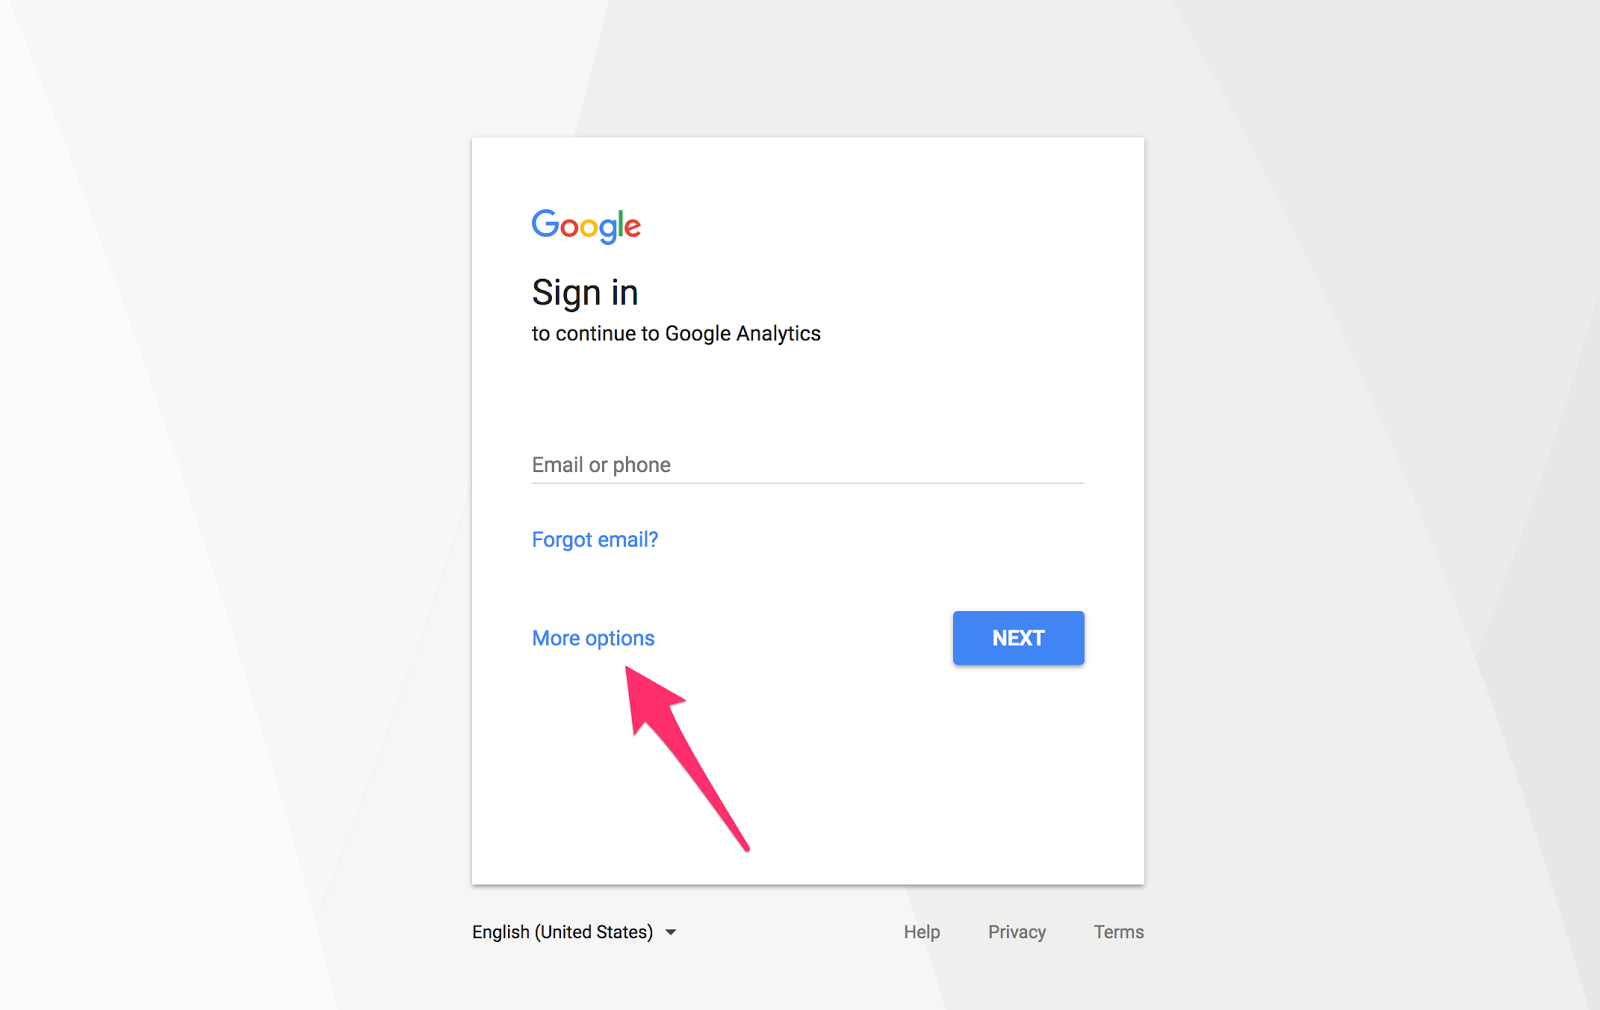
Or you can click the “More options” button at the bottom of the sign-in screen to create a new account.
Click “Create Account.”
Then enter all of the appropriate information.
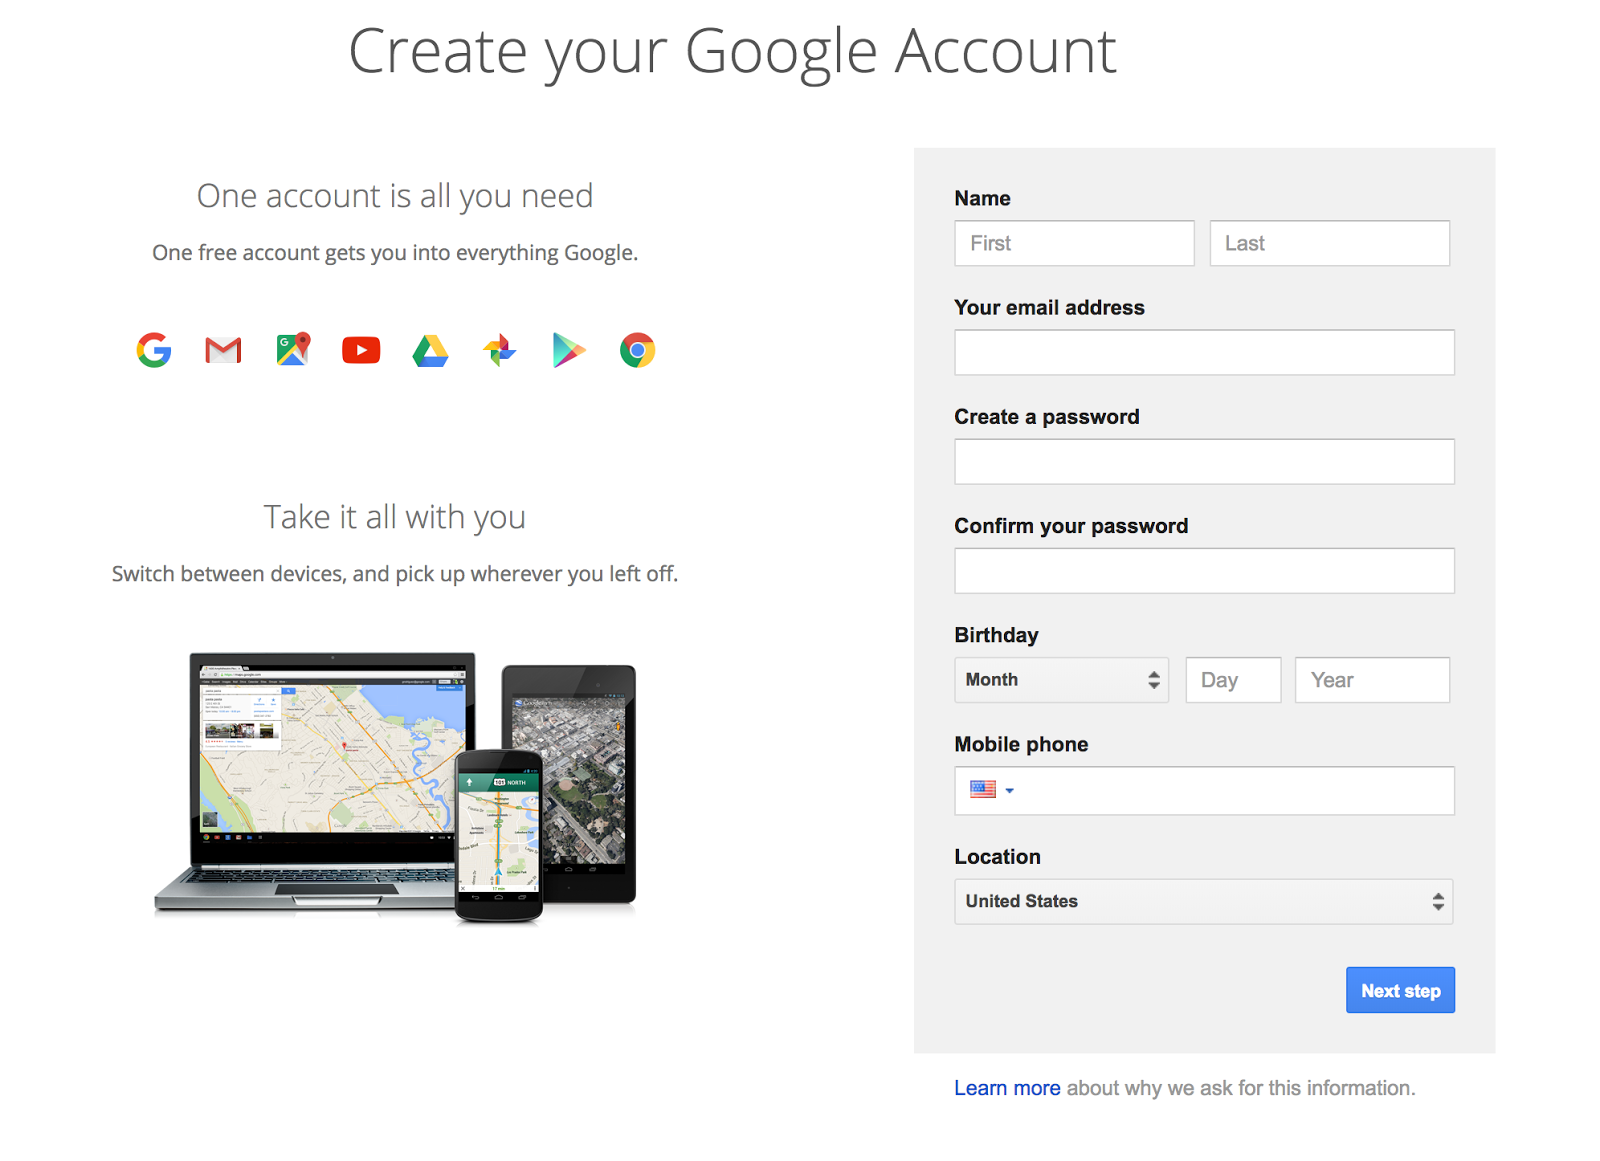
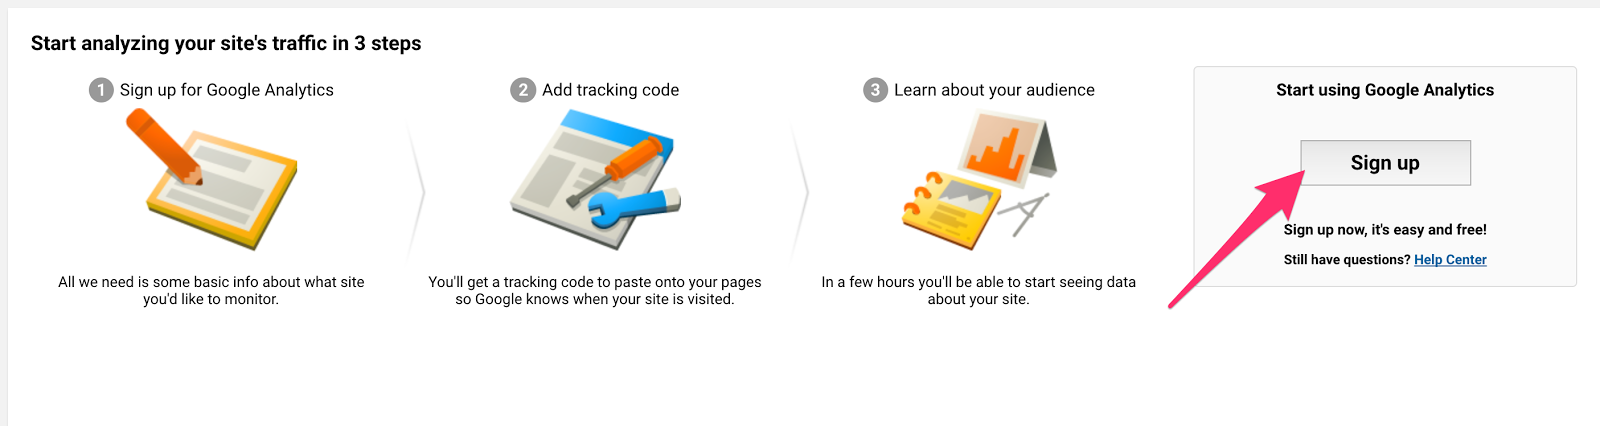
Once you’ve signed in or created your account, you’ll be able to access this page where you can sign up for a Google Analytics account.
The Google account that you just created will automatically connect to the Google Analytics account that you’re setting up.
Click “Sign up.”
Then fill out all of the information on this page.
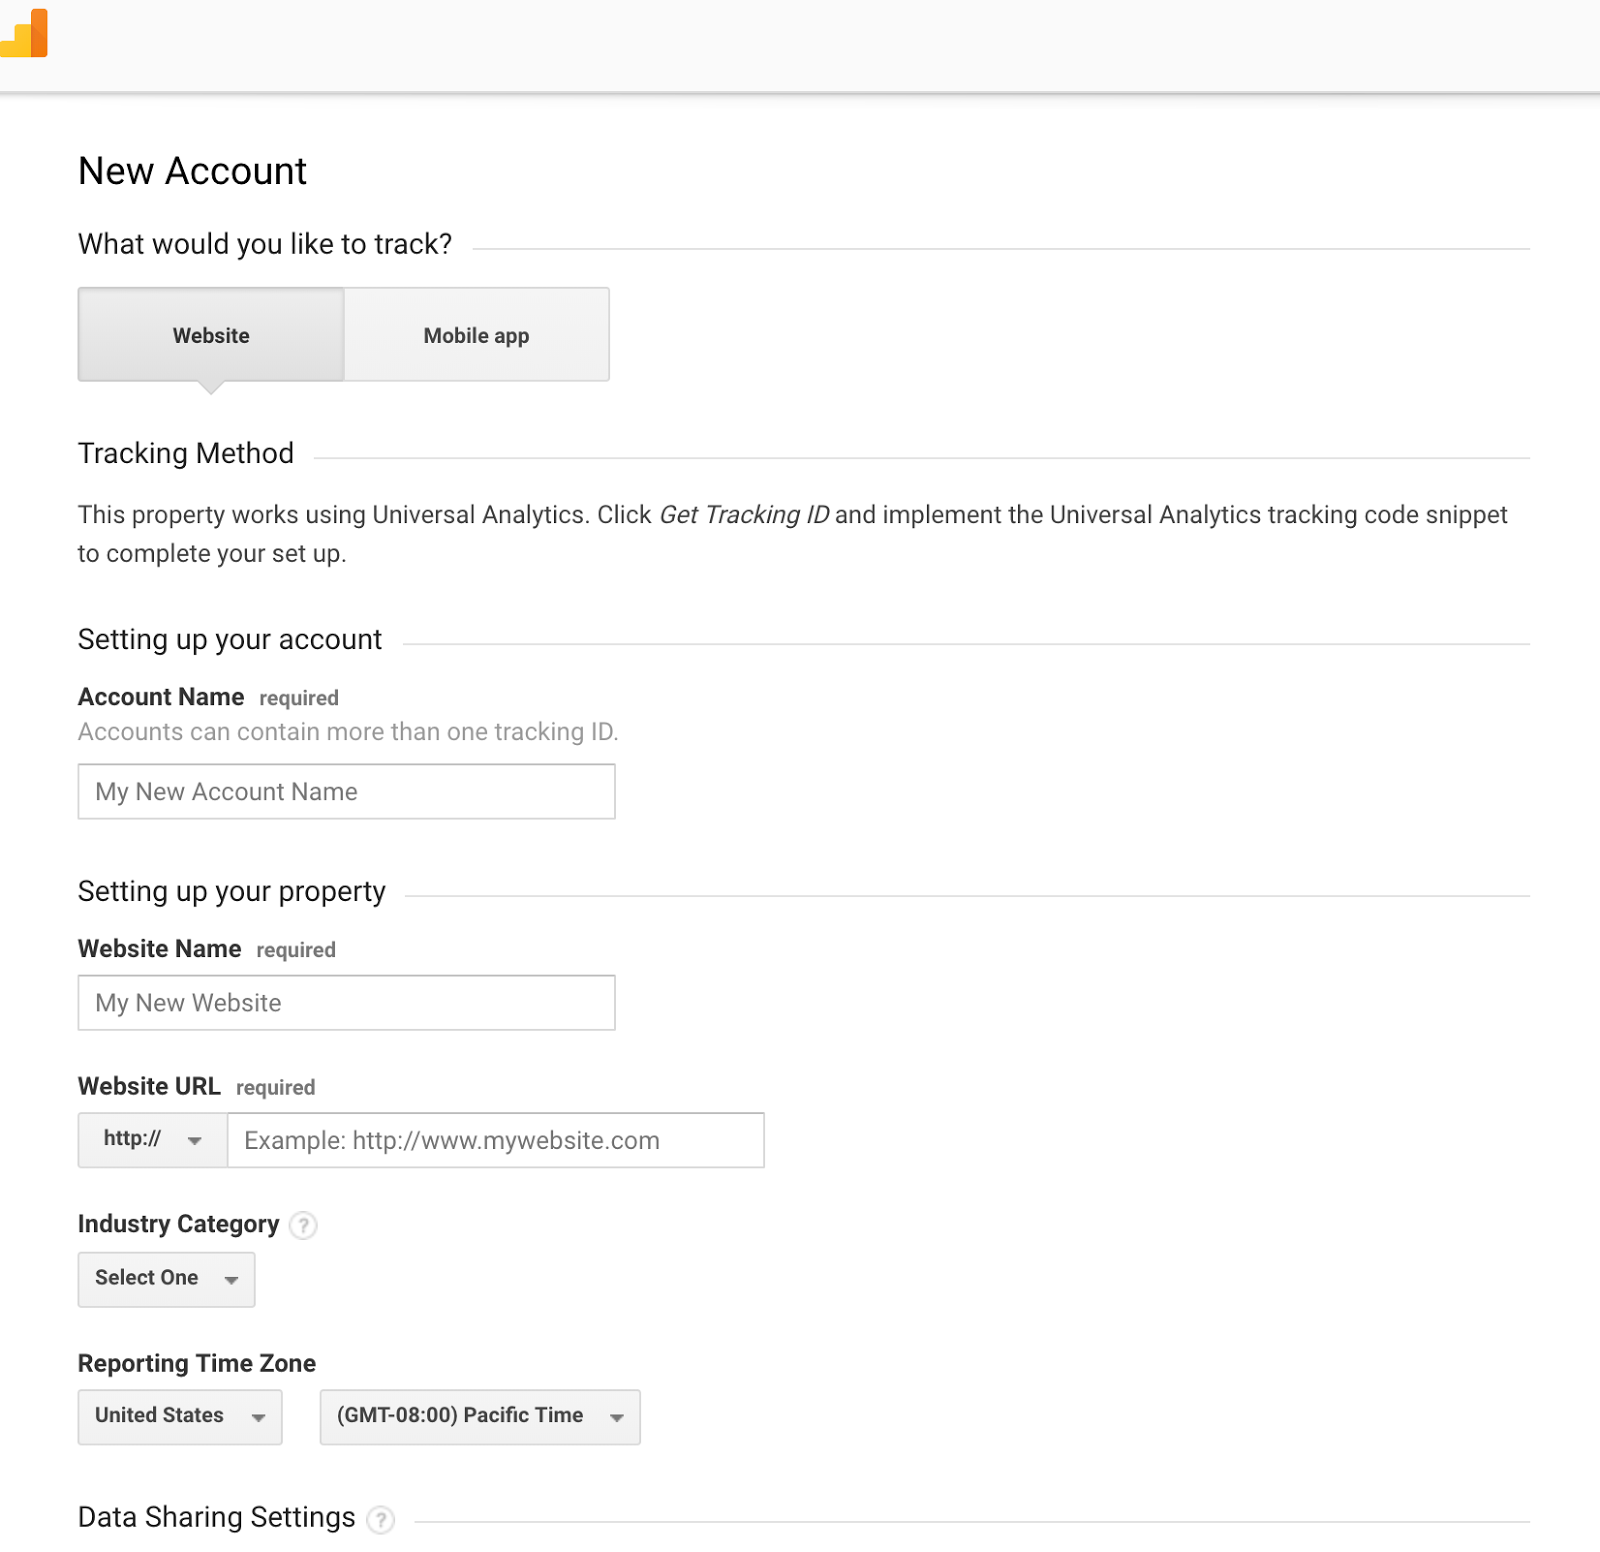
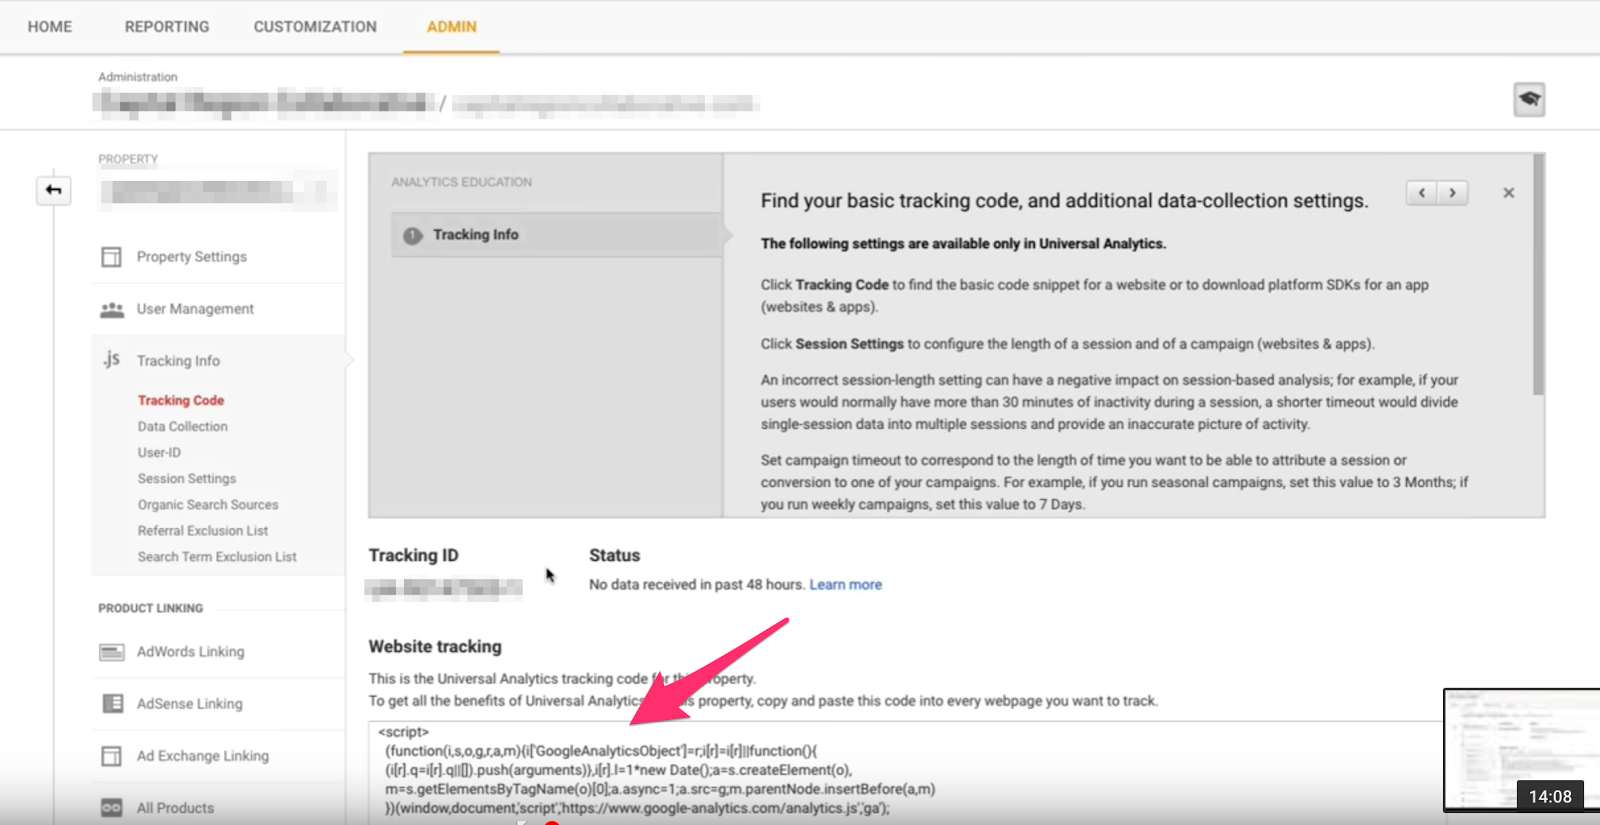
Next, you’ll see this page where you receive your tracking ID.
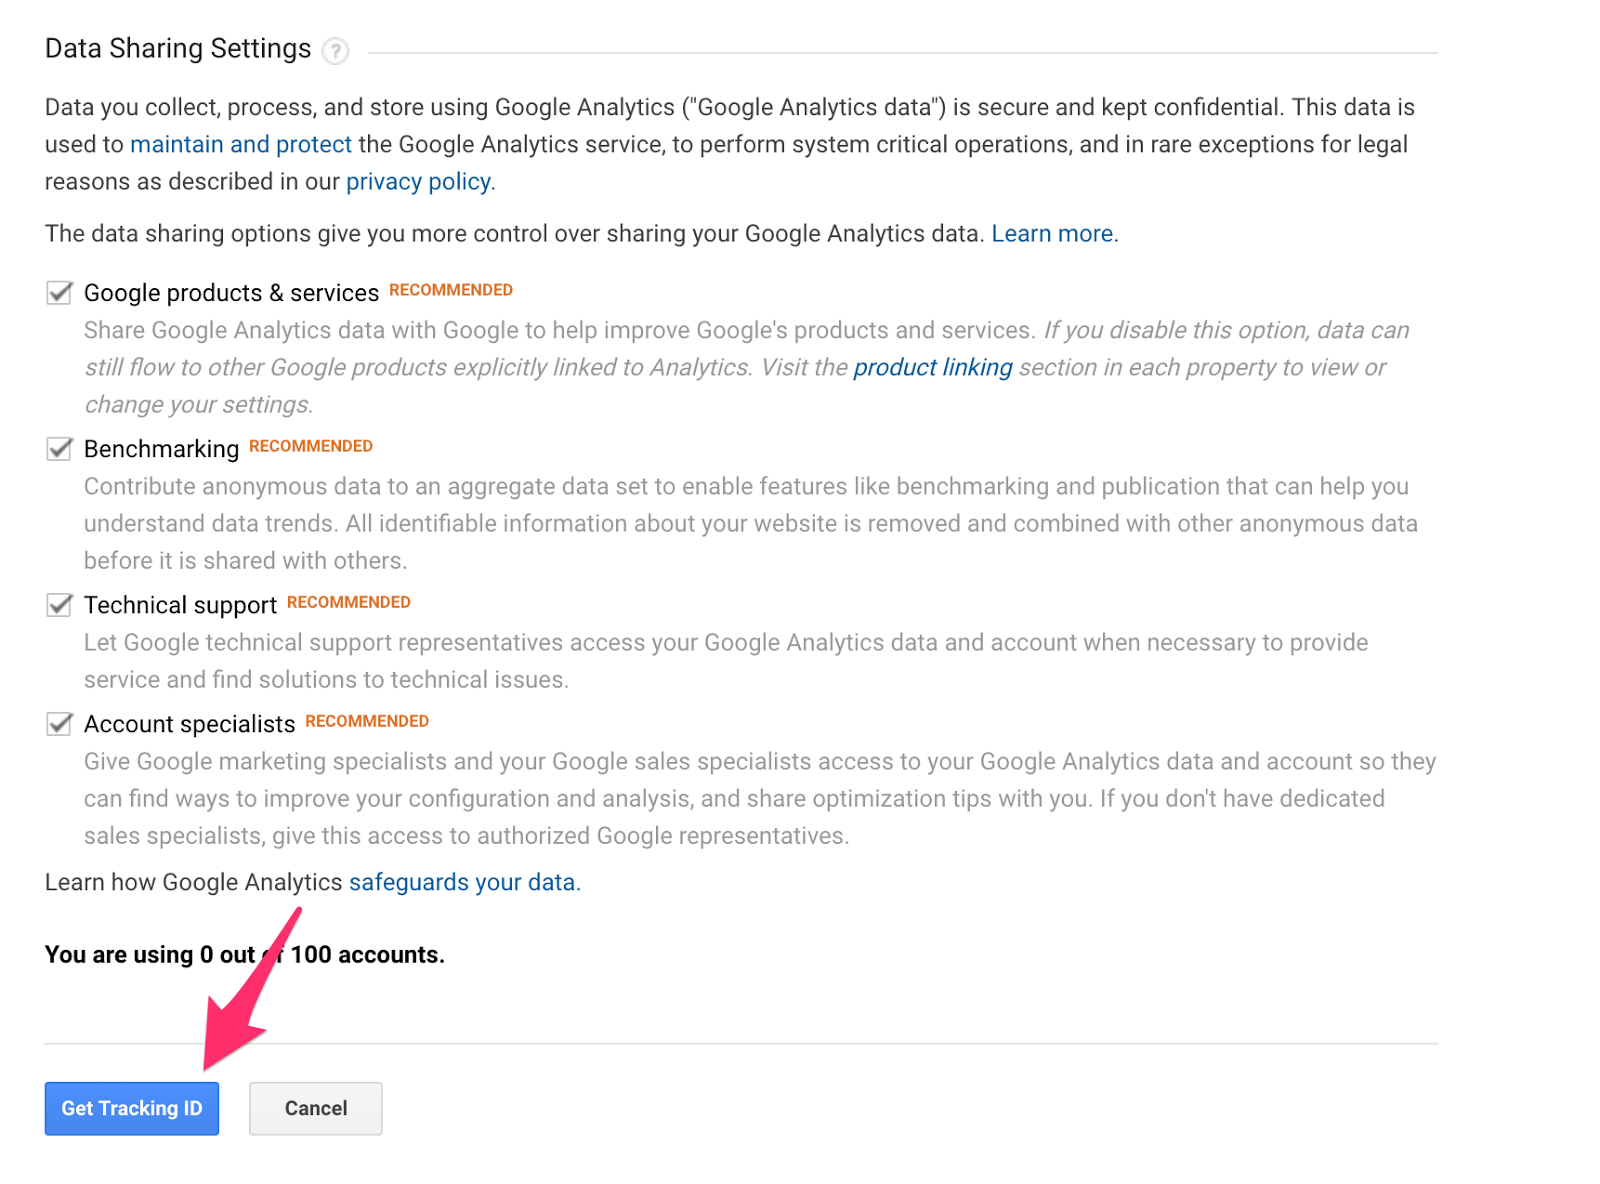
Now, this is the tricky part. You need to copy the tracking ID that Google offers you and paste it into the code on your website.
Where you want to paste this code will depend on your website’s platform. If you’re using Shopify or WordPress, then Google Analytics will easily integrate.
If you’re not, then talk to the person who developed your website and ask them where you should place the code.
Once you’ve installed Google Analytics, you can leverage all of the potential that this tool has to offer.
And its potential is quite plentiful.
In fact, here are the nine reports to learn about your current customers and how you can use that knowledge to find new customers.
1. Audience overview report
The audience overview report is one of the most useful, and it’s easy to access.
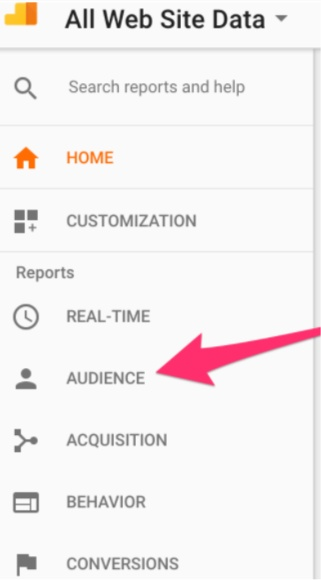
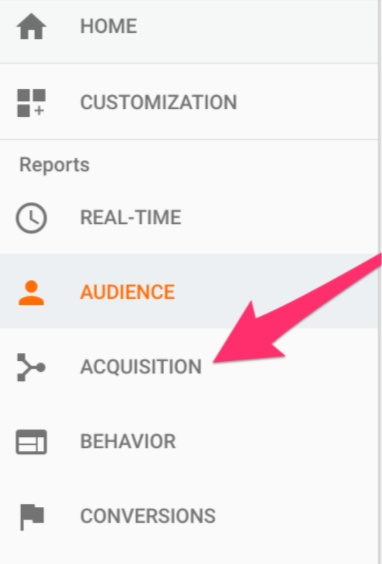
To get to it, visit your Google Analytics dashboard. On the left side of the screen, you’ll see a navigation menu. Click on “Audience.”
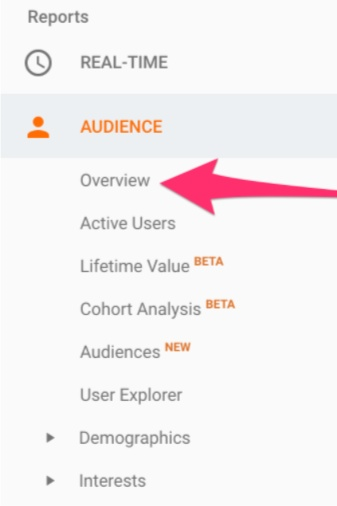
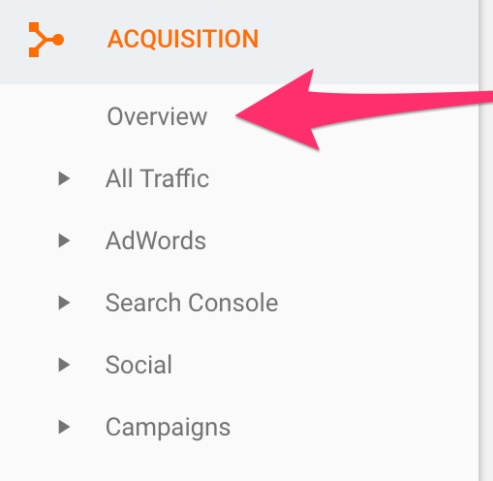
Then, select “Overview.”
This page will show up on your dashboard.
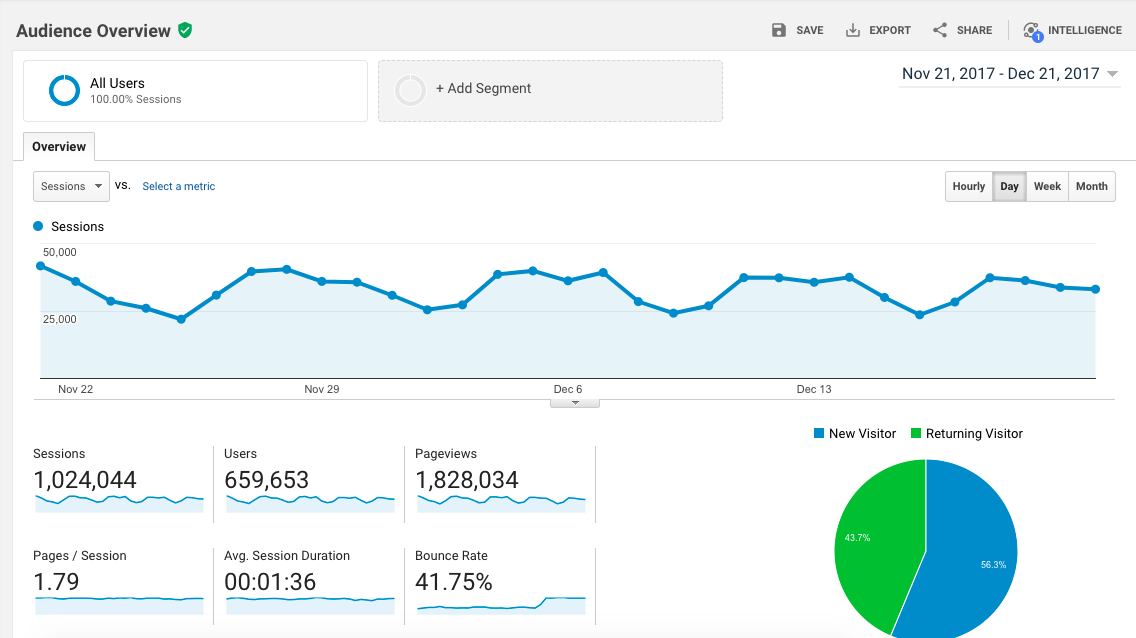
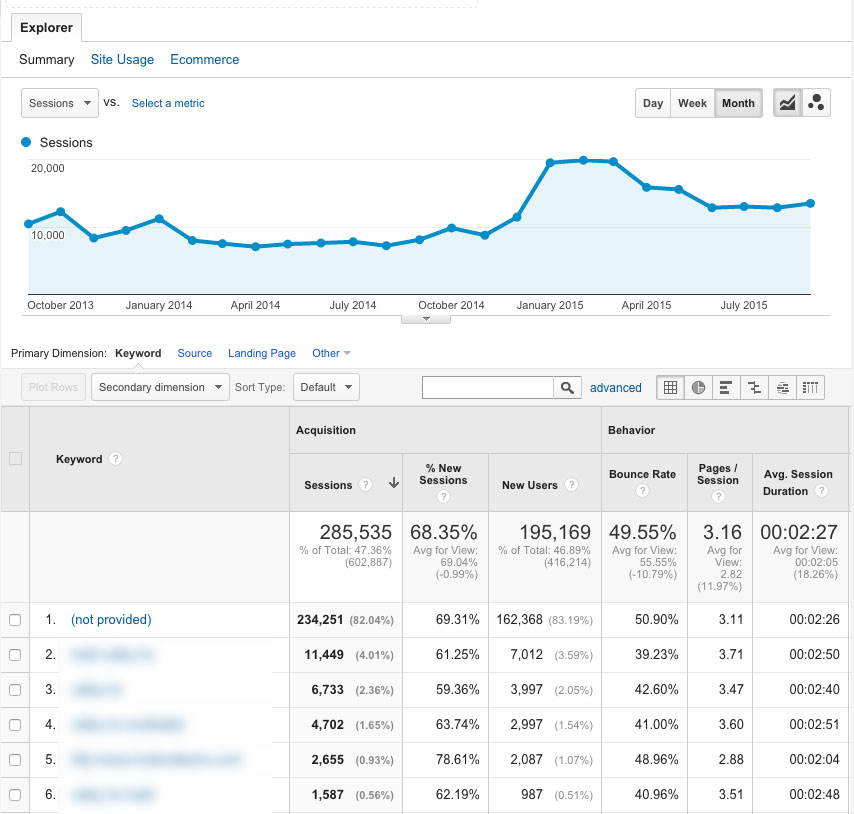
As you can see, the audience overview report shows you what percentage of visitors are new and what percentage are returning.
It also shows you the number of sessions, users, and page views along with your bounce rate, average session duration, and percentage of new sessions.
And on the bottom of the dashboard, you can categorize your audience by different demographics.
In particular, you can categorize by language, country, or city.

You can also distinguish the data by browser, operating system, service provider, and screen resolution.
Distinguishing demographics is where the real magic comes in. You can reveal where your current traffic is from, what language they speak, and which browser they’re using.
Then, you can take that information and apply it to your advertising campaigns to gain new customers.
Target people who speak the same language, are from the same country, and even use the same browser as your existing traffic.
If these demographics describe your current audience, then the people who are most likely to become customers will probably fit within the same distinctions.
2. Customer acquisition report
Measuring traffic to your website is nice.
But, in the end, website traffic only tells you the first part of the story.
It doesn’t tell you if those people are making the commitment you’re after: buying your products.
Since that’s the end goal of every marketing campaign, discovering the best channels for acquiring new customers is an absolute must.
Here’s how you can use Google Analytics to do so.
On the left-hand navigation menu, click on “Acquisition.”
Then click on “Overview.”
Now, you’ll see loads of information about your most successful customer sources. Google Analytics will split these sources into direct traffic, organic search, referral, and social.
That information will help you determine how customers are getting to your website.
In turn, that tells you where to invest most of your marketing dollars.
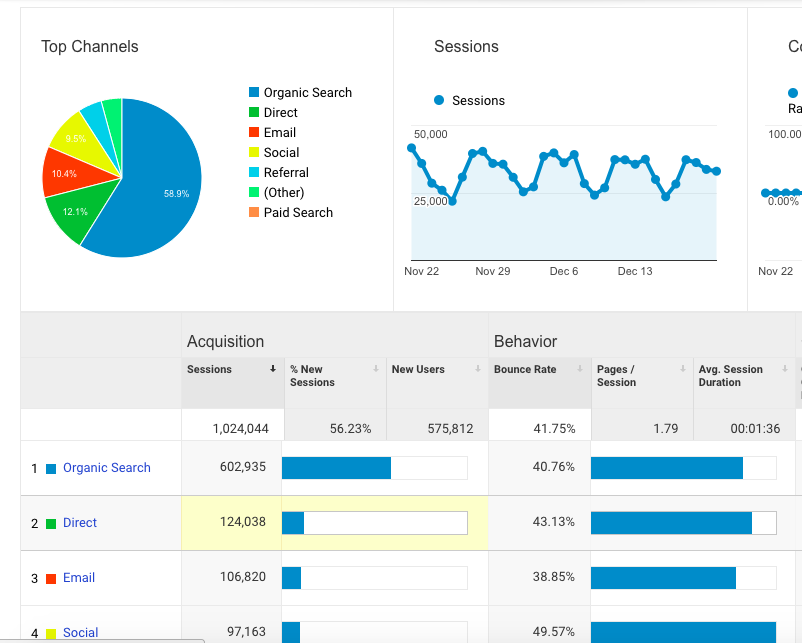
Here’s what the bottom of this dashboard looks like.

To acquire new customers, you should target the people who are most likely to buy from your website.
But you can only do that if you know where in the digital world those people are finding you from.
If you’re gaining the most customers from organic search, then invest in SEO.
If you’re gaining customers from social, then use more Facebook Ads and Instagram Ads.
Whatever the case, one thing’s for sure: If you determine where your current customers are coming from, then you’ll be able to leverage that information to gain new customers as well.
3. Site content report
Every marketer knows about the power of content marketing.
You know that consistent content marketing efforts can increase your rankings, generate passive traffic to your website, and even add leads to your stats folder.
But you can only gain new customers from your content marketing strategy if you know which content is performing and which isn’t.
Fortunately, there’s a Google Analytics report for that.
On the left-hand side of your dashboard, click on “Behavior.”
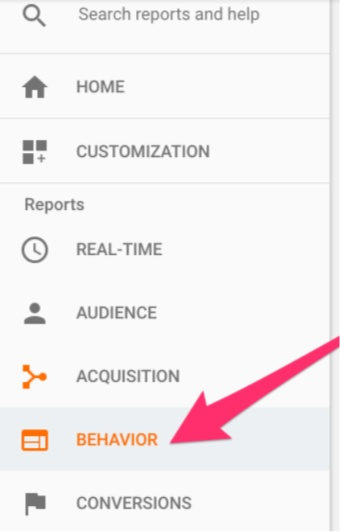
Then, click on “Site Content.”
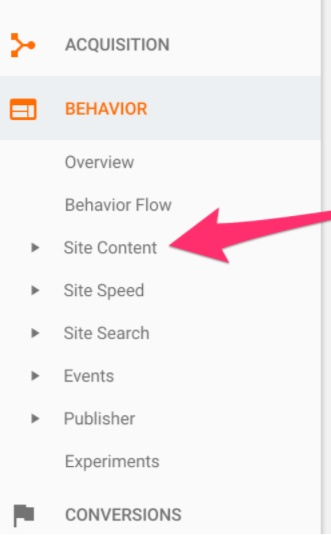
Select “All Pages.”
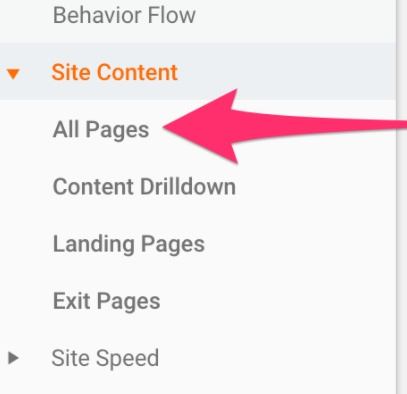
Once you’ve followed those clicks, you’ll see this dashboard.
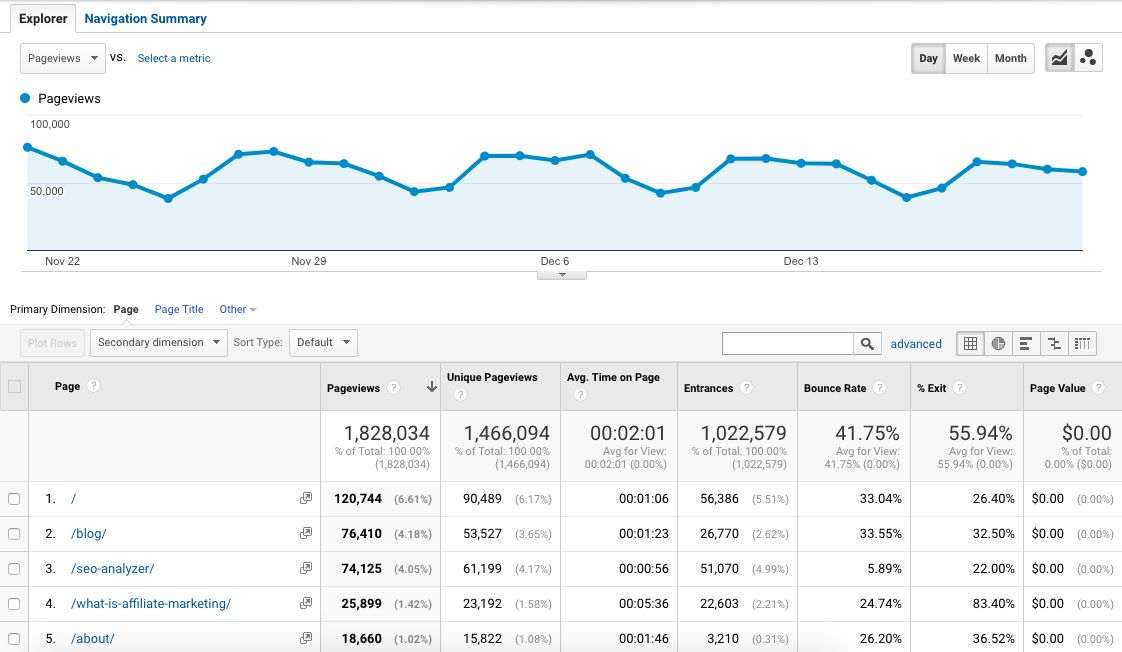
This report will show you several noteworthy things about your existing customers and how they interact with your content.
Specifically, it will show you the number of page views, average time on page, bounce rate, and page value for each individual piece of content.
Browse through this report to discover which pages are performing the best and which are performing the worst.
Then, you can run advertisements to your best pages to increase your click-through, lead generation, and conversion rates.
If your existing customers love a certain piece of content, then new customers will too.
4. Advanced segments
Sometimes, none of the default Google Analytics reports will give you the information you want.
In that case, you’ll need to create your own custom segment.
Doing this will give you the ability to browse only through website data that’s relevant to the segment you selected.
You could choose mobile visitors, purchasers, or multi-session users, for instance.
To do so, go to your dashboard and, at the top, click on “Add Segment.”
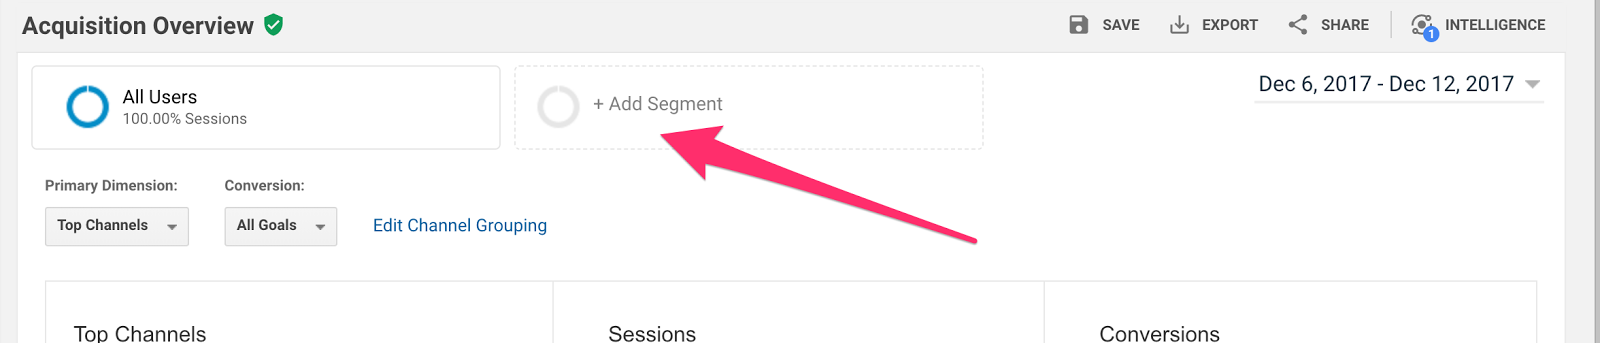
Then, select one or multiple categories that you’d like to include within the segment and click “Apply.”
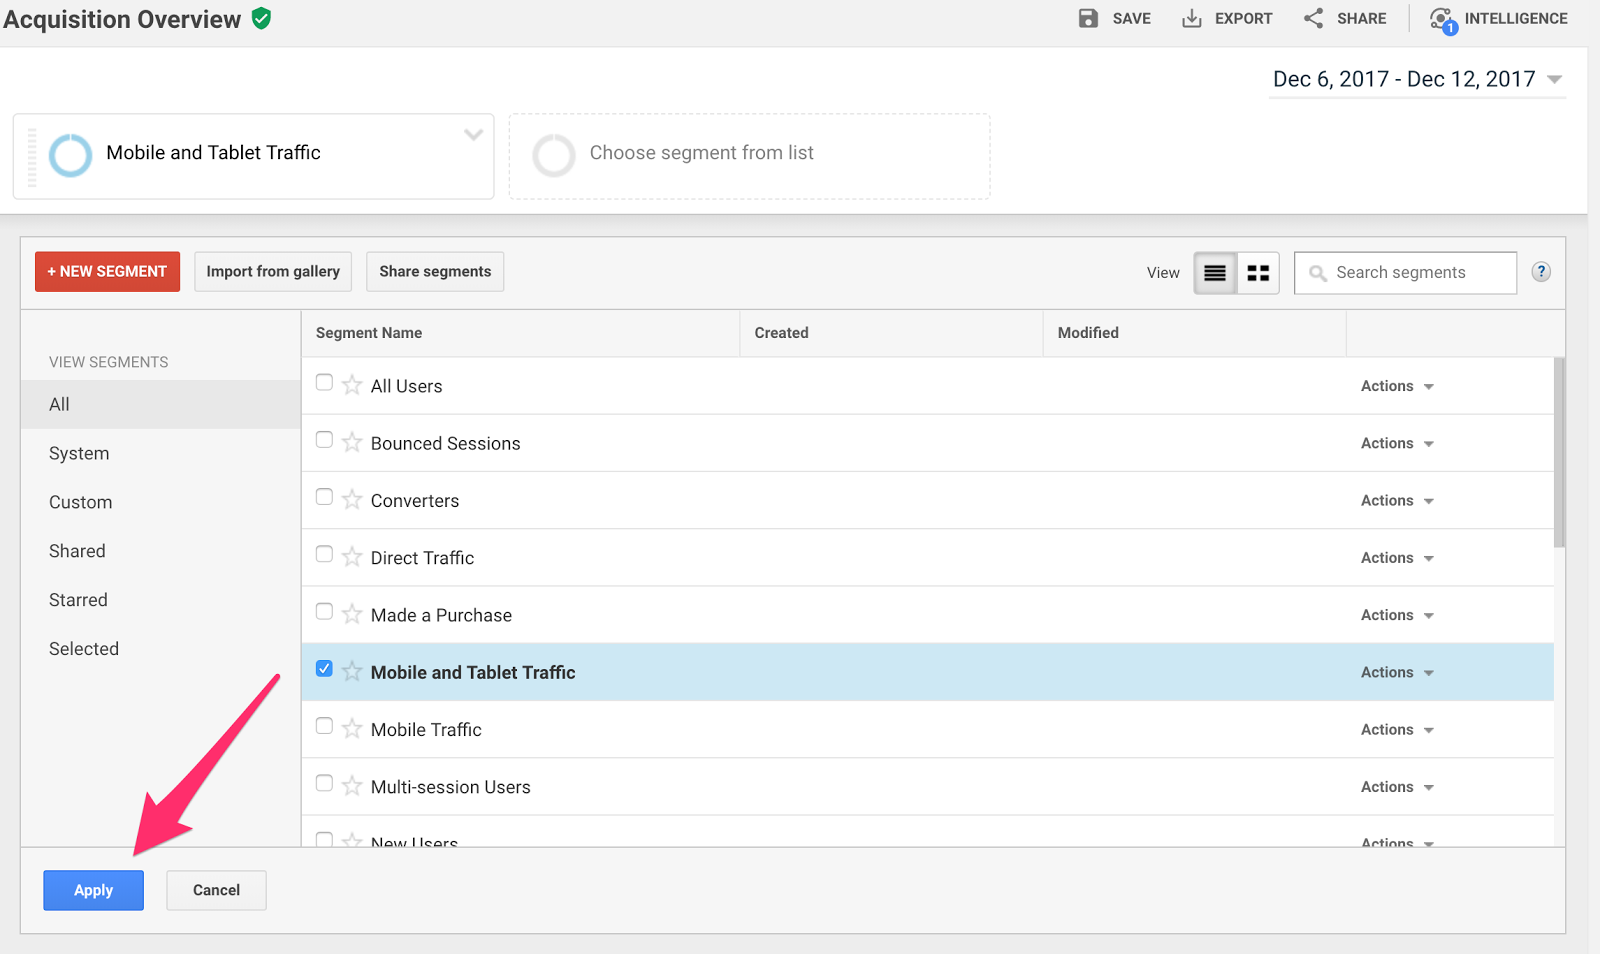
In my case, I selected mobile and tablet traffic.
This is what that segmented dashboard now looks like.
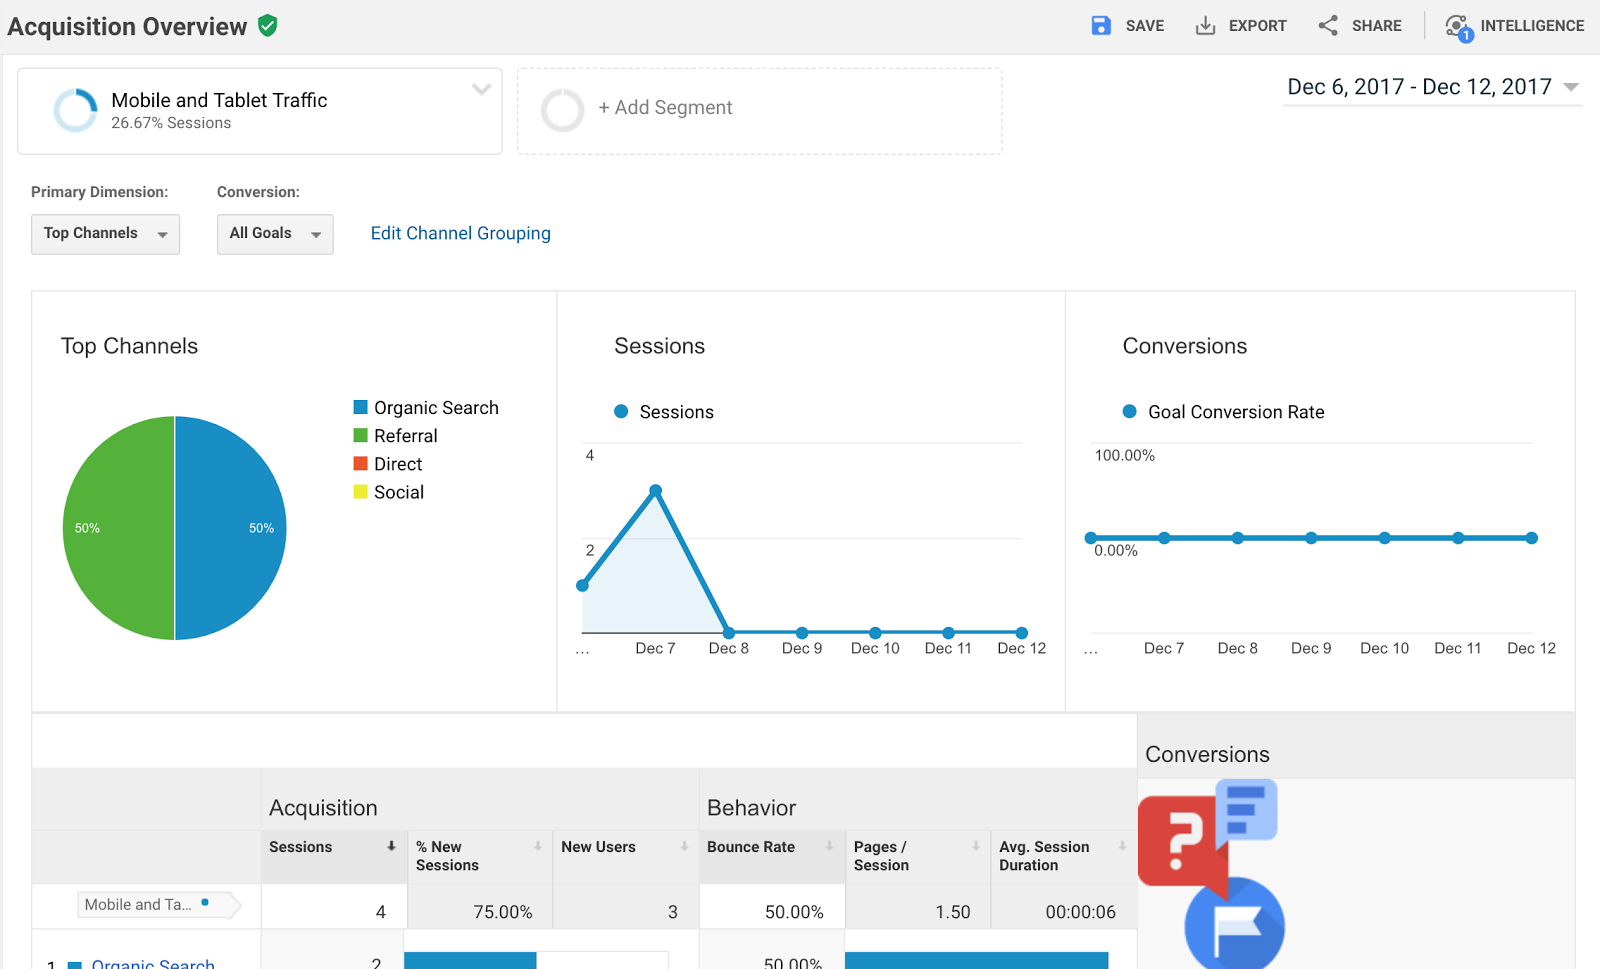
Again, this report is only showing the data for people who access this website via mobile or tablet.
In other words, this report does not include desktop traffic.
Creating segmentations for your own Google Analytics dashboard is a great way to customize the data you see.
And when you can customize the data, you can learn practically anything about your existing customers.
Which means you can better target the people who are most likely to become customers.
If you found, for instance, that 90% of your customers visited your website four times before buying, then you know to invest more marketing dollars into retargeting ads to gain new customers.
Whatever you find out with your advanced segments, use that information to target new customers, and your ROI will skyrocket.
5. Location report
Even if your business is digital, you’ll often attract a great number of people from a specific physical location.
While the Internet allows people to access your business from anywhere in the world, that doesn’t mean they will.
The reality is that word of mouth is one of the most powerful advertising tools.
And people tend to talk to other people when they are in the same place at the same time.
As you develop an audience, that audience will probably revolve around only a few locations at first.
And you can find out which locations these are in Google Analytics.
Then, you can target ads to those locations with a relentless focus to find new customers.
In the Audience Overview report, scroll to the bottom and click on “Country” or “City.”
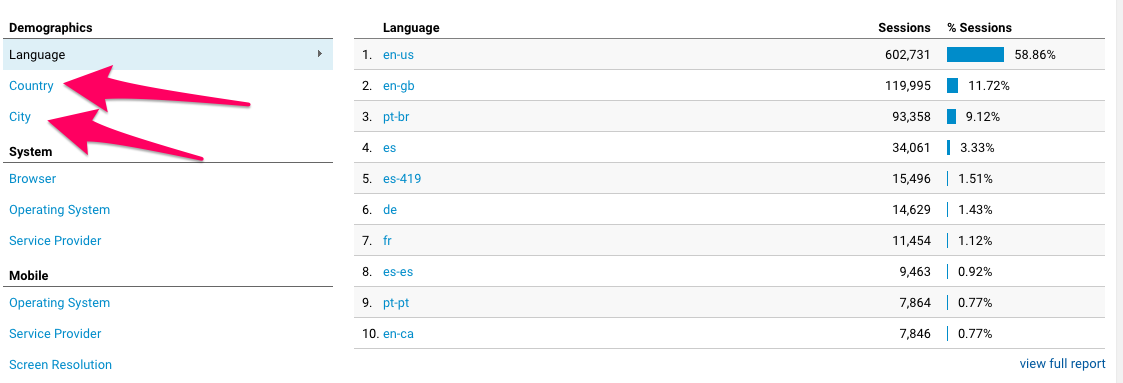
This report will then show you how many sessions are from certain countries or cities.
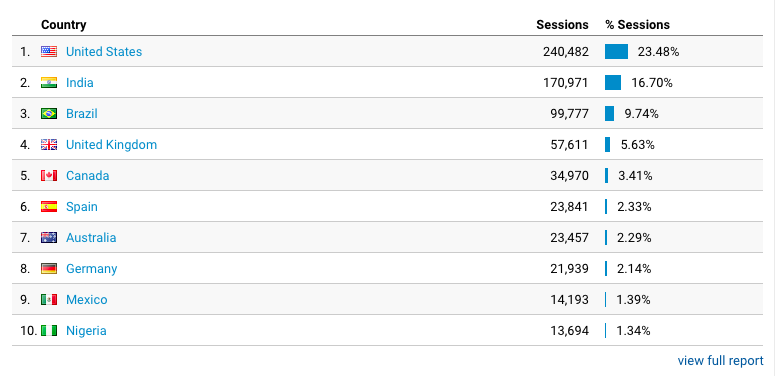
Every marketer needs to know where they are attracting traffic, leads, and customers from. That way, they can target and retarget the correct locations.
By understanding where the bulk of your customers are currently coming from, you can focus on the locations that have the best chance of attracting new customers.
This report will show you just that information.
6. Internal search report
Unfortunately, Google no longer reveals the keywords people use to access your website through organic search.
But, they do allow you to access some data regarding your internal search system.
If you have a search bar on your website, then this report will reveal how many people are using that search bar.
To access this report, click on “Behavior” on the left.
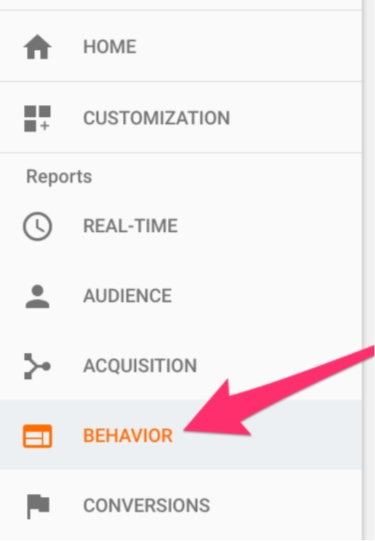
Then click on “Site Search.”
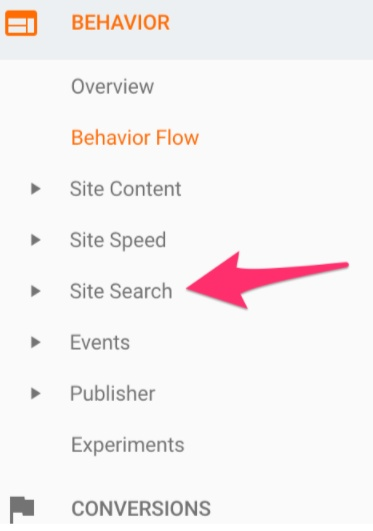
Finally, select “Overview.”
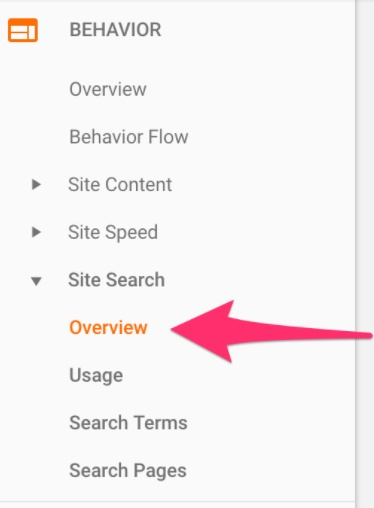
Here, you’ll be able to see sessions with search, unique searches, and average search depth.
You’ll even be able to see the most common queries if you have site search set up correctly.
And that’s a goldmine for advertising to new audiences.
Since you know what your current audience is most interested in when they access your website, you can create a piece of content around their common questions and then advertise that content to lookalike audiences on social media.
The more you do that, the more new customers you’ll gain from answering your existing customers’ questions.
7. Shopping cart abandonment report
Nothing is worse than visitors who travel to your website, add items to their carts, and then leave.
They often leave without another word on the subject.
That means that you don’t know what caused them to abandon their carts.
And if you don’t know what’s causing cart abandonment, then you can’t fix it.
Plus, cart abandonment doesn’t just represent a lost sale. It represents a potential new customer for you to retarget.
In some ways, cart abandonment is the best way to find new customers because your ideal customers have already found you.
Fortunately, with some customizations, Google Analytics allows you to track cart abandoners.
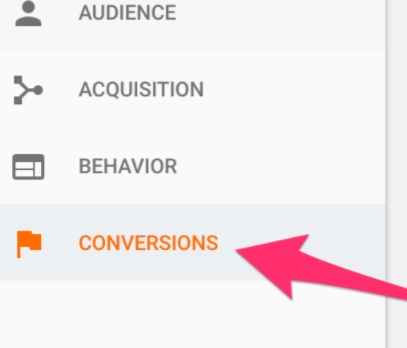
On the left-hand menu, click on “Conversions.”
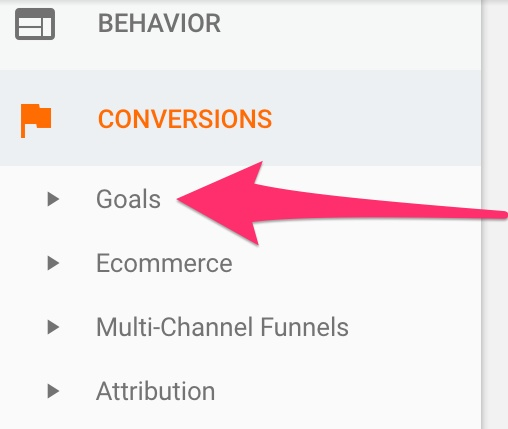
Then click on “Goals.”
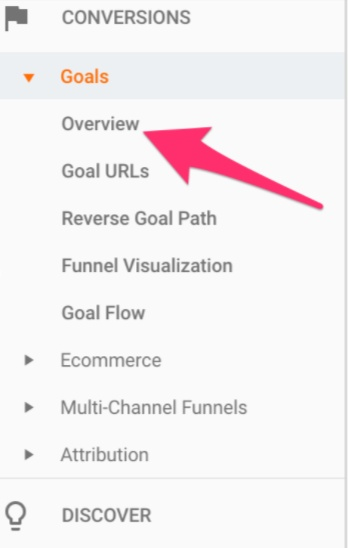
Select “Overview.”
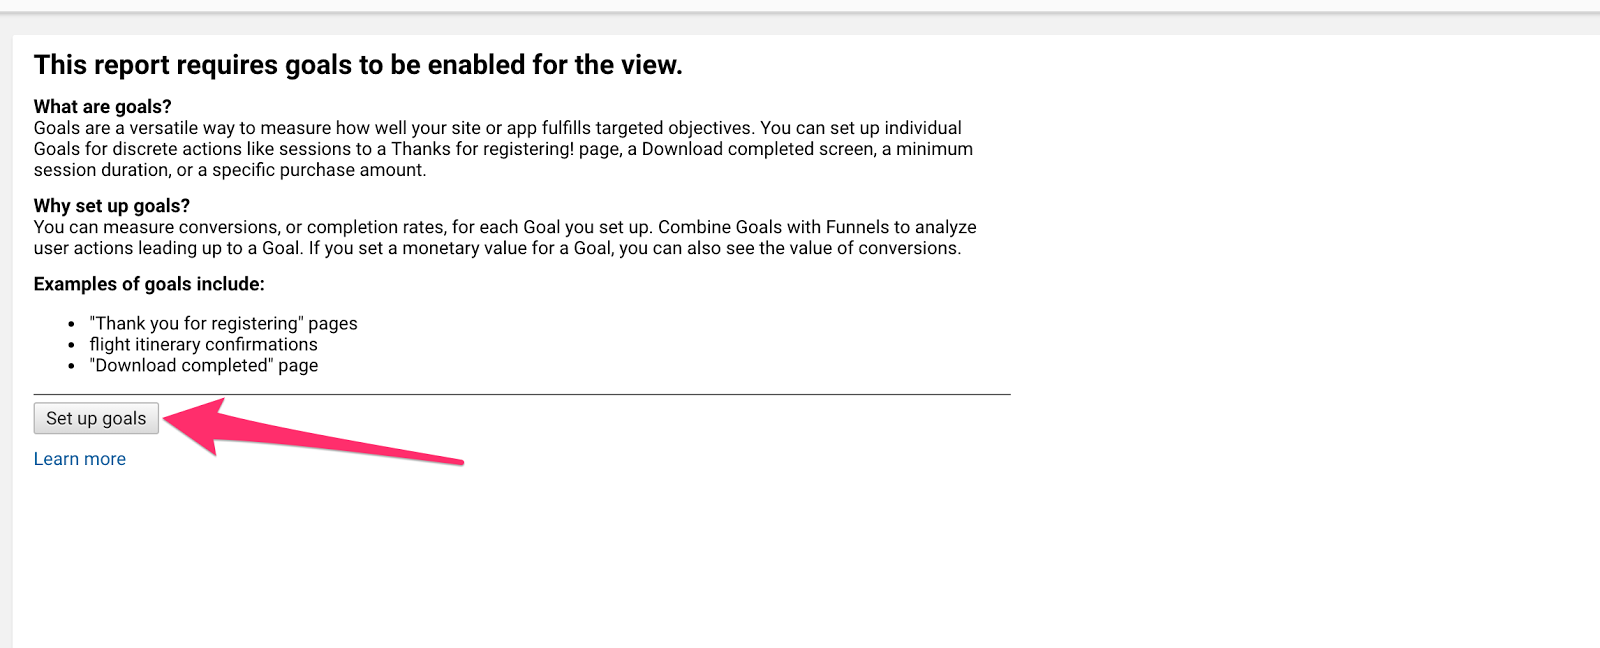
Then, on the next page, Google Analytics will prompt you to set up goals if you haven’t already.
Either way, you can create a new shopping cart abandonment goal by clicking on the “Set up goals” button and then including the appropriate links.
Once you do, you’ll be able to access tons of valuable shopping cart abandonment information.
You can see stats like how many people are abandoning their shopping carts and even when they’re doing so in the checkout process.
Then, if those cart abandoners gave you their emails, you can retarget them with the appropriate emails or social media ads that include an added discount to encourage conversion.
Oftentimes, these people just need a little extra incentive to buy.
8. Mobile activity report
For your marketing activities, knowing how people access your content is critical.
More specifically, you need to know which devices they’re using.
But why is that so important?
Think about this:
If people primarily access your website on mobile, then that means that your words should be bigger and more spaced out and that the design should be mobile-friendly.
But, more importantly, you now know to focus your social media advertising dollars on mobile devices instead of desktop.
That refined targeting means you can gain more customers for less money.
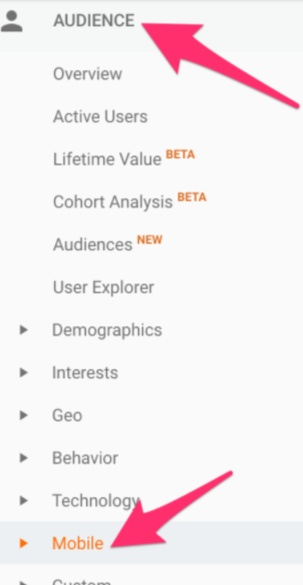
To generate this report in Google Analytics, click on “Audience” on the left side of the screen.
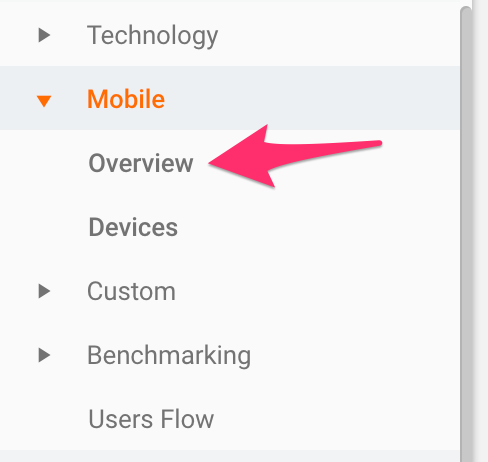
Then click on “Mobile.”
Select “Overview.”
This dashboard will appear.
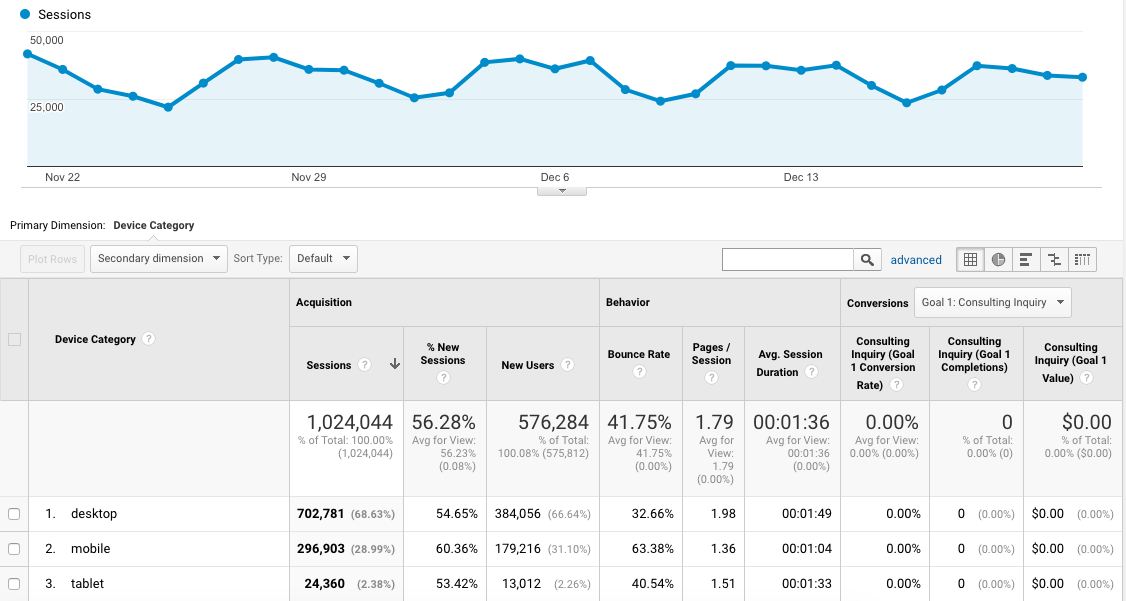
Here, you’ll be able to see how many of your sessions are coming from mobile devices.
If you need a compelling reason to make your website mobile-friendly, then viewing this report might do the trick.
But regardless of what you find, make sure that you target new customers who are similar to your existing customers.
If your current audience is on mobile devices, then your new customers will probably be too. If they’re on desktop, then use desktop ads instead.
Many of you will find that about half or more of your traffic comes from smartphones.
And if you’re only running ads to desktop, you’re not reaching all of those new customers.
9. E-commerce tracking reports
Some of you run an e-commerce store.
In that case, you’ll want to track specific conversion events like product sales, purchase amounts, and billing locations.
By doing that, you’ll not only be able to better understand your current audience, but you’ll also be able to market to other people who are similar.
That means that you’ll make the most of your advertising budget.
In the left-hand menu, click on “Ecommerce” and then “Overview.”
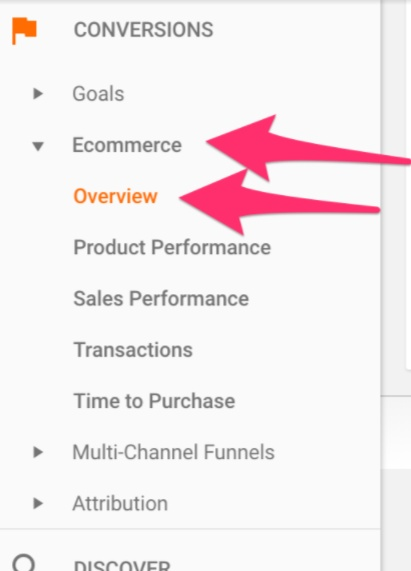
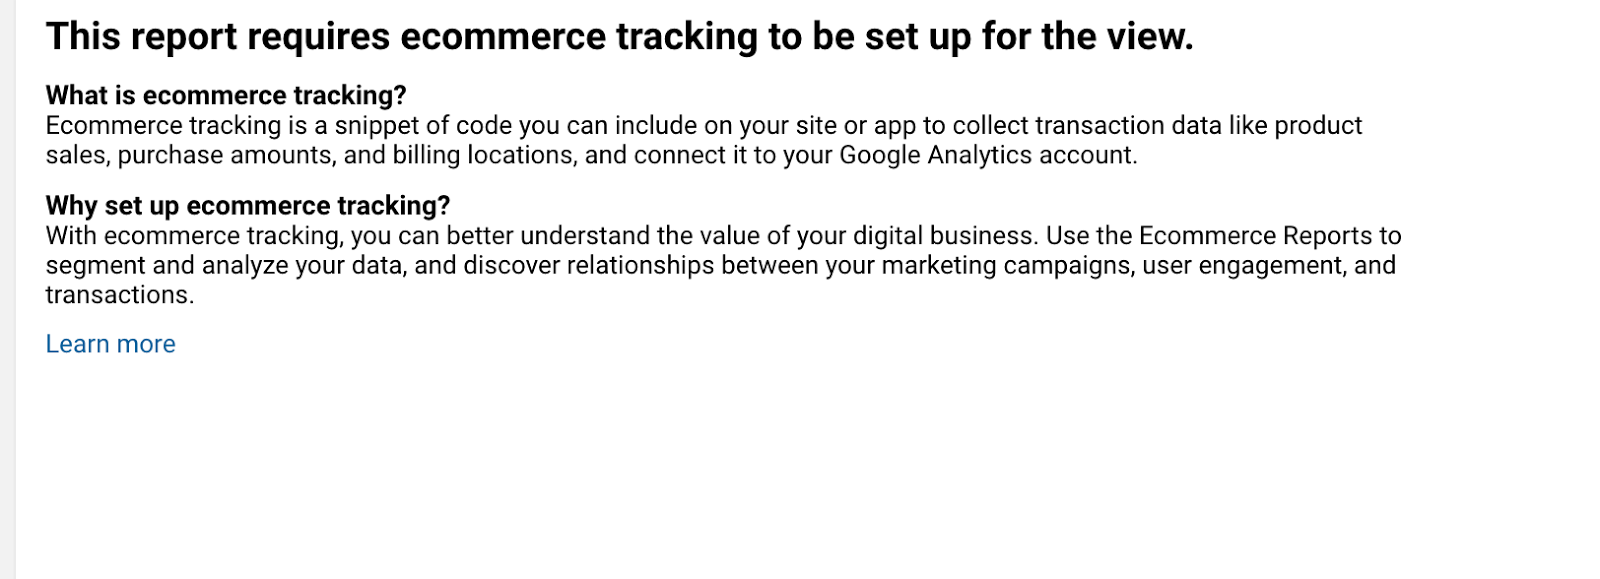
Then, you’ll have to set up the e-commerce tracking on your website. This process is similar to setting up Google Analytics.
Simply click the “Learn more” hyperlink and follow the prompts.
Once you do, you’ll be able to access loads of information about your current customers.
What are their tendencies? What are their favorite products? How much do they prefer to spend?
With this report, you can answer those kinds of questions and advertise to similar audiences to gain new customers.
Conclusion
If you’re like most marketers, then your biggest challenges are generating traffic and leads and then proving the results of your efforts.
With Google Analytics, though, those challenges become minor hurdles.
All you need to do to collect valuable information that allows you to reach new customers is use these nine reports.
- Audience overview
- Customer acquisition
- Site content
- Advanced segments
- Location
- Internal search
- Shopping cart abandonment
- Mobile activity
- E-commerce tracking
When you know how to access those reports, you can use them as references to reach similar audiences.
The truth is that your future customers are out there waiting for you to reach them. But you can only do that if you know who your current audience is.
Google Analytics is the best place for you to find all of the information you need to keep expanding your business.
Which Google Analytics reports do you think reveal the most about who your customers are and how you can find new customers?
Comments (26)