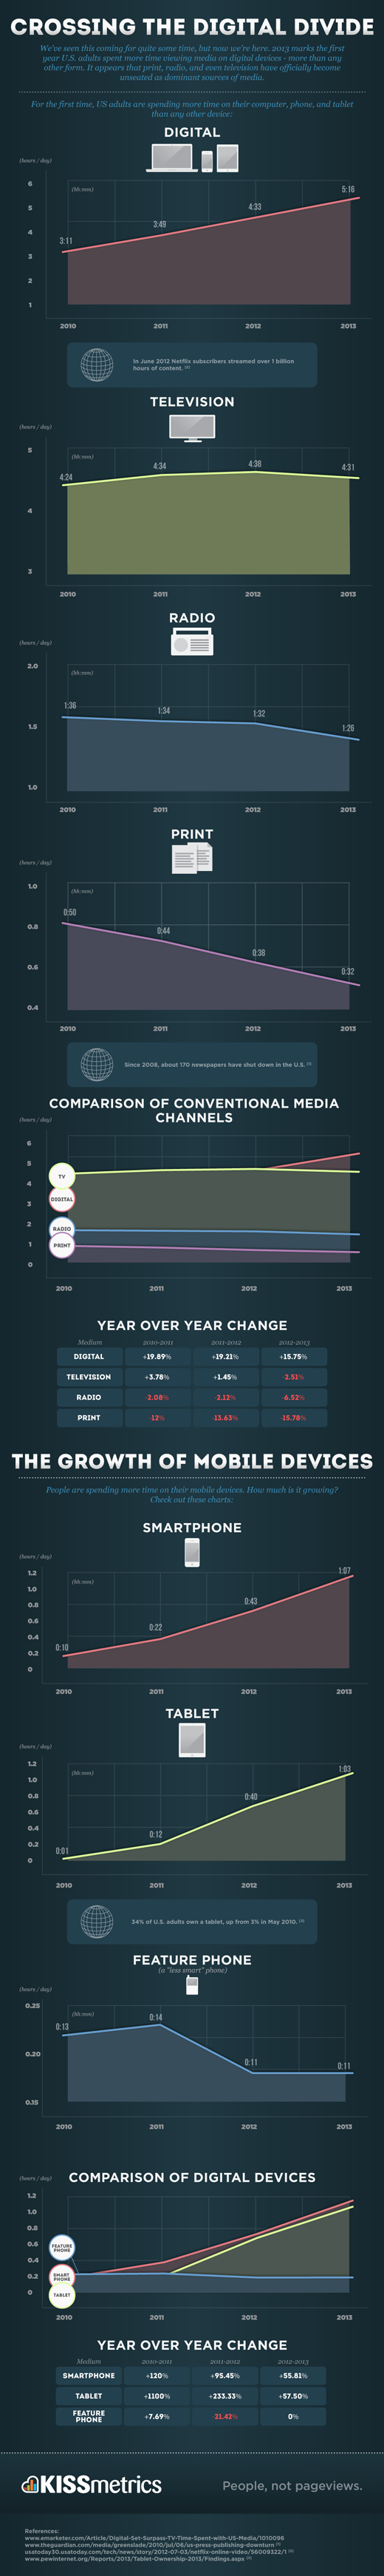
We’ve seen this coming for quite some time, but now we’re here. 2013 marks the first year U.S. adults spent more time viewing media on digital devices – more than any other form. It appears that print, radio and even television have officially become unseated as dominant sources of media.
Facts and Stats To Tweet:
- Since 2008, about 170 newspapers have shut down in the U.S. »tweet«
- In June 2012 Netflix subscribers streamed over 1 billion hours of content. »tweet«
- 34% of U.S. adults own a tablet, up from 3% in May 2010. »tweet«
Fast Facts
Digital:
- In 2012, US internet users spent 27% of their online time on social, 15% on entertainment, 9% on shopping, and 27% on “other”.
- In 2012, 33% of US adults under 30 got their news from social media. 34% watched TV news and 13% read print or digital newspaper content.
Television:
- Among young US adults (ages 18-24) TV viewership has declined from 26.78 hours per month in Q1 2011 to 23.40 hours per month in Q1 2013.
Radio:
- According to the Radio Advertising Bureau, radio revenues increased 1% in 2011 to $17.4 billion. This is much less than the 6% revenue growth in 2010; but the radio industry did have more revenue to recover due to the recession.
- Due to pressure from streaming music services like Pandora, Spotify, Rdio, and Slacker, many radio stations have introduced their own streaming services. Radio giant Clear Channel introduced their “iHeartRadio” app, CBS Radio introduced the “Radio” app, and many stations have their own individual apps and streaming.
Print:
- Magazine circulation declined each year from 2008-2011 (2012 data unknown):
- 2008: -1.1%
- 2009: -2.2%
- 2010: -1.5%
- 2011: -1.0%
- From 2003 to 2010, newspaper ad revenues have fallen by -49.27%. Online advertising for newspapers has grown 150.16%. Total revenues have fallen -44.01%.
- Nearly every magazine or newspaper is now available in digital form through iTunes or the Kindle Store.
Smartphone:
- 56% of American adults own a smartphone.
- In 2012, 31% of smartphone users in the US got their news on that device.
- 15.2% of North America’s web traffic comes from mobile.
Tablet:
- A survey done in the UK, US, and Australia asked 510 people to keep track of what they did with their three most used devices (tablet, smartphone, computer). For tablet, 81% of respondents said they used it for email, 69% said they use it to read the news, 63% said they check weather, 62% said social networking, and 60% said gaming. It’s fair to assume streaming content is now in the top 5. Netflix is always in the top 50 for most downloaded apps.
Feature Phone:
- Over 110 million feature phone users have yet to migrate to a smartphone.
- In Quarter 2 2013, it’s estimated that 210 million feature phones were sold worldwide compared to 225 million smartphones. This marks the first time where smartphones outsold feature phones in worldwide sales.
Misc:
- “Cord Cutter” is a term to describe a person who has no cable TV subscription and instead gets all their media and video content through various internet services.
- The cord cutter population is growing. By year end 2013, there will be an estimated 4.7 million US cord cutters.
- In 2012, 33% of US adults under 30 got their news from social media. 34% watched TV news and 13% read print or digital newspaper content.
- US Internet Users:
- 2010: 221.0 million (71.2% of entire US population)
- 2011: 229.2 million (73.2%)
- 2012: 236.9 million (74.9%)
- 2013: 244.1 million (76.5%)
Comments (19)