One of the best parts of the new Google Analytics layout is the summary view that automatically includes acquisition, behavior, and conversions information (including the rate, completions, and value for each goal). This means that if you have goals set up in Google Analytics (learn how to set up URL destination goals), you can see how everything – from traffic sources to content – drives conversions.
In this post, we’re going to look at specific things you can take away from the top areas of Google Analytics’ standard reporting based on conversion data.
The Summary View
First, let’s take a quick peek at how to use the summary view in Google Analytics. The summary view is now the default view in the explorer throughout the standard reports.
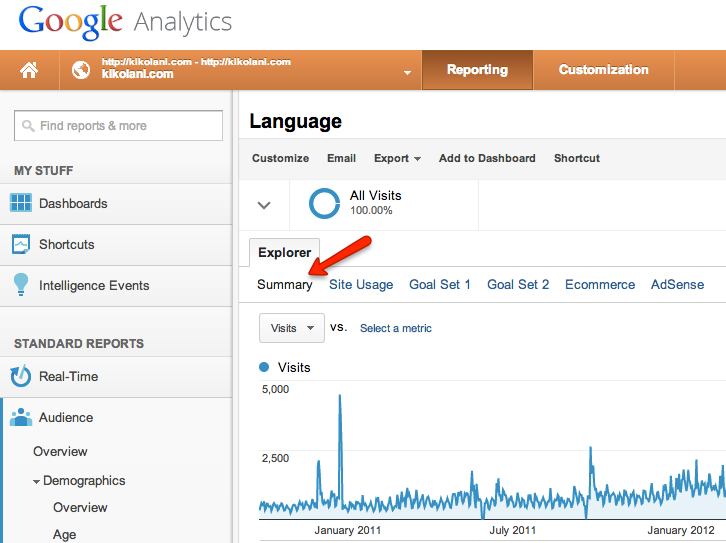
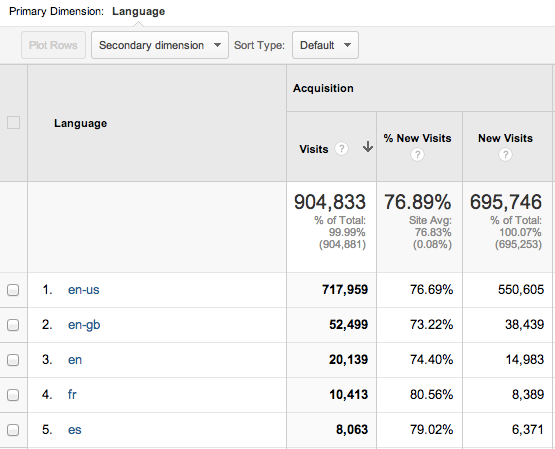
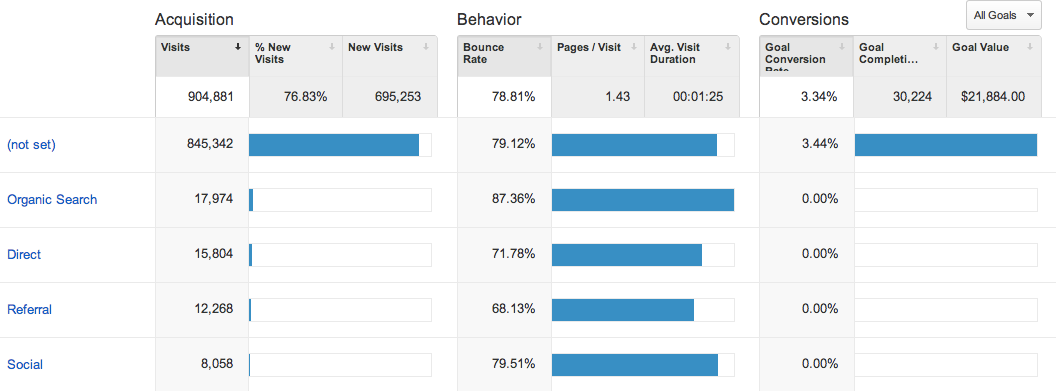
The table in the summary view is broken into three sections: Acquisition, Behavior, and Conversions. Acquisition includes the number of visits, percentage of new visits, and new visits.
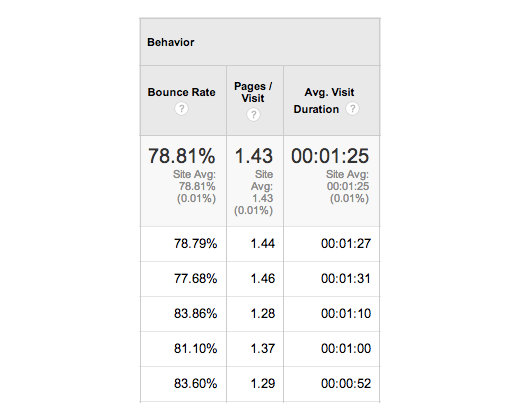
Behavior includes bounce rate, pages per visit, and average visit duration.
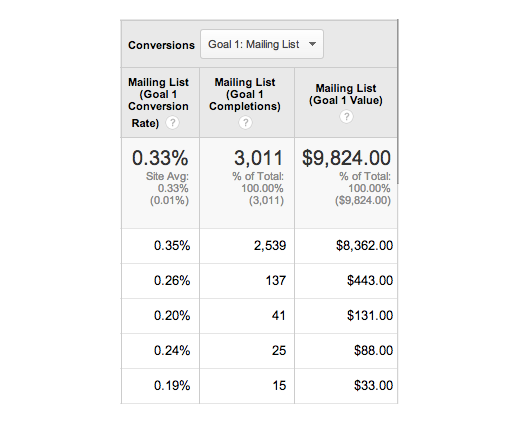
Conversions includes the conversion rate, completions, and value of each of your goals. To view a specific goal, use the dropdown at the top to select it.
Now, let’s look at what you can learn from the conversions data in the summary view throughout the standard reports.
Audiences and Conversions
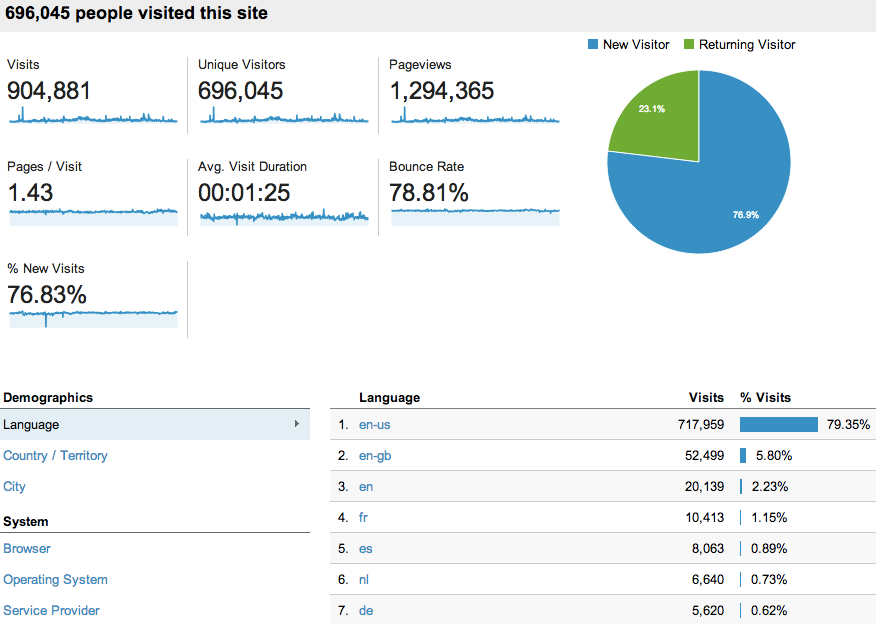
Analyzing the types of visitors that convert on your website can help you in a variety of areas of your online marketing. Here are some important groupings of audience data to review:
Demographics – With a small change in your tracking code, you now can get data from Google in the Demographics section that shows your visitors’ age groups and gender.
If you have a defined buyer persona (such as women in their late twenties), this can help you determine whether your website is attracting and converting visitors in those groups. If you have not defined a buyer persona, this can help you determine who converts best on your website (such as males and females in their early thirties) and aim more of your online marketing campaigns toward those groups.
You also can dig deeper by choosing secondary dimensions alongside the age and gender data. This can show you such things as whether you are getting more conversions from males or females who came to your website from Facebook (so you can target your ads accordingly) or whether a specific website’s referral traffic sends more younger or older people (so you can tailor your landing page toward the right age group).
Interests – Another new section of information within Google Analytics is Interests. Within Affinity Categories and Other Categories, you’ll find the general interests of your audience and the most important interests of your converting visitors. This can help you determine what topics to write about, what types of sites to advertise on, and what audiences to target with your landing pages.
Think about it. If you have a mobile app and you notice that people interested in music tend to click thorough to download it for their iPhone, you might want to target ads toward people on Facebook who are interested in music.
Geo – The location data of your converting visitors can help you target your online advertising to people in specific cities, regions, and countries. Instead of wasting impressions and clicks on people in the countries least likely to convert, you can focus on bringing more qualified traffic back to your website to further boost your conversion numbers.
Behavior – Do new visitors or returning visitors convert the best? Depending on your findings, you may want to focus on ways to acquire new traffic or on ways to get visitors back to your website again and again to increase the likelihood of conversion.
Technology – Browser compatibility is a must for website design. If you notice that you get a near equal number of visitors using two different browsers (currently, the most popular are Chrome and Firefox), but the conversion rate for one browser is significantly lower than for the other, you may want to run some tests to make sure there isn’t a compatibility issue that is hindering your potential customers from completing a goal on your website.
Mobile – If your website isn’t mobile friendly, it will show in your conversion rate percentage when you compare visitors using desktops, mobile devices, and tablets. You also can look under devices to see if you are converting particularly well with Apple vs. Android users. Why is this important? Aside from knowing what mobile platform you need to test your website with, you can use this information to determine whether a mobile app could help in building loyalty and increasing sales.
Acquisition and Conversions
Formerly Traffic Sources, the Acquisition section of the standard reporting essentially tells you where your website’s traffic is originating. With conversions built into the following areas, you can quickly find out which online marketing strategies are affecting your bottom line.
Channels – For a quick view of which online marketing strategies are driving the most converting visitors to your website, look under Channels. You will be able to see quickly whether your organic search, direct, referral, social, email, or other traffic sources complete the most goals. You can learn more about each by clicking through for more details.
Organic search leads to your keywords (mostly not provided); direct and email lead to the landing pages people go to directly; referral leads to the domains referring the most traffic to your website; social shows the top social networks driving traffic to your website; and other shows various referrals.
Once you know which online marketing strategies and promotions are leading to the most conversions, you will know where you want to focus more (or less) of your budget for future campaigns.
All Traffic – If you want to bypass the categories of traffic and just see the top traffic sources driving converting visitors to your website, look under All Traffic. This area includes everything – organic search, direct traffic, referral traffic, and so forth.
Referrals – Referrals shows all visits from people from another website (excluding organic search, paid search, and direct visits). Here, you can dig deeper by clicking on the domains referring traffic to your website to see the specific pages within the domain that are sending traffic your way, aligned with the conversions for each of those internal pages. For example, if you contribute content regularly to other sites, you can find out which pieces of content have led to the most conversions.
Campaigns – Do you use UTM parameters to tag your links for in-depth tracking of your online marketing campaigns? If so, you can look under the Campaigns section to see which campaigns have led to the most conversions. You also can click each campaign to see the specific sources and mediums that contributed to the most conversions per campaign.
This can help you separate online marketing campaigns that would be hard to distinguish otherwise, such as social advertising using Facebook or LinkedIn Ads, email campaigns, and others that are not easily defined in the basic traffic sources reporting.
Keywords – Unless you’re paying for AdWords, your Keywords section is going to look very bleak with mostly (not provided). If you have had Google Analytics and goals set up for a while, you can look back through your historical data to see which organic keywords were converting well in the past and go from there.
AdWords – If you run AdWords campaigns and have connected your Google AdWords to your Google Analytics, this section will help you identify the campaigns, keywords, matched search queries, day parts (times throughout the day), destination URLs, and placements that lead to the most conversions.
Since running AdWords campaigns can be quite costly, this probably is one of the top areas you should analyze so you can determine which campaigns are worth investing in and which ones should be halted based on conversion value.
Social – Unfortunately, most of the Social section does not have a summary view like the others above do. However, you can look at conversions under Social to see the social networks that have driven the most conversions and the total conversion value for each network. This is a quick way to determine which social networks generate the most revenue for your business.
Behavior and Conversions
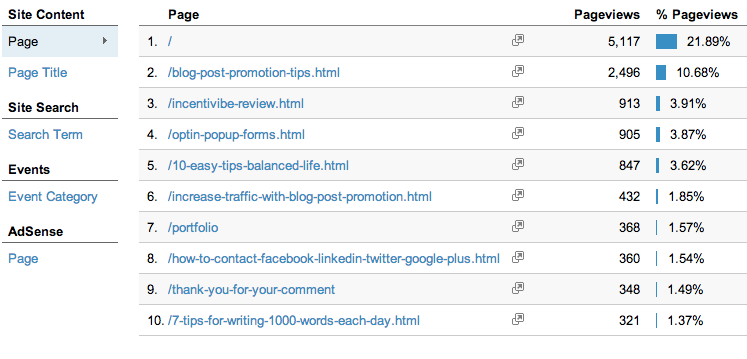
Formerly the Content section, Behavior shows you information about visitors to your content, along with the resulting conversions.
If you want to see what content is driving conversions, then you will need to look at your landing pages under Site Content (i.e., the pages that visitors enter your site on). Knowing your top landing pages can help you determine approximate keyword phrases that are driving traffic to your website (based on the targeted keywords for the page).
For example, it might be safe to assume that if your top landing pages all have Facebook in them, keywords related to Facebook will lead to higher conversions. Once you know which keywords and landing pages convert best, you can create more content on your website that is likely to convert.
In Conclusion
Thanks to the recent changes in Google Analytics, you can learn a lot more about the audiences, online marketing strategies, and content that are leading to conversions. This knowledge can help you improve all aspects of your online marketing, from defining buyer personas to creating a successful content calendar going forward. Be sure to peruse each of these standard reporting areas and learn more about the traffic that completes goals on your website today.
What have you learned from analyzing conversion data in Google Analytics? Please share in the comments.
About the Author: Kristi Hines is a freelance writer, professional blogger, and social media enthusiast.
Comments (9)