Anyone who has ever worked in marketing or advertising has heard the quote, “Half the money I spend on advertising is wasted; the trouble is I don’t know which half.” It is from John Wanamaker and dates back to the 19th century.
Fortunately, the industry has come a long way since then; and, especially in the last 10 to 20 years, new technologies have made advertising more measurable than ever. However, there’s still a considerable gap between what people could measure and what they actually are measuring, and that leads to significant under-optimization of advertising and marketing dollars.
In B2B SaaS, there are two techniques that I feel are particularly important but not used widely enough – cohort analysis and multi-touch attribution analysis. In this post, I’ll try to provide a brief introduction to both methodologies and explain why I think they are so important.
1. Cohort Analysis
A Quick Primer
If you’re new to the topic, cohort analysis can be broadly defined as a dissection of the activities of a group of people (such as customers), who share a common characteristic, over time. In SaaS businesses, the most frequently used common characteristic for grouping customers is “join date”; that is, people who signed up or became paying customers in the same period of time (such as a month).
Let’s look at an example, and it will become much clearer:
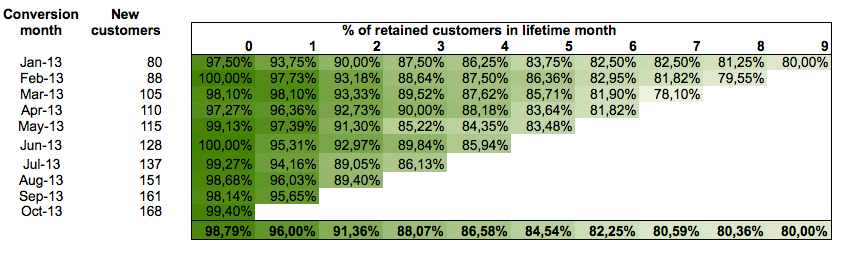
In this cohort analysis, each row represents all signups that converted to become paying customers in a given month. Each column represents a month in your customer’s life. The cells show the percentage of retained customers of the respective cohort in the respective “lifetime month.”
So What?
Why is it so important to do a cohort analysis when looking at usage metrics or retention and churn? The answer is that if you look at only the overall numbers, such as your overall churn in a calendar month, the number will be a blend of the churn rate of older and newer customers, which can lead to erroneous conclusions.
For example, let’s consider a SaaS business with very high churn in the first few lifetime months and much lower churn from older customers, which isn’t unusual in SaaS. If the company starts to grow faster, the blended churn rate will go up, simply because the percentage of newer customers out of all customers will grow. So, if they look at only the blended churn rate, they might start to panic. They would have to do a cohort analysis to see what’s really going on.
What else can you see in a cohort analysis? Whatever the key metrics are in your particular business, a cohort analysis lets you see how those metrics develop over the customer lifetime as well as over what might be called product lifetime:
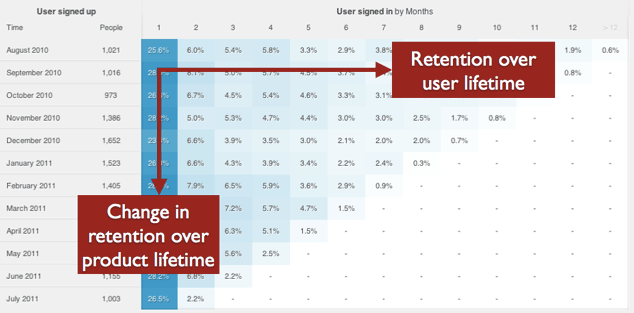
If you read the chart above horizontally, you can see how your retention develops over the customer lifetime, presumably something that you can link to the quality of your product, operations, and customer support. Reading it vertically shows you the retention at a given lifetime month for different customer cohorts. This might be called product lifetime; and, especially if you look at early lifetime months, it can be linked to the quality of your onboarding experience and the performance of your customer success team.
The Holy Grail of SaaS!
Maybe most importantly, a cohort analysis is the best way to estimate CLT (customer lifetime) and CLTV (customer lifetime value), which informs your decision on how much you can spend to acquire a new customer. As mentioned above, churn usually isn’t distributed linearly over the customer lifetime, so calculating it based on the blended churn rate of the last month doesn’t give you the best estimate. A better way is shown in the second tab of this spreadsheet, where I calculated/estimated the CLT of different cohorts.
A cohort analysis is even more essential when it comes to CLTV. Looking at how revenues of customer cohorts develop over time lets you see the impact of churn, downgrades/contractions, and upgrades/expansions:
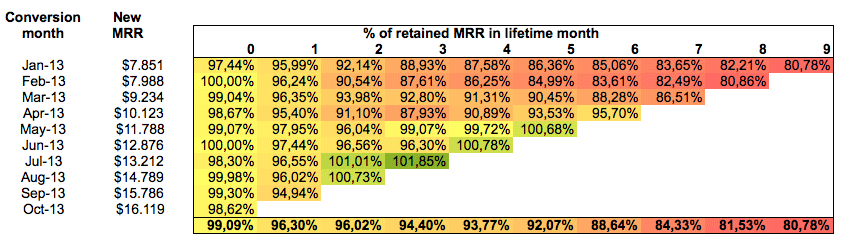
This chart shows a cohort analysis of MRR (monthly recurring revenue) of a fictional SaaS business. As you can see in the green cells, it’s a happy fictional SaaS business as it has recently started to enjoy negative churn, which many regard as the holy grail in SaaS.
Still not convinced that you need cohort analyses to understand your SaaS business? 🙂 Let me know in the comments.
2. Multi-touch Attribution Analysis
Giving Some Credit to the “Assist”
Multi-touch attribution, as defined in this good and detailed post, is “the process of understanding and assigning credit to marketing channels that eventually lead to conversions. An attribution model is a set of rules that determine how credit for conversions should be attributed to various touch points in conversion paths.”
It’s easier than it sounds. Let me explain it using a soccer analogy. Multi-touch attribution gives the credit for a goal to not only the scorer but also (gives some credit to) the players who prepared the goal, too. Soccer player statistics often calculate scores based on the goals and the assists of the players. That means the statistics are based on what could be called a double-touch analysis that takes into account the last touch and the touch before the last one.
Since the default model in marketing still seems to be “last touch” only, it looks like soccer has overtaken marketing in terms of analytical sophistication. 🙂
Time for Marketing to Strike Back!
If you are evaluating the performance of a marketing campaign solely based on the number of conversions, you are missing a large piece of the picture. Like a great midfielder who doesn’t score many goals himself but prepares goals for the strikers, a marketing channel might not be delivering many conversions but could be playing an important role in initiating the conversion process or assisting in the eventual conversion.
This is especially true for B2B SaaS where sales cycles are much longer than in, say, consumer e-commerce. When you’re selling a SaaS solution to a business customer, it’s not unusual for there to be several touch points before a company becomes a qualified lead, and then many more before the lead becomes a paying customer. The process could easily look like this:
- A piece of content that you produced comes up as an organic search result and the searcher clicks on it
- A few days later, the person who looked at the content piece sees a retargeting ad
- A few days later, she sees another retargeting ad, visits your website, and signs up for your newsletter
- A week after that, she clicks on a link in your newsletter
- A few days later, she receives an invitation to a webinar, signs up for it, and attends the webinar
- After the webinar, she signs up for a trial
- The next day, one of your customer advocates gives her a call
- Close to the end of her trial, your lead does some more research, happens to click on one of your Google Ads ads, and signs up for a paid subscription
If you look at this conversion path, it becomes clear that if you attribute the customer to only the first touch point (SEO) or to the last one (PPC), you’ll draw incorrect conclusions. And keep in mind that the example above is still quite simple. In reality, the number of marketing channels and touch points that contribute to a conversion can be much higher.
Data Integration in a Multi-device World
Maybe you use Google Analytics for Web analytics, Salesforce.com for CRM, and Zendesk for customer service. If you want to get a (more or less) complete picture of your user’s journey, you need to get and integrate the data from all of the major tools you’re using and track user interactions.
A big complicating factor here is that we now live in a “multi-device world.” It’s very possible that the person in the example conversion path above used a tablet device, a smartphone, and two different computers to access your content and visit your website. Since tracking cookies are tied to one device, there’s no simple way to know that all of these touch points belong to the same person, at least not until the person registers.
Going deeper into the data integration and multi-device attribution problem would go beyond the scope of this post, but there’s a lot of valuable information available on the Web. And, please feel free to ask questions or share experiences in the comments section.
Toward a Better Attribution Model
The next question to tackle is how credit should be distributed to touch points in a conversion path. A simple approach is to use one of these rules:
- Linear attribution – Each interaction gets equal credit
- Time decay – More recent interactions get more credit than older ones
- Position based – 40% credit goes to the first interaction, 40% to the last one, and 20% to the ones in the middle
While using one of these rules is a big improvement over a “first touch only” or “last touch only” model, the problem is that all of the rules are based on assumptions as opposed to real data. If you’re using “linear attribution,” you’re saying “I don’t know how much credit each touch point should get, so let’s give each one equal credit.” If you’re using “time decay” or “position based,” you’re making an assumption that some touch points are more valuable than others, but whether that assumption is true is not certain.
A more sophisticated approach is to use a tool that takes a look at all touch points of all users (including those who didn’t convert!) and then uses a statistical algorithm to distribute attribution credit. The advantage of this approach is that the model gets continuously adjusted based on new incoming data. Explaining exactly how it works, again, would go beyond the scope of this post, but there’s more information and tools like this on the market.
Is It Worth It?
Implementing a sophisticated multi-touch attribution model is obviously a large project, and so the next question is whether it’s worth it. The answer depends mainly on these variables:
- Product complexity and sales cycle – The more complex your product and the longer the sales cycle, the more likely you are to have several touch points before a conversion happens
- Number of simultaneous campaigns and size of marketing budget – The more campaigns you’re running in parallel and the more you’re spending on marketing, the more important it is to account for multi-touch attribution
While cohort analysis is something you should do as soon as you launch your product, I think multi-touch attribution analysis can usually wait until you’re spending larger amounts of money on advertising. Until then, spending too much money or time getting your attribution model right probably is not the best use of your resources. So, as an early-stage SaaS startup, don’t worry too much about it just yet. Just remember to take your single-touch attribution CACs with a grain of salt.
About the Author: Christoph Janz is a renowned SaaS expert and founder and partner of Point Nine Capital. He’s an investor in Zendesk, Geckoboard, Unbounce, Typeform, and more than 15 other SaaS companies. Check out his blog for further SaaS tips and resources, and follow him on Twitter.
Comments (16)