There’s one important thing we have to get out of the way:
Growth has nothing to do with tactics; it has everything to do with process.
So says Brian Balfour, former VP of Growth at Hubspot.
You hear all the time about X company tripled their growth by doing X hack. The fact is that it worked for them, and it’s unlikely to work for you.
Balfour spoke at 500 Distro, where he outlined the process he uses for growing companies. Below are the notes from that talk.
The Four Reasons to Focus on Process Before Tactics
Balfour is asked all the time what tactics or hacks work best. This is the wrong question to focus on. Why?
1. What Works For Others Is Not Going to Work For You
You hear all the time about how this one tactic worked for this one particular company. You go apply it in your business and don’t get nearly the same results. Would you expect anything else?
Your audience, product, business model, customer journey, and business are different. When you hear others speak on growth and what worked for them, take that as inspiration and not a prescription.
You need a process to find the unique combination of things that will work for you.
2. Growth Is The Sum of A Lot of Small Parts
We’ve all seen impressive growth charts, like this one from Slack:
It’s not one thing that Slack did that led to this growth. It’s all the little things they did to get to where they are now.
Just like in your business, it’s not going to be one thing that changes the growth curve of your business. There is no silver bullet.
3. The Rate of Change Is Accelerating
The foundation of every channel is changing.
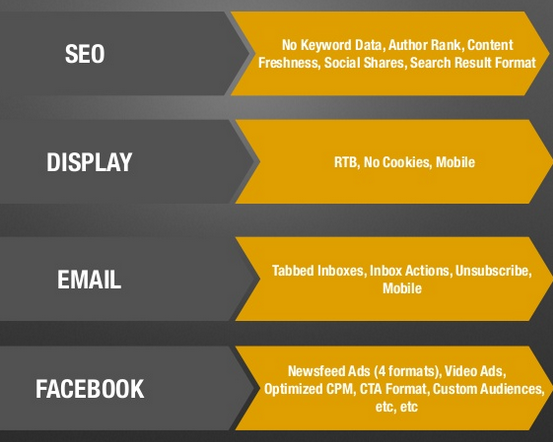
Viral channels come and go. Things are constantly changing, and you need to be constantly changing. You need a way of continuously finding the new things that will move the needle.
4. You Need a Machine
Your machine needs to be scalable, somewhat predictable, and repeatable. It must be repeatable.
Machines produce something. In our case, they produce tactics. This is the output. The inputs to the machine are the process that you drive to discover and test all the tactics.
There are four goals of the process:
- Rhythm: You need momentum. To do this, you establish a regular cadence of experimentation to fight through failures, find the successes, and find the momentum that keeps carrying you forward.
- Learning: This is probably the most important goal. It’s constant learning about your customer, product, and channels. Feed that back into the process to build off that base of knowledge. This will keep you moving forward towards success.
- Autonomy: If you have a growth team, it’s key to let them be autonomous. Individuals decide what to work on to achieve team goals. The team leader doesn’t provide specific directions.
- Accountability: People on the growth team don’t always have to be successful. They don’t have to hit 100% success on experiments. But, the expectation is that they improve overtime in terms of their knowledge of customer, product, and channels. Building a stronger base of knowledge means you’ll have more successful experiments.
How to Set Goals
Before beginning, you first need to know where you’re going. Part of this is setting goals. Balfour and his team use the Ojective and Key Results (OKR) framework.
Using this framework, they first ask themselves a question to form their objective. They want to know the one thing they can achieve that will drive the biggest impact on the growth curve. This requires them to take a step back and examine things before they dive into experiments. Once they have this, they form their qualitative statement.
After they have their statement, they set a time frame, which is 30-90 days. Anything shorter than 30 days means they’re not being aggressive enough. Over 90 days and they’re biting off too big of a chunk. It needs to be something they feel they can make reasonable progress on in 30-90 days.
Once they have their objective and time frame, they set three key results. These are quantitative measurements that indicate if they’re achieving an objective. The results are ordered by difficulty.
In KR1 (Key Result 1), Balfour and his team hit these about 90% of the time.
KR2 signals that they go above and beyond; they usually hit this about half the time.
If they hit KR3, it’s party time. These are rare, only hitting about 10% of the time, and call for a celebration. They’re typically hit about once a year. If they’re hit more often, their goals aren’t aggressive enough. If they’re not hitting KR1 nearly every time, then they’re too aggressive.
Once they figure all this out, they get to work as quickly as they can.
The Cycle After OKR Is Set
Once the OKR is figured out, they move into this cycle:
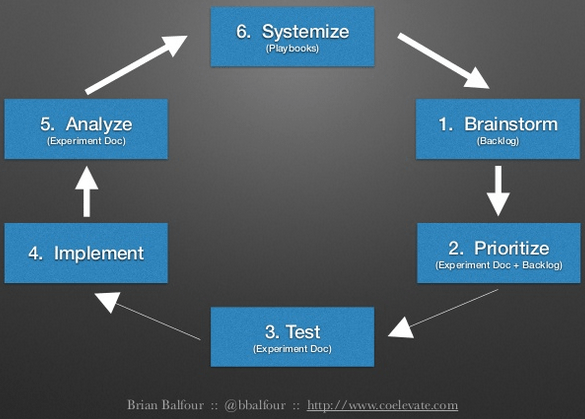
Under each phase, you’ll see the names of documents they create. These documents help drive the process.
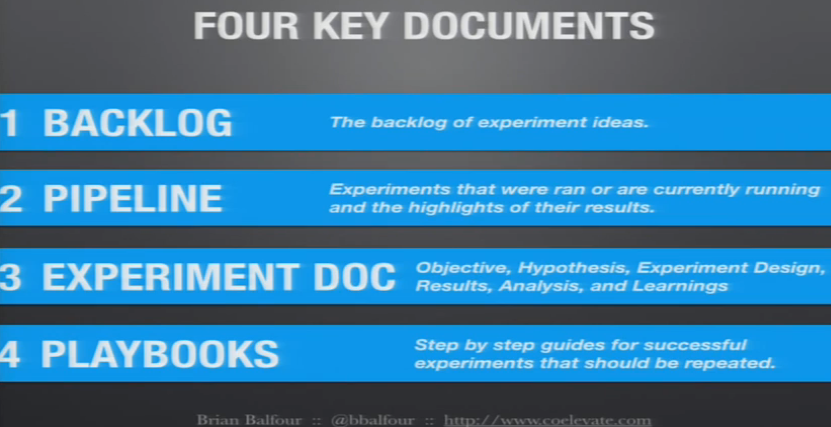
- Backlog: This is where all the ideas are dumped. This doc is a spreadsheet, and contains the experiment name, status, category (area you’re trying to improve), metric, prediction, and a resource estimate of how much time it will take marketing, engineering, design, and anybody else.Anybody on the team can contribute ideas to the backlog, it’s a public document within the company. This document allows them to empty their head space and focus on the idea they’re currently executing.
- Pipeline: This is the list of experiments past, present, and future. All past experiments have their results documented. This allows new team members a chance to go back and look at every experiment to show how they got to where they are today.
- Experiment Docs: This is the most important document out of the four. Every experiment gets one of these. This document forces the team to think through the important elements of the experiment. When going through this document, they have to think about why they’re doing this experiment vs the others, what they expect from the experiment, how they’re going to design and implement the experiment, and record the learnings.
- Playbooks: If an experiment is successful, they try to figure out ways to systematize them. They’re step-by-step guides for things they want to repeat.
A Breakdown of Each Phase
Let’s elaborate on each phase in the process.
1. Brainstorm
In this phase, focus on brainstorming on the inputs, not the outputs.
Let’s say your OKR is set on improving an activation rate. Don’t sit there and try to figure out how to improve activation rate. There are probably thousands of ways to improve it, and focusing on this makes it difficult to come up with growth ideas. Instead, focus on breaking it down into very small pieces.
If the activation rate had three steps, you’d break down each and brainstorm ideas around each step. Keeping it focused on each step makes it easier to come up with specific ideas about how to improve the inputs, which leads to an improved output. Balfour and his team use four ways to generate growth ideas (taken from the book Innovator’s Solution):
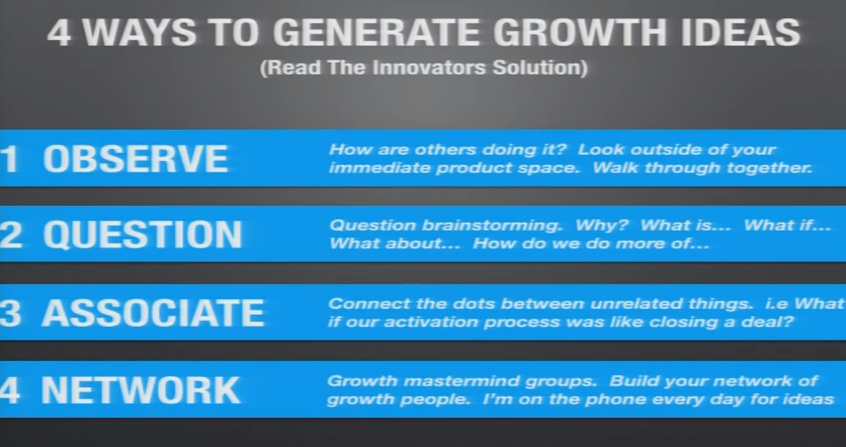
- Observe: Look at how others are doing it, both in your competitive and non-competitive space. If you have the goal of optimizing your referral program, look at other companies referral programs. Every member on your growth team should select a couple programs they like, and the team can walk through each program. You’ll develop a ton of new ideas with this process. When seeing what other companies do, take it as inspiration, not a prescription. Take inspiration from them, and figure out how to apply it with your product and audience.
- Question: A common exercise in this category is called “question brainstorming”. This is an hour-long meeting that consists of nothing but questions. Team members write questions on notes, announce the question, and put it on the board. They ask as many questions as possible during this time period. This does two things. First, it helps reveal things they don’t know. Second, good answers start with good questions. The questions allow members of the team to start digging for answers. As they learn the answers to the questions, a ton of ideas on how to play off those answers tend to pop out of this process.
- Associate: There’s a technique called smashing, where you take what you’re trying to improve and smash it with something completely unrelated. You learn from other processes and try to apply it to your experiment.
- Network: Find a network of good growth people. Go to conferences, attend meetups, chat with others on the phone, etc. Exchange ideas with them – what you’ve been working on, what did or didn’t work, what you learned, etc. You’ll get ideas from others too, and will be able to feed it back into the process at your company. Once again, you get inspiration from others, not a prescription.
Once you have gone through this process, you create the backlog doc.
2. Prioritize
This is where you prioritize what to first work on in the backlog.
Before we (humans) dive into a new idea, we tend to overestimate that probably of success. We inflate the impact of a success. And we underestimate the amount of time it’s going to take to test and implement. Because of these realities, it’s important to be brutally honest with three elements.
The probability that it will be successful, the impact it will have if it is successful, and the resources required to test and implement.
Probability is low, medium, and high. A high probability is usually an iteration that comes from a previous learning on an older experiment. If it’s low probability, it’s something that’s new that no one on the team knows anything about. Impact is the most important one.
Every experiment idea has a hypothesis that looks something like this:
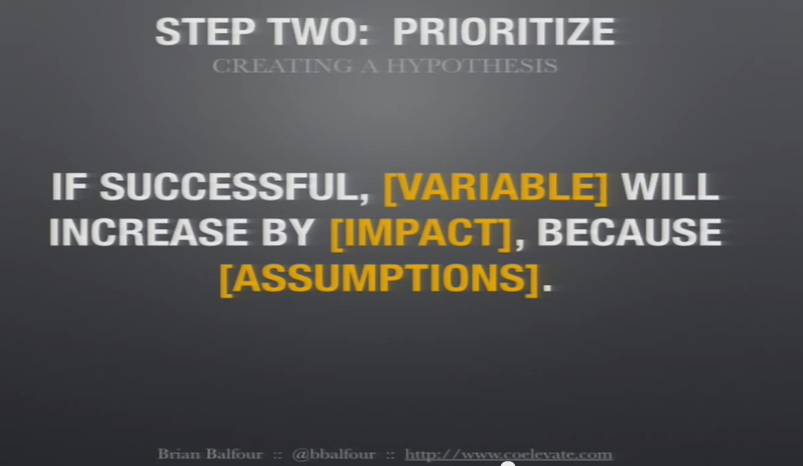
This format is great because it forces you to think through how it will work. If you look at this and say “I have no idea”, then you haven’t done your homework on the experiment.
There are three areas to look for when justifying your assumptions.
The first is quantitative data. This mostly comes from previous experiments and some data collection in your product. For example, if you know testimonials increase conversions on your invite page, maybe adding it to other relevant areas will improve conversions.
The second is qualitative data. This comes from things like surveys and support emails. If patterns are detected, that should be enough to justify an assumption.
The third is secondary data with things like networking, blogs, competitor observation, etc. If someone else saw a lift doing this experiment, it provides a data point because it has worked before.
Start with low resource projects first. They’ll go faster, which allow you to get more experiments in. This will help you find the wins quicker, which accelerates your growth curve.
Once you have all this (assumptions and hypothesis), you create your experiment doc. Once you have a few, you can sit down and compare them to find which experiment to start.
3. TEST
Once it’s all prioritized, it’s time to create a Minimum Viable Test. It’s the minimum thing you can do to get data around your hypothesis. Outline the test in the experiment doc.
4. TEST
Not much to talk about here; just get the implementation done as quickly as possible. Don’t fall prey to analysis paralysis at this stage as it’ll kill your productivity and progress.
5. Analyze
Once a test is done, it’s time to analyze. This is the most important step.
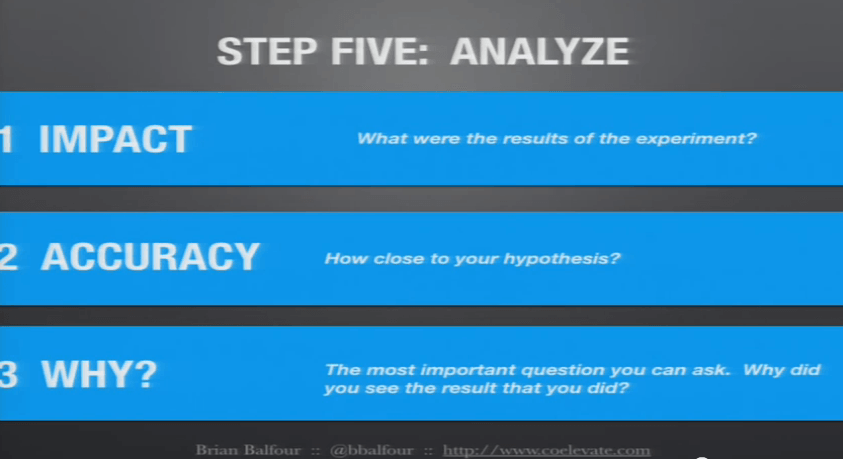
Answering the ‘why’ is key. Why did it succeed, or why did it fail? Why were we close or way off from our hypothesis? Digging into why will help you understand things about your customer, channel, and product. This will lead to iterations and new ideas of experiments you should run next. Skipping this question means you’re blindly running experiments; you’re not taking what you learned into the next experiment.
Extract as many learning points as you can out of every experiment. List the iterations/action items and throw them into the backlog. Take the learnings, look at your backlog, look at your prioritization, and adjust accordingly based on your findings.
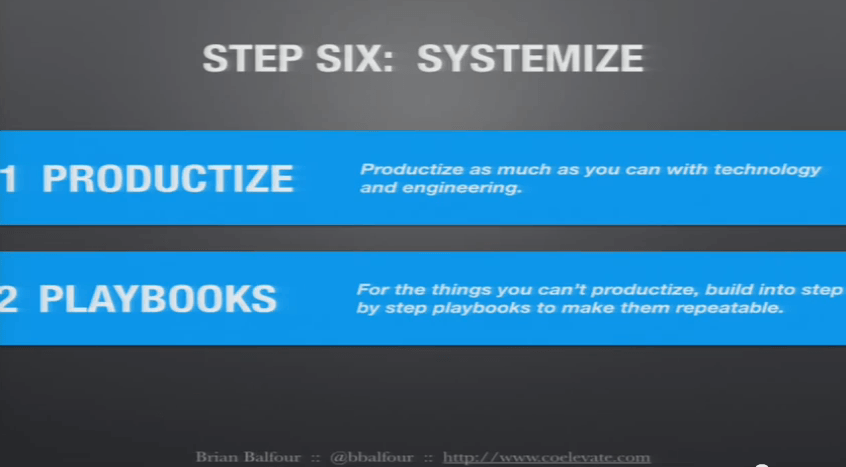
6. Systemize
Once you find experiments that are successful, “productize” them with technology and engineering. If you can’t do it with technology and engineering, build into playbooks. As you hire and scale the team, you can point them to the playbooks so they know what’s going on and can repeat with minimal effort.
What a Week Looks Like
Balfour and his team hold one growth meeting every week:
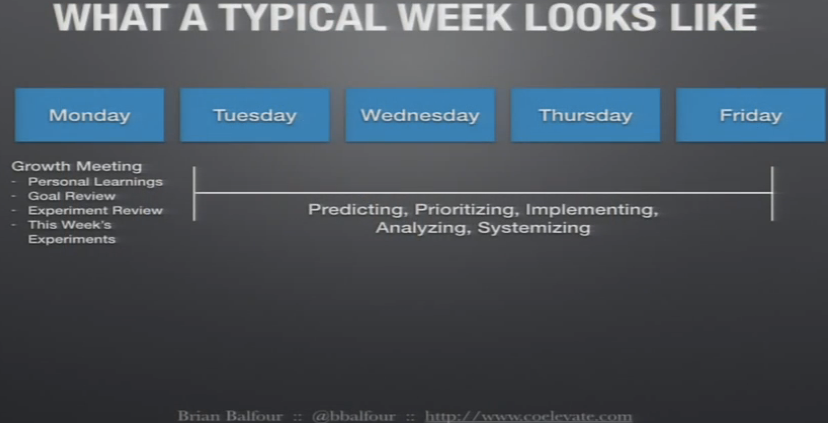
It’s a 60-90 minute meeting, they start off by discussing personal learning points, where every team members states one thing they learned about the customer, product, or channel last week. Something is seriously wrong if everybody is not learning at least one thing.
Then they review the OKRs and the progress for each of them. If they’re not on track, they’ll talk about how they can get back on track.
Then comes experiment review, where they pick out the key experiments that led to the most analysis. The people who owned the experiments share what they learned. Based off those learnings they discuss what experiments they’re going to implement for this week.
The rest of the week is dedicated to all the other steps. They try to repeat the cycle as much as possible.
The team is always zooming out and zooming in. They zoom out and look at the big picture when setting OKRs and zoom in for 30-90 days when they run experiments. They ask themselves if they’re working on the right things when zoomed out. In the zoom-in phase, they’re just cranking through the cycle as fast as possible.
After they go through a few experimentation cycles (typically done once every quarter) they take a step back and look at the macro optimization:
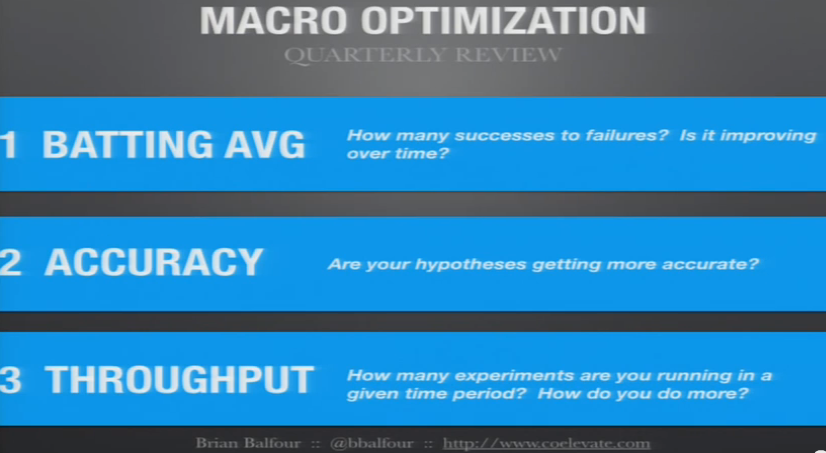
The more you know a channel, the more accurate you should get
You can optimize these in three ways. You can get better at process, get better with your team, or you can get better with tools and instrumentation.
About the Author: Zach Bulygo (Twitter) likes marketing, finance, and learning about different businesses.
Comments (2)