Facebook Insights is a pretty powerful tool for those wanting to track user interaction on their Facebook Fan Page. Facebook Insights can be seen by all the admins of your page and it can help you track the number of active users to better understand page performance.
By using Facebook Insights you’ll be able to determine the best time of day to post, the best day of the week to post and what type of content is most popular. It is important to note that the Facebook Insights tool is constantly updated to reflect your page’s developments and any patterns that may form. So you’ll need to keep checking back to keep in the loop.
Here are some useful steps for individuals new to Facebook Insights:
1. How to Access Facebook Insight
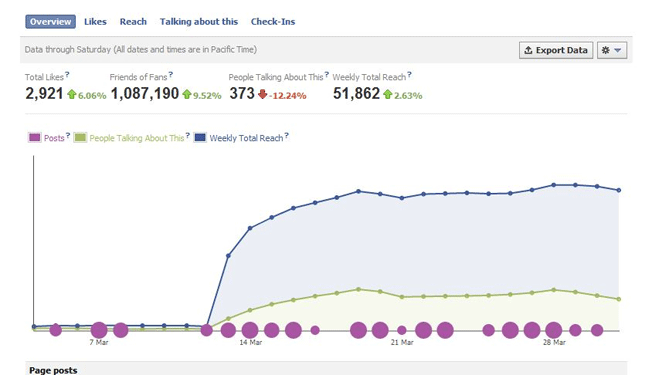
Click on the gear wheel on your Facebook Fan Page and select ‘View Insights’. You’ll see a graph like the one below.
This is the main Insights dashboard and here you’ll see the total number of likes (and whether this is increasing or decreasing), the number of friends of fans available (this is the potential number of people you can reach!), how many people are actively talking about your page as well as your total weekly reach.
2. Virality of Posts
Below the graph you’ll see your latest posts and learn about their virality. This is especially useful if you would like to see which posts were the most successful.
You can sort posts by the following types:
- all post types
- posts
- photos
- links
- videos
- platform posts
- questions
This is useful if you want to know the success of a certain post (i.e. a video you posted recently). So instead of sifting through all the posts, you can simply sort by videos.
You’ll be able to see the date the post was made, the title of the post, its reach, how many users engaged with that particular post, how many spread the word about it, as well as its virality in a percentage form.
Takeaway: Knowing the virality of the post gives you the knowledge to create more content that your fans like, which will then increase your branding, reach and hopefully traffic.
3. Likes
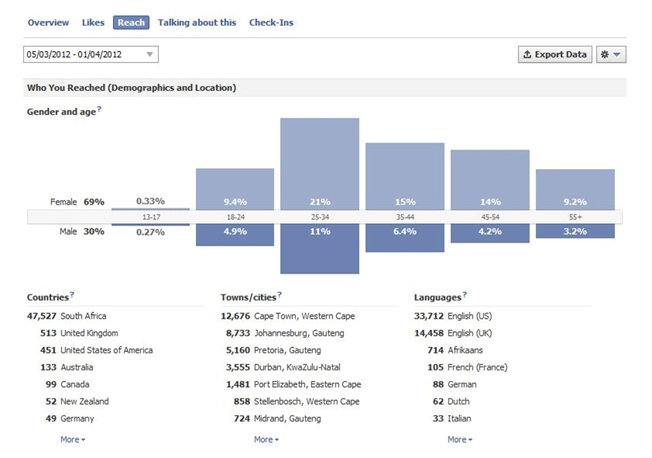
If you click ‘Likes’ you’ll be able to see the demographics as well as the locations of your fans. You’ll also be able to see their age groups. In this case, our Cheap Flights South Africa fan page has a much larger female fan base than a male fan base. We are also able to see that most users are situated in Cape Town, South Africa and hence we can customize our posts accordingly.
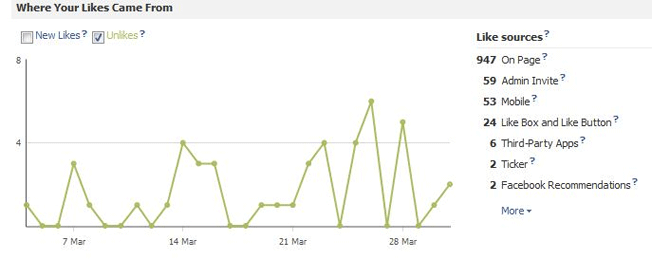
Below you’ll see another graph that looks like this:
Now you can search by new likes and even by unlikes. For example, on the above graph you can see that our fan page had some unlikes. Dammit! It would be useful to go back to your page and see what posts you wrote on those days. Your previous posts may be able to give you an indication as to what went wrong that day. Weren’t you entertaining enough? Or were you just too much? Perhaps you posted too many articles and not enough images? It is crucial that you do this step otherwise the stats are pretty much just stats.
Takeaway: Having demographic information about your fans allows you to build personas of your target audience. This can be very beneficial when creating landing pages, home page copy and overall marketing messages.
4. Reach
It’s all very good and well that you have a Facebook fan page, but how much of your content is actually reaching your fans? Who is talking about your page? Are any of your fans referring your page to others or sharing your images with their friends?
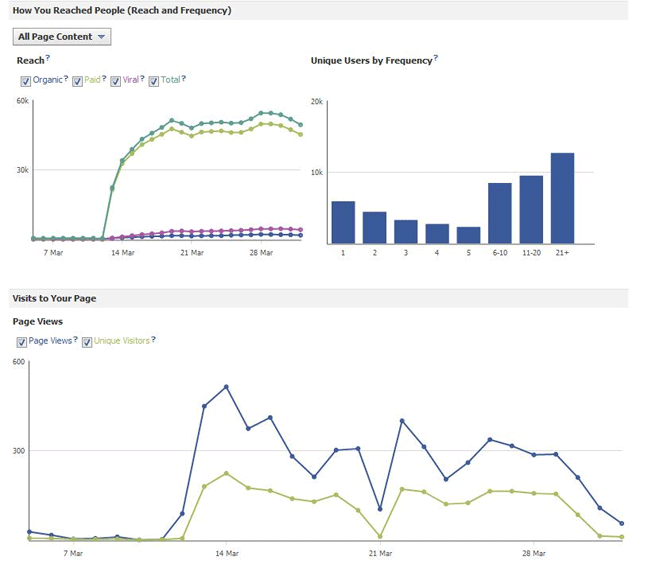
This section helps you see your page views and unique visitor views (those who searched for you as opposed to clicking on the Facebook ad). You’ll also be able to see your reach in terms of organic searches, paid and viral searches.
Takeaway: The important part of the Reach area is that you will be able to see what channels (organic searches, paid and viral) are the most effective. Most likely, you’ll want to increase the viral segment as much as possible.
5. Talking About This
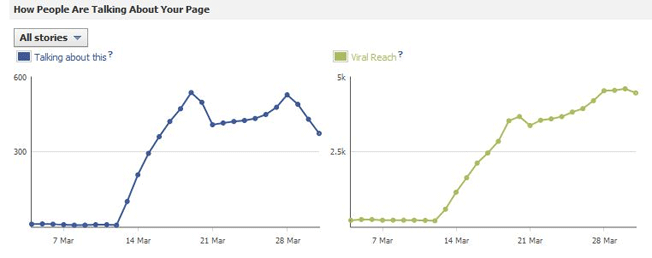
As you can see below, our Cheap Flights South Africa Facebook page didn’t have that much interaction before the 14th of March when we implemented our Facebook advertisements. Our page went from roughly 5 people talking about it per day to 537 at its peak!
The Talking About This section can also provide valuable data about who is talking about your page – this includes demographics and percentages of people in different age groups.
Takeaway: The important thing to learn from this data is to understand how your content trends over time. You may find that it takes some time for your content to “lift” and reach many people. This can be very helpful when planning promotions and other time sensitive initiatives.
6. Check-Ins
This section is not really relevant for our page since Cheap Flights South Africa is internet-based. However, check-ins can be really useful for companies that have a physical location. Fans that ‘check-in’ when they arrive at your business show their loyalty to you in doing so.
Under the check-in section you’ll be able to see the number of people who have checked in, where they live, whether they are male or female etc.
Takeaway: Check-in data is extremely valuable for businesses with a physical presence. From being able to measure the social media impact on sales, to monitoring your busiest days – definitely dig into this info!
7. Want More Detailed Data?
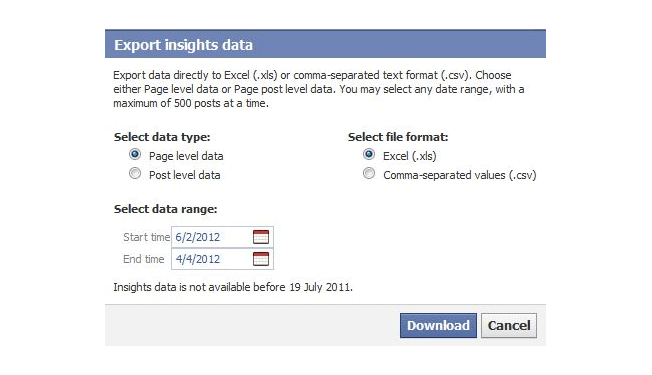
Export your data using the top right button on the Insights page. This little block will pop up:
Select Page Level Data and the MS Excel format option. You can choose a date range for the data.
Once you’ve downloaded the insights you’ll see never-ending columns of data which may at first seem overwhelming. At the bottom, you’ll also see various data sheets containing information such as key metrics, daily like sources, daily viral reach etc.
Each column in the key metrics sheet provides you will different information. For example, if you scroll to the Lifetime Total Likes column you’ll be able to see how many likes your page received over the dates you specified. Total Daily Reach is useful as well and here you’ll be able to see the number of people your posts may have reached (even from friends of your fans).
Takeaway: Sometimes looking at the tabulated data can give you more insights than graphs. If you’re proficient with Excel, you can slice and dice your data to find out more about your Fans and social media impact. Our recommendation: Don’t be afraid to dive in and see what’s inside!
If you want to explore this PDF export a little more, here’s a video to guide you.
Facebook Insights gives you a plethora of useful information about your Facebook page. However, the key is to take the data and create something meaningful with it. Using the data to track the performance of your page and find emerging patterns is crucial.
About the Author: Elizabeth Joss covers topics like social media, SEO, web marketing and technology.

Comments (24)