Google Analytics is arguably one of the most powerful web analytics applications available today. The fact that, like many Google offerings, it’s an entirely free program, makes it even more appealing. Version 5 of Analytics has just rolled out to many users (look for the “New Version” link at the top of your page after you’ve logged into Analytics to check it out), and there have been some fairly significant user interface changes.
Below we’ve compiled everything you need to know to get started with Analytics in general, and specifically with Version 5. (This is a beginner’s guide, aimed at users who may or may not be familiar with Analytics, and doesn’t cover some of the more in-depth features.)
A Brief History of Analytics
Google Analytics was originally developed from the Urchin on Demand software that Google acquired in the spring of 2005 (Urchin is still developed and available through value-added resellers, and is currently at version 7). The first Google-branded version was released in November 2005. In 2006, further ideas from Measure Map (developed by Adaptive Path) were integrated into Analytics when Google acquired them.
Early on, Analytics was available by invitation only, as demand for the product was very high. It wasn’t fully available to all users until nearly a year after its initial release (August 2006).
Why Use Analytics?
Analytics is a powerful application for tracking traffic patterns on your website. The fact that it’s an entirely free program, and integrates with other Google programs, like AdSense and AdWords, only makes it that much more valuable.
Considering most people already use at least some Google products, it makes sense to use Analytics, because it is such a powerful, yet easy-to-use, product.
What’s New in Analytics 5?
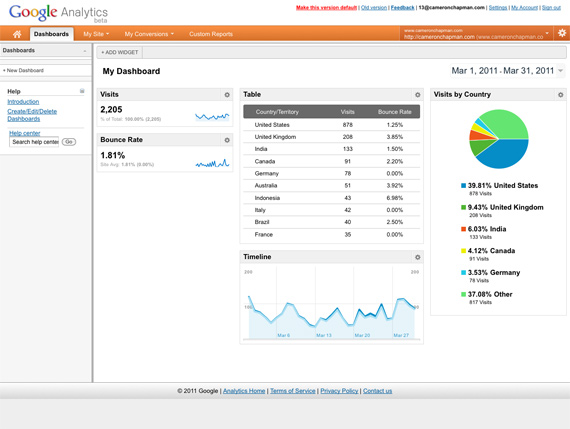
One of the biggest new features in Analytics 5 is the addition of custom dashboards. You can create custom dashboards for your sites that include whatever metrics you’re interested in. Beyond that, you can even choose how the information is displayed (table, chart, etc.).
Some beta features in Analytics 4 have become primary features in Analytics 5, including Intelligence. Another nice addition is the JavaScript interface, which makes Analytics feel like a much smoother, more professional application. Overall, the biggest changes are in the interface layout, rather than the functionality of the program.
There are also some features that have been removed from 5, including breadcrumb navigation within reports and links to external referring sites (which adds extra steps when you want to see exactly what page referred traffic to your site). The percentage change in metrics that was displayed in the chart when comparing date ranges is also missing (though the data is shown in the table below the chart). Whether these features will be added in future revisions or not remains to be seen. Since none of these affect the functionality of Analytics, they’re more of an annoyance than a real problem.
The Basic Interface
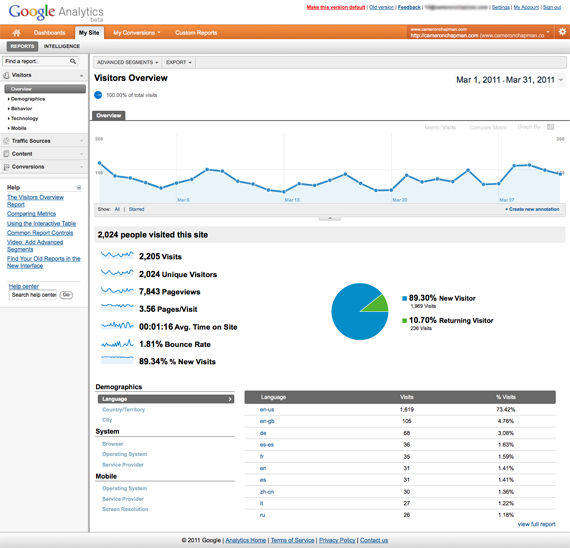
When you access the report for your site, you’ll first be brought to the Visitors Overview screen. This differs from the last version of Analytics, where you were first brought to a general overview screen that also showed information about traffic sources and content. At the top of the report, you’ll see a chart showing your traffic patterns for the past month. You can also use the dropdown to change the date this graph and the rest of your reports show (or you can choose to compare two date ranges).
On the chart, you can choose to create annotations for specific days. Say, for example, you had a review of your product on a major industry site on a particular day. You could add an annotation to that day, so that when you look back on your traffic patterns at a later date you’ll know exactly what caused a spike in traffic. You can do the same if you have a sudden drop in traffic, say if your website goes down for a few hours.
Along the left-hand side of the screen you’ll see your main report navigation. You can view more detailed reports for your Visitors from here, or switch to see overviews and detailed reports for traffic sources, content, and conversions. Below that you’ll also find Help links for common issues you might encounter.
Along the top, you’ll see more navigation. There’s an additional link for conversions there, as well as a link to custom reports. In the sub-navigation, you’ll see a link to “Intelligence”, which we’ll cover later on.
Visitors
The visitors overview is the default screen you’ll see when you view the report for any of your sites. This screen gives you the number of visitors, unique visitors, and pageviews (along with the average pages/visit). It also shows you the average time spent on your site, the bounce rate, and the percentage of new visits (a pie chart comparing new to returning visitors is also shown). This gives you a good, high-level overview of how your site is doing. High pages/visit, high average time on your site, and a low bounce rate give you an idea of how useful visitors are finding your site once they arrive.
You’ll also see that there are some basic demographics, system, and mobile reports at the bottom of the overview screen. You can view visitors by language, country/territory, or city; by browser, operating system, and service provider; and by mobile operating system, service provider, and screen resolution. The most useful reports here are the demographics reports (the system and mobile reports are more useful in a design and programming sense, than in a marketing sense, though you’ll want to make sure that your site is compatible with all the popular technical specs here).
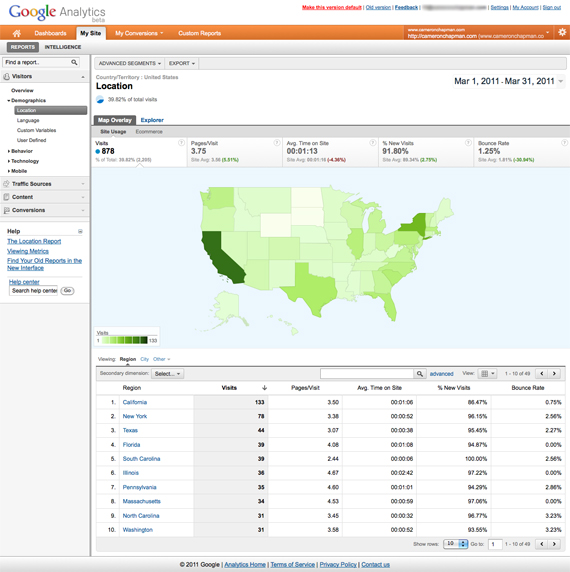
You can view more detailed reports on demographics by clicking on it in the left navigation. There you can view detailed information about your visitors’ locations (including a map overlay) or language, as well as set up user defined and custom variables for more exact reporting. On the map, if you click on any country you’ll get a larger map of that country, with more detailed information about where your visitors are coming from.
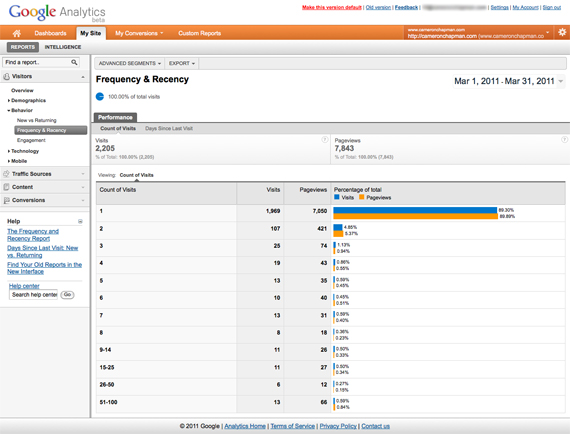
The next sub-report in the visitors section is behavior. This section gives you more information about new vs returning visitors, how frequently and recently visitors are returning to your site, and user engagement. Looking at how many visitors you have returning frequently gives you an idea of how many true fans you have. Users who have visited your site a dozen or more times are most likely fans of your site or company. These are the users you can more or less count on when asking for help in promoting a new product or otherwise getting the word out. You can also view the “days since last visit” report, which gives you an idea of how often your return visitors are coming back to your site.
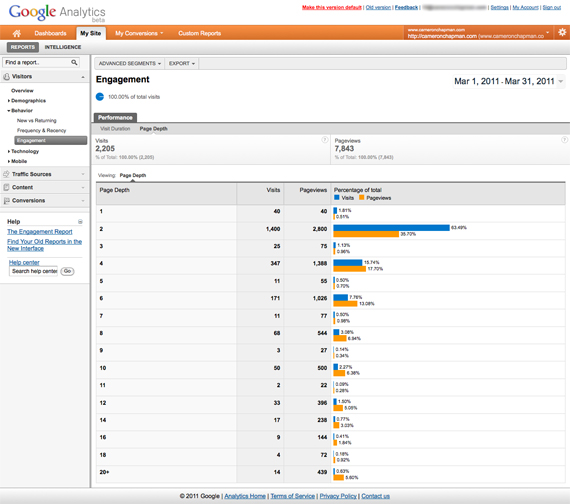
The engagement report shows you two key metrics: the visit duration and the page depth (how many pages a visitor viewed). Visitors who stay on your site longer and view more pages are more engaged. You want a high number of visitors viewing more than one page, and staying on your site more than a few seconds. If that’s not happening, these reports will tell you so.
The last two reports in the visitors section are for technology and mobile statistics. For the most part, these aren’t very helpful from a marketing standpoint. But, it is a good idea to monitor them and make sure that your site appears correctly in the more common combinations. It’s also vital to review these when you’re getting ready to redesign your site. If you still have a significant percentage of visitors coming to your site using older technology, you’re going to have to make sure your new site still appears correctly for them. Pay attention to trends, too. For example, if you see that a particular mobile platform is increasing by double-digits each month, you’ll want to make sure your site supports that platform, even if it still represents a small percentage of overall visits.
Traffic Sources
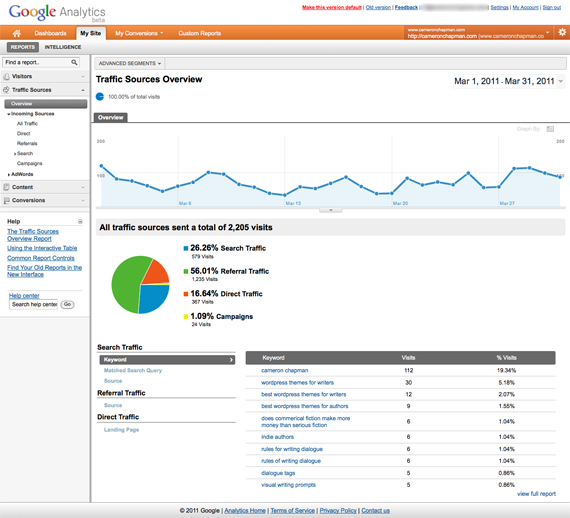
Your traffic sources overview is one of the most important parts of your Analytics account. Where your traffic is coming from tells you a lot about the strength of your SEO, your incoming links, and your AdWords and other advertising campaigns. It also shows you where your weaknesses are. Ideally, you want traffic coming from a variety of sources, so that your traffic isn’t tied to closely to a single source that’s beyond your control. For example, if 80% of your traffic comes from organic Google results, and suddenly Google changes their algorithm and your site ends up on page 10 instead of the top of page 1, you’ll see a huge drop in traffic. But if only 40% of your traffic is coming from the same source, it’s easier to compensate (in this case you might increase your AdWords spending to compensate for a lack of presence in organic results).
One of the most important reports in your traffic sources is the keyword reports. These are vital to figuring out how your search traffic is finding your site. Because Analytics tracks not only the top keywords driving traffic to your site, but every keyword used, you can see all the long-tail search results driving traffic to your site. There’s a brief keyword report on your overview page, but more detailed reports can be found under the “Search” sub-report.
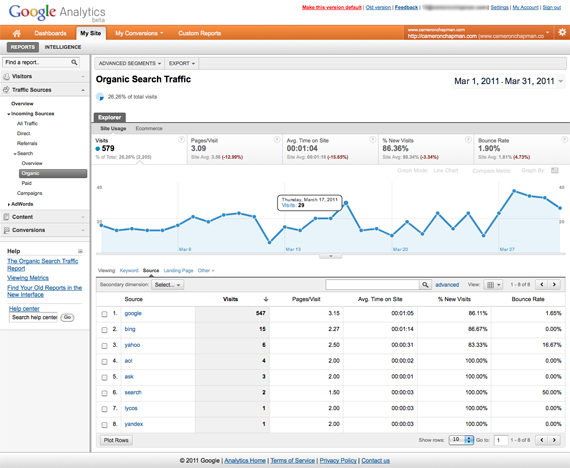
The search sub-report also tells you which page visitors are landing on most often, and which search engine they’re coming from. You can view your paid (AdWords) traffic and organic traffic, or a mix of the two. You can also view traffic in terms of campaigns, including traffic from RSS feeds.
If you use AdWords, you can view detailed reports for traffic driven by your ads, including campaigns, keywords, day parts, destination URLs, placements, keyword positions, and TV ads. These reports show you the number of visits generated, how many pages/visit, the average time spent on the site, the percentage of new visits, the bounce rate, your total goal completions, and the revenue generated from each. The last two are the most important metrics to watch, as you want to make sure that the ads are generating enough revenue or conversions to make them worthwhile. You may have some ads that only drive a small percentage of traffic, but a large number of those visitors convert (or vice versa). Without knowing the goal completions or revenue, you might disregard those ads and throw away important revenue sources.
Content
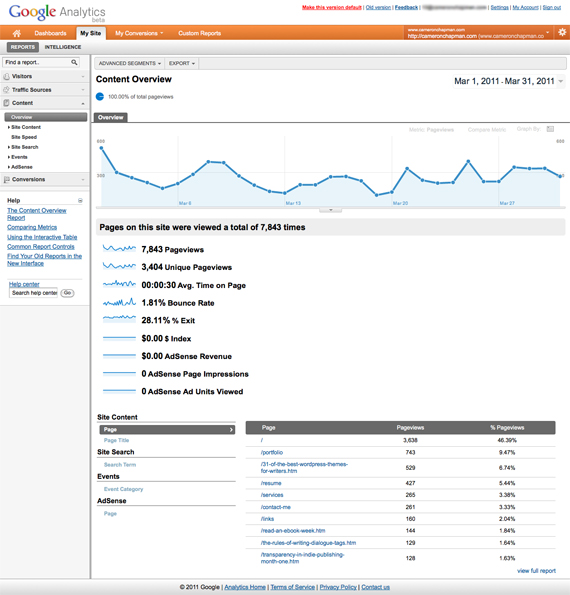
On the content overview page, the graph represents page views rather than visits, so you’ll notice the numbers used should be a lot larger than on the visits graph. One thing you’ll notice here is that both pageviews and unique pageviews are both shown. The difference is that a pageview is recorded every time a page is loaded (so if a user clicks refresh, a second pageview is logged, or if a user navigates to a different page and then uses their back button, a new pageview is counted), whereas a unique pageview is only logged once per browsing session.
Also on the overview page is a list of AdSense revenue, and the $ Index for a given page (which is the value of that page in your sales funnel). Your bounce rate and average time on each page is displayed here, too.
At the bottom of the overview page you’ll see options to review your site content by page or page title, to view your site search stats (if you’re using Google Site Search), to view your events, and to view AdSense earnings by page.
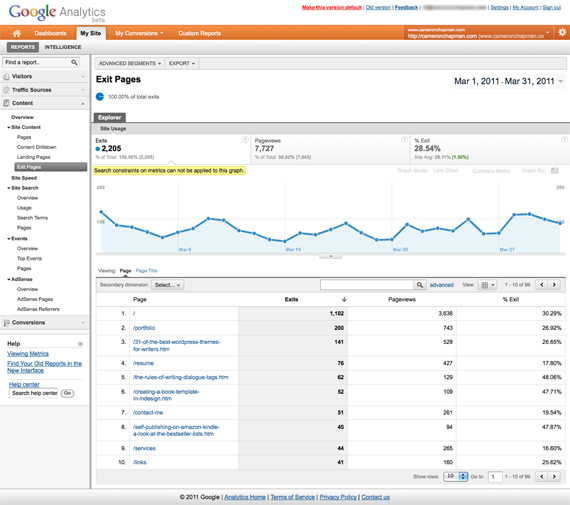
Other reports included in the content section include your more in-depth information about your pages viewed, as well as landing and exit pages. Pay close attention to the exit pages, as these can provide clues as to where in your sales funnel visitors are getting hung up. Landing pages can also be important, as you want to make sure that necessary information is included on the pages your visitors are actually viewing.
It’s a good idea to check your site speed report occasionally to make sure there aren’t any pages that are incredibly slow to load. Slow pages can deter visitors, and can interrupt your conversion process. Be sure to check the page speed of any of your main exit pages, too, as slow loading times could be one reason people are abandoning your site.
The other reports here are a bit more advanced, but if you use Google Site Search, or AdSense, or you’ve programmed Events into your site’s code, you’ll be able to monitor those things here.
Conversions
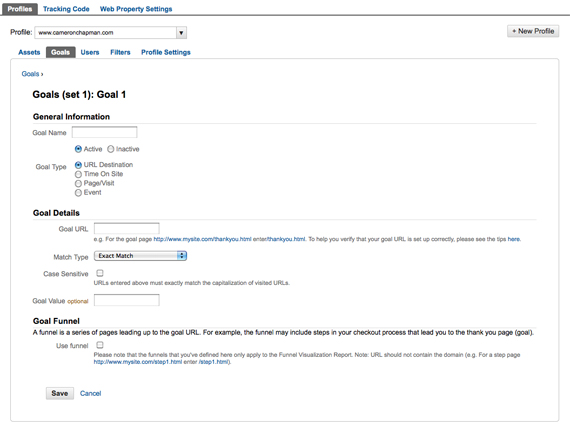
Conversions are broken down into two categories: goals and ecommerce. Goals are fairly easy to set up. You can have up to four sets of goals, each with five individual goals. This can be valuable for tracking different kinds of actions on your site (like length of time spent, reaching a specific page, or visiting a certain number of pages).
There are four different kinds of goals. Some are simply pages on your site you want visitors to reach. This could be a thank you page after someone has placed an order or signed up. It could be a particular product page. Or it could be something like your contact page or a request for information. You can also set a goal for a length of time spent on your site, the number of pages/visit, or an event.
To set up a goal, simply select which goal group you want to use, name your goal, and then define the goal type. You’ll have different options from there depending on which type of goal you’re setting up. It’s a good idea to at least set up goals for the last page in your conversion process. You can also set up a funnel, or a series of pages leading up to your goal page. If you set this up, you can more easily monitor at what point users abandon the conversion process.
E-commerce conversions are much more complicated to set up, and require inserting code on your actual site. More information about ecommerce tracking can be found in the Google Analytics help files.
Custom Reports
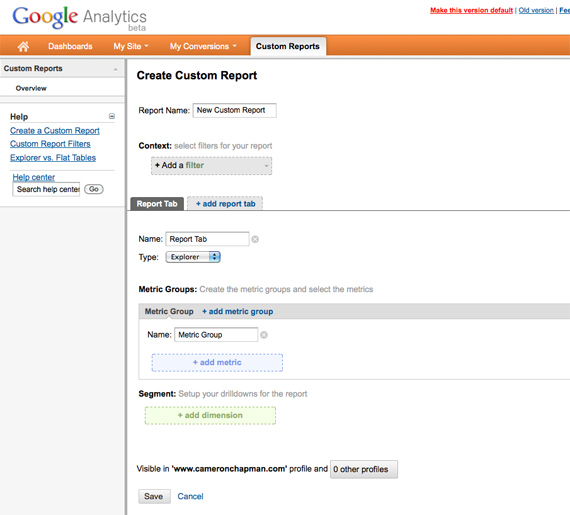
One of the biggest advantages of Google Analytics is that it allows you to create custom reports. Custom reports let you filter results based on a number of factors (basically anything included in any of the regular reports, plus custom filters), and then view any of the metrics included in Analytics (including custom goals). You can also add content drilldowns to further segment your reports. You’ll find the custom reports link in the top navigation.
Intelligence
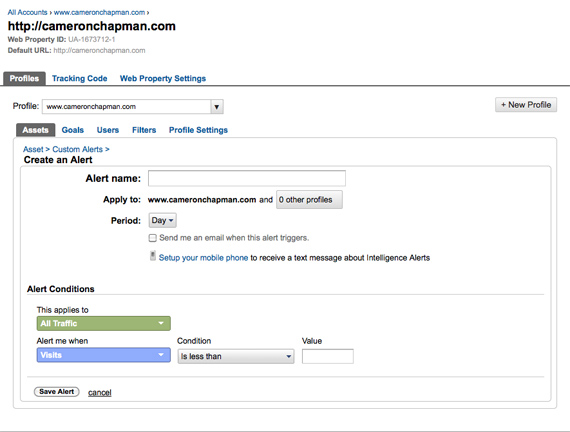
Intelligence is a relatively new feature of Analytics. There are automatic alerts built into the app, including pageviews, average time on site, visits, bounce rates, and other metrics (some of which are segmented). But you can also create custom alerts, for anything you define. Setting up an alert is simple: just set your alert conditions and decide whether you want an email notification if an alert is triggered, and you’re all set. Alerts can be set for all traffic or traffic segments, and you can set alerts for things like changes in visit numbers, goals, or similar metrics.
Intelligence can be a powerful tool for tracking potential problems on your site, or sudden spikes in traffic or conversions. Getting accurate, fast information about changes to your site means you can respond better to changes and make sure your visitors and customers are kept happy.
About the Author: Cameron Chapman is a freelance designer, blogger, and the author of Internet Famous: A Practical Guide to Becoming an Online Celebrity.
Comments (26)