Google’s recent update to Google Analytics v5 has been awesome. We have new reports for SEO, social media, and multi-channel funnels. There’s also all sorts of nifty little tricks and bags of goodies that were never available in the old Google Analytics. But there’s still one essential metric missing.
We don’t have $ Index.
Haven’t you ever wanted to know what your most influential pages are? Some of your pages help convert visitors left and right. Others just sit there. How do you know? That’s where $ Index comes in.
$ Index is the fastest way to figure out how each of your pages contributes to your total revenue. It takes your total revenue, analyzes the pages that visitors went through before they converted, and weights them so you can see which ones are the most valuable.
How $ Index Works
First, Google figures out if the page helped produce any ecommerce transactions or goals. The goals need goal values assigned to them. Otherwise, they don’t count for $ Index.
For a page to get credit, a visitor must have been to that page before completing the goal or transaction. If the visitor leaves your site and comes back the next day, the page doesn’t get any credit. The pageview and the transaction (or goal) must all be in the same session.
Google Analytics then calculates the total revenue that the page helped to produce and divides it by the number of sessions that viewed the page.
Google Analytics describes how to calculate $ Index here but most people find it pretty confusing.
Bottom line: The more revenue produced by each visitor that sees the page, the higher the $ Index.
Where to Find $ Index
Since we have to go into the old Google analytics, $ Index is a little harder to find:
- Log into Google Analytics
- Click “Old Version – Reporting” in the footer
- Select your account
- Pick your profile
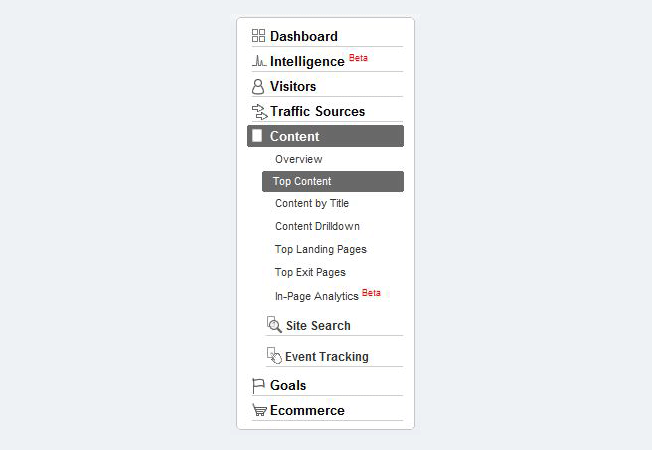
- In the left sidebar, click “Content”
- Choose Top Content, Content by Title, or Content Drilldown (they each have $ Index)

If you pick Top Content, you’ll see a shiny report similar to this:
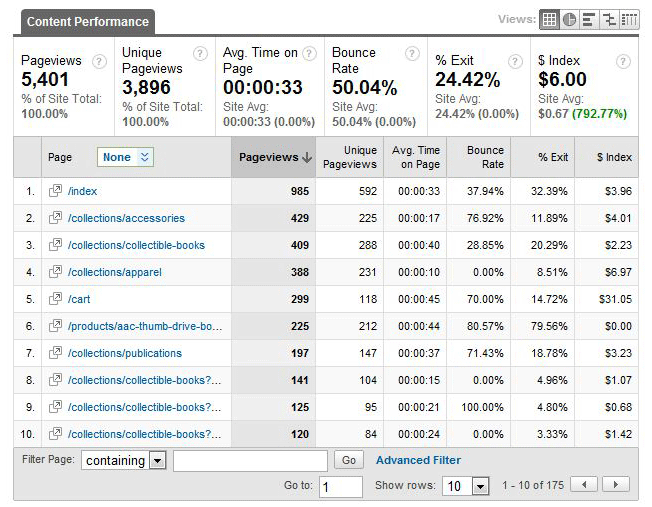
And the rightmost column is $ Index. Now you can find out how your pages contribute to conversions.
How To Use $ Index For Tasty Insights
This data is from the American Alpine Club’s ecommerce store so let’s use them as a case study. We want to find which pages contribute the most to transactions but don’t want to look at each and every row of data. How can we go straight to the good stuff?
By default, most reports in Google Analytics rank your data by visitors or pageviews. In the case of the old Top Content report, Google Analytics is using pageviews. But we don’t care about pageviews, we’re after $ Index. To rank a report by $ Index, simply click on $ Index above your data. This can be done with any metric in any report.
So go ahead and rank everything by $ Index (click on $ Index to do this) which gives us data like this:
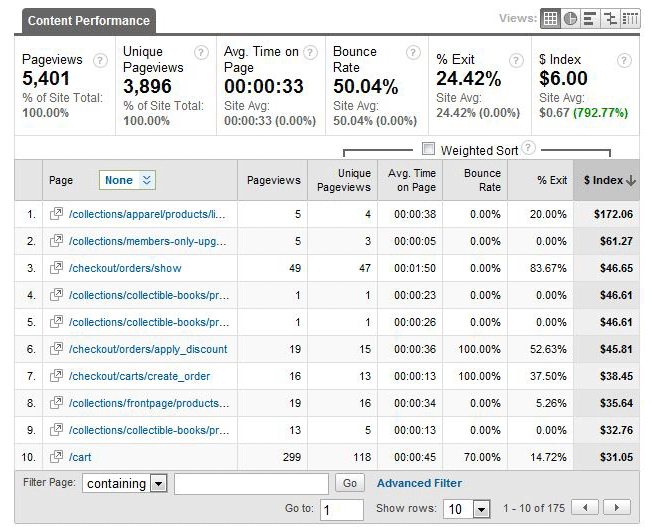
Now we have a new problem. Google Analytics is giving us all the outliers. We have a bunch of pages with only a few pageviews that happened to produce a transaction. And if we click on $ Index again so it ranks the worst $ Index pages at the top of the report, we have an entire list of pages that have never produced a transaction. Neither of these options help us much because these are all the outliers in our data. We need the pages toward the center or our data set. But looking through endless rows of data isn’t a great use of our time. Now what?
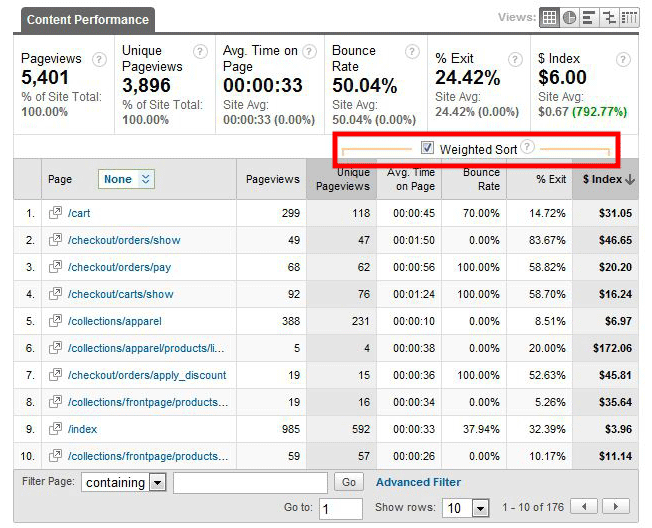
Luckily, Google Analytics built a tool to help us with this exact problem. It’s called weighted sort. It’ll compare the metric we’re currently ranking with ($ Index) and weight it by pageviews (or visitors in other reports). This gives us the pages that have enough traffic to have reliable data but also rank well on $ Index. If you reverse the $ Index ranking order, you’ll get pages with plenty of traffic that have a poor $ Index.
Weighted sort is right above your metrics, click the checkbox and Google Analytics gives us this data:
Finally, we have all sorts of delicious data in front of us.
Warning for Ecommerce Sites: Your checkout pages will dominate your $ Index (just like they do here). Since visitors have to travel through your checkout pages before converting, this makes sense. Ignore these pages and pay attention to everything else. If you want to be snazzy, set up a filter that excludes all of your checkout pages. But for most sites, all the other content pages start popping up by the 5th row of data so filters might be a little overkill in this instance.
This also applies to thank you pages and any other pages that your visitors are forced to visit before completing a transaction or goal.
Lets ignore the checkout funnel (the cart page and any page that starts with /checkout) and see what other insights we can find.
What about /collections/apparel? There’s a sizable amount of traffic going through that page but the $ Index is comparatively low (only $6.97) compared to other pages. This leads to several possibilities:
- People have a strong interest in apparel products but they didn’t find products that they wanted to buy. The store might not have the right products in apparel.
- Maybe the page drives people away. But the exit rate is 8.51% and the bounce rate is 0% so people are clicking through to other pages. We can use the Visitors Flow report in the new Google Analytics to see which pages people visit after viewing the apparel page.
- People are buying but the average order value of purchases that include apparel are lower than other product categories. The problem might be having too many apparel products at a low price point.
To start answering these questions, I would check the top pages that people go to from the apparel page, start split testing the apparel page to feature different products, and test apparel products at higher price points.
What else stands out? The page in row 6 is for an individual product. There’s only a few pageviews but the $ Index is astronomical at $172.06. Only a few people visited the page but several of them bought a product. Now, this page might have just gotten lucky with a few visitors. But it also might be one that converts very well and isn’t getting enough traffic.
I would find ways to drive traffic to that product page and see if it maintains strong conversion rates. With an influx of traffic, I expect the $ Index to drop. If it drops slightly, I should keep funneling traffic to that product. If it drops a lot, the high performance was just an anomaly.
Insights $ Index Will Give You
What Pages Need Fixing: Along with bounce rate, $ Index will tell you what pages are performing terribly. Find pages with a super low $ Index and schedule them for split tests or a revamp. Many people use bounce rates exclusively for this but it always helps to compare your pages based on revenue.
Which High Value Pages Aren’t Getting Enough Traffic: Once you know how your pages rank by $ Index, look for pages that have a relatively high $ Index but not much traffic. You might find a page that converts like mad but doesn’t get enough traffic to make a difference. Try sending more people to that page via your homepage, blog, or social media profiles. But be careful, the $ Index for the page could just be an anomaly. When you funnel traffic to it, $ Index might plummet.
Which Pages Should Become Cornerstones: Once you’ve found pages that maintain high $ Index values with large volumes of traffic, promote those pages often. Link to them on your home page, feature them in emails, and use them to introduce new prospects to you. Compared to other pages, they do a much better job at getting people to stick around and become customers. So rely on them heavily.
How to Use Weighted Sort in the New Google Analytics (v5)
Weighted sort is an incredible tool. And it works on just about any metric you want. $ Index may be missing from the new Google Analytics but you can easily apply weighted sort to your new reports.
Here’s where to find it in the new Google Analytics:
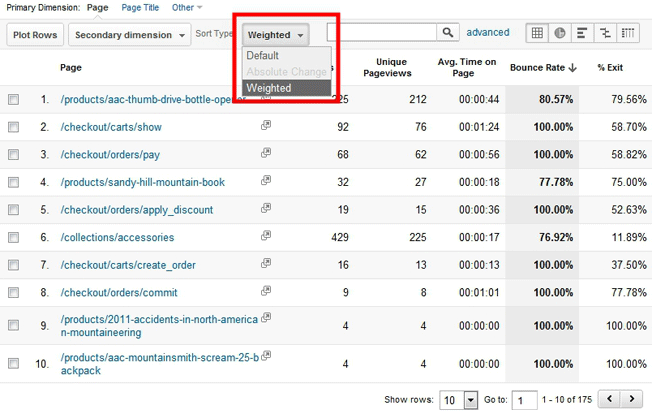
Make sure that you’re already ranking your data with a metric other than visits or pageviews. Otherwise the dropdown will be grayed out and you won’t be able to select the weighted sort.
Go to your content reports, weight by high bounce rates, and you’ll have a whole list of pages that need fixing.
When is $ Index Coming to the New Google Analytics (v5)?
I have no idea, none whatsoever. The only mention on $ Index that I can find from Google is within this blog post on the official Google Analytics blog. The post describes the new quick Insights and plots rows in Google Analytics v5.
But in the comments, one user mentions that $ Index is missing from the new Google Analytics. Trevor Claiborne (Google Product Manager and author of the blog post) replies that “the new version doesn’t have all the features of the old version yet, but they’re coming soon. $ Index should make its way to the new version, but it’s not there yet.”
This was in March 2011. So your guess is as good as mine on when Google will add $ Index to the new Google Analytics. Since it’s been over a year since that post, they may have decided to drop it altogether.
What else do you miss from the old Google Analytics? Tell us in the comments.
And definitely let us know what tasty insights you find with $ Index.
About the Author: Lars Lofgren is a Marketing Analyst and has his Google Analytics Individual Qualification (he’s certified). Learn how to grow your business at his marketing blog or follow him on Twitter @larslofgren.
Comments (12)