
You’re probably already using Facebook to engage with your audience.
The platform has established itself as indispensable within the social media marketing industry with 62% of marketers naming it as the most important one in their strategies.
But while 93% of marketers use Facebook advertising regularly, 40% say they’re unsure whether their efforts are working.
And that’s becoming an increasingly difficult question to answer.
Because Facebook’s recent algorithm update prioritizes posts from friends and family, less content from business pages is showing up in users’ News Feeds.
In fact, Facebook Ads expert Jon Loomer warns that measuring only actual, viewable impressions, as opposed to News Feed ticks, could see reach decline by up to 20%.
And as organic reach drops, ad rates continue to skyrocket — increasing by 35% in the last quarter of 2017 alone.
So with organic reach on the decline and advertising becoming more expensive than ever, reaching your audience on the platform isn’t as easy as it used to be.
But it also isn’t impossible.
Fortunately, Facebook offers a comprehensive set of analytics reports for business page owners.
And in this post, you’ll learn nine ways to gather actionable data from these reports, then use that insight to increase your organic reach.
Why organic reach matters
There’s been a continual decline in average organic Facebook page reach over the past few years.
And while that may not be news if you’ve been following the social media marketing industry, there was a more drastic drop from 2016 to 2017.
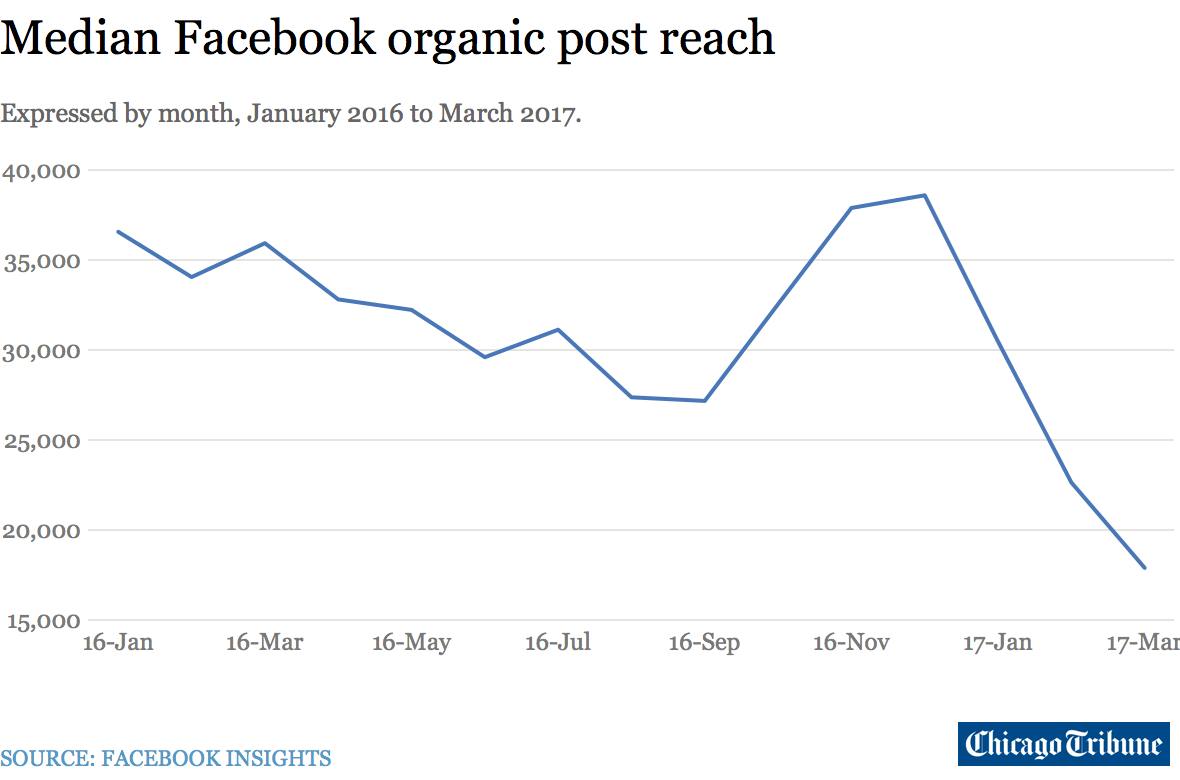
This means that marketers across the board are reaching fewer of their followers with the content they post.
But why does this matter?
Can’t you just spend some money and boost your posts so that they reach more users?
That would be the obvious solution — but personally, I don’t recommend it as an alternative to working on your organic reach.
Boosting posts, even with a well-executed strategy, is a temporary approach. Once you stop paying, you stop getting results.
Plus, the posts you boost will typically involve directing users to informational content on your site.
And while that can help you earn traffic, that traffic doesn’t generally convert at a high rate — meaning that the ROI you see will likely be low.
So while boosting posts is an effective way to generate a spike in traffic to a page on your site, it ultimately won’t lead to long-term results.
Achieving and maintaining strong organic reach, on the other hand, can boost your lead generation efforts.
And, having a strong organic reach, can contribute to your sales funnel — making it a much better goal for your Facebook marketing strategy.
How to access Facebook Insights
To access the data that Facebook provides on your business’s results, you’ll first need to navigate to your page and select “Insights” from the menu bar.

The main dashboard shows a summary of the previous seven days.
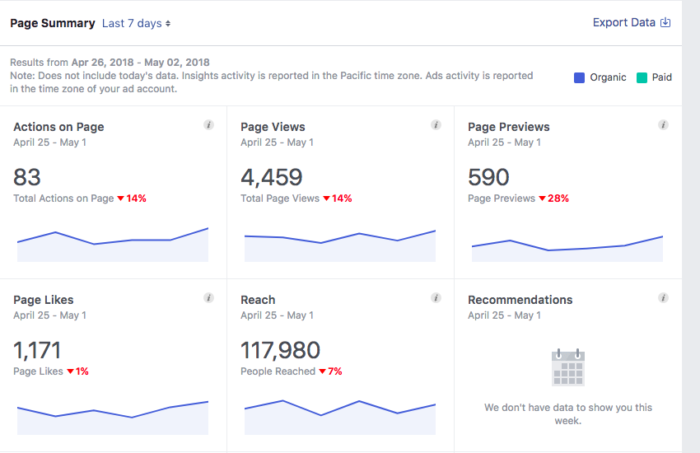
This summary includes data for your total actions on page, pageviews, page previews, page likes, page reach, and page recommendations.
It essentially gives a general overview of your weekly performance, as well as how that performance compares to the previous week.
From here, you can click any of these summaries to access more detailed information or scroll down to see data for your five most recent posts.

This section will show the date and time of each post, the post’s type and caption, as well as the reach and engagement achieved.
The reach metric will also display both organic and boosted numbers if you paid to promote any of your posts listed over the previous seven days.
Finally, your dashboard will also display weekly performance summaries of up to five pages that you’ve designated as “Pages to Watch.”
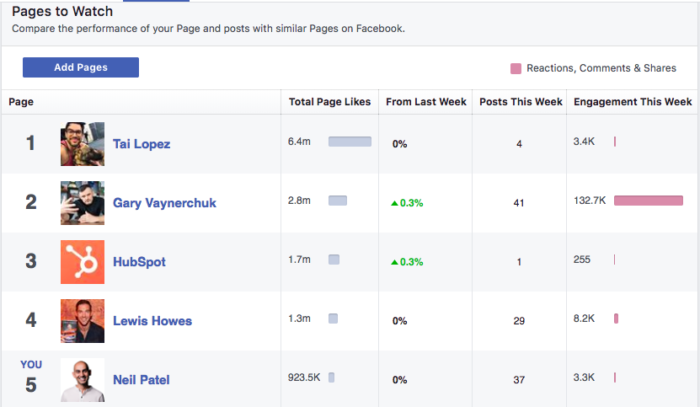
This feature is designed to help you easily compare your page’s performance with your competitors’ pages.
You can add up to five pages to track. Then this report will display each one’s total page likes as well as their increase in page likes, total posts, and total engagements.
How to use Facebook Insights to increase your reach
So, reaching your audience with organic content is essential for achieving significant results with Facebook.
But if your current approach is just to share links to new content whenever you publish it on your site, it’s unlikely you’ll see the kind of organic reach you want.
Success on the platform requires careful strategy and planning.
And when you use Facebook’s built-in reporting feature, Insights, you can learn valuable data about your audience.
This data will help you create a strategy tailored to their interests and browsing habits.
So if you’re looking to improve your results on the platform, here are nine ways to use Facebook Insights to measure your performance and improve it moving forward.
1. Use the Likes, Comments, and Shares report to identify high-performing content
One of the most popular metrics amongst Facebook marketers is reach.
You can access this data by selecting the “Reach” tab from the column on the left of the page.
Here you’ll see a report showing how many people saw content from your page on any given day.
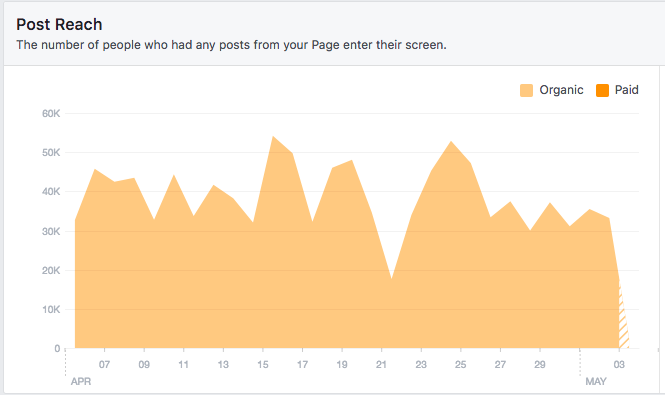
This is a helpful report for getting a general idea of how many people read or saw your posts over a given time period.
But it doesn’t show which content they saw or whether any of those people engaged with it.
Of course, you can use this graph to identify any spikes in reach, then use those spikes as a starting point for digging deeper into your reports.
In that regard, it makes sense to glance at this report whenever you check in on your page’s results.
But you can’t draw definitive or actionable conclusions from it.
After all, your goal isn’t just to know what your organic reach is — it’s to increase that number.
And one of the best ways to do that is to focus on creating more engaging content.
When a post does well in terms of engagement, this signals to Facebook that users find it interesting. As a result, they’ll distribute that post to even more users.
This means that to achieve high organic reach, you need to create content that generates engagement from your audience.
And you can access this data in the Reactions, Comments, Shares, and More report.
Instead of focusing on reach, this report will help you identify the days on which your content sparked the most reactions among your audience.
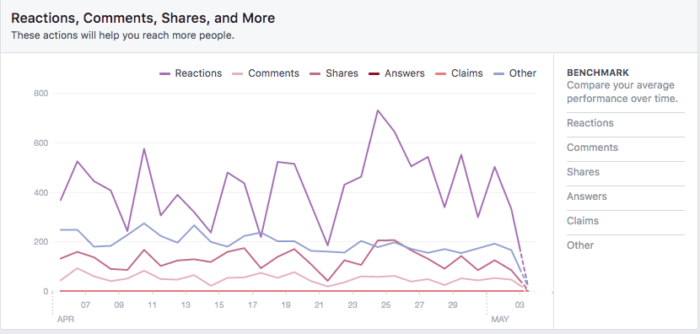
Again, this report doesn’t show individual posts — so looking at this data alone won’t tell you which content generated a high number of likes, comments, or shares.
But once you’ve identified days on which your page saw high engagement numbers, you can use that insight to narrow in on specific posts.
This can serve as a starting point for identifying high-performing content.
Plus, you can use it to gauge your overall engagement levels over time.
And while many Facebook marketers mistakenly focus on reach, making engagement-related metrics a priority will give you a much more accurate idea of what you’re doing well.
2. Use the Posts report to compare individual posts
After you’ve used page-wide metrics to get a general idea of your Facebook results, you can use the Posts report to learn more about the performance of individual posts.
Under the Posts tab, scroll down to “All Posts Published.”
This report will list each of your recently-published posts individually, as well as the post’s type, targeting, reach, and engagement.
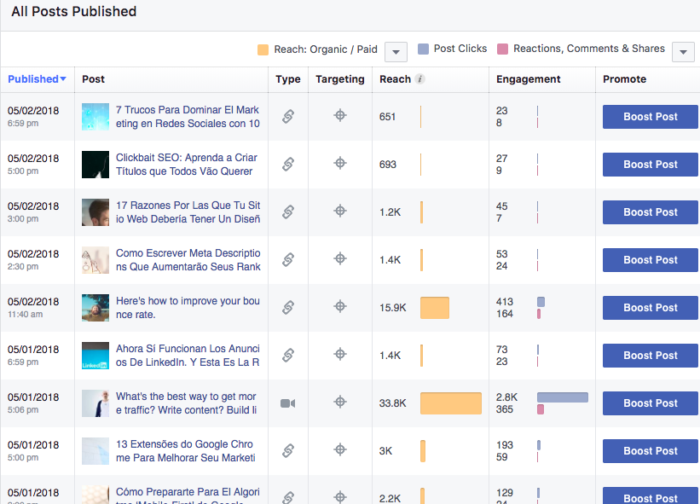
With this data, you can easily identify the top-performing posts on your page for any given time period.
Here again, though, you’ll want to focus on engagement instead of reach alone.
This is especially important when you consider what this metric really indicates. Every time one of your posts appears in a user’s News Feed, it adds to your reach count.
And when you think about your own browsing habits, the problem becomes apparent.
Many of us tend to scroll mindlessly through our feeds, only stopping when something catches our attention.
And if this is the kind of “reach” you’re generating, it means very little for your business.
If users don’t stop to read your content, their view is essentially useless.
When a user likes, comments on, or shares one of your posts, however, you can be confident that they spent at least a few seconds with your content.
This makes these metrics more reliable indicators of a post’s success. Plus, they can give you a better understanding of which types of content are most interesting to your audience.
Then, you can use this insight to create more of the content they like — leading to more engagement for your page and improving your overall organic reach.
3. Use the Post Types report to learn what your audience wants
Another helpful data set within the Posts section of Insights is the “Post Types” report.
This will show the performance of your most recent posts. But instead of displaying them individually, it shows data based on different types of posts.
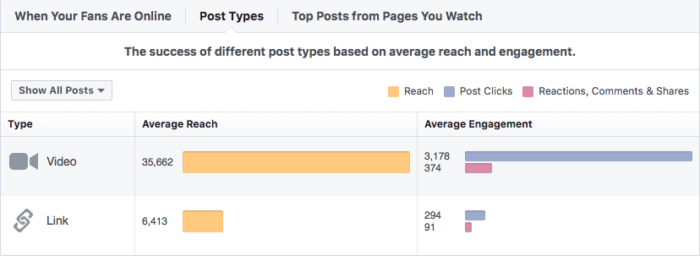
When you publish content to your page, you can either post it in the form of a photo, status, link, offer, or video.
This report will show which of those types tend to resonate best with your audience.
After all, every audience is different.
And while visual content performs best on social media, you won’t know for sure if that’s because of your followers or other types of content they prefer until you dig into your own data.
Of course, as a caveat, it’s important to note that the actual content in these posts can have an impact on your followers’ responses.
So if you’ve only published one or two posts within the reporting period, your data may be skewed based on their content.
As a result, this report is most helpful when you’ve been publishing new posts on a regular basis.
But once it’s had enough time to collect significant data, you can use it to shape your content calendar and overall strategy.
The more you post the type of content your audience likes to see, the more effective you’ll be at generating engagement and reaching your goals on the platform.
4. Identify what’s working for your competitors
Looking at post performance is a great way to gauge what your audience wants to see more of. But it’s important to remember that you aren’t limited to monitoring your own content.
Much like with virtually every other form of digital marketing, doing a bit of competitor research is a great way to improve your own strategy.
And Facebook makes that process easy, as long as you know who your competitors are.
From the Posts tab, select “Top Posts from Pages You Watch.”
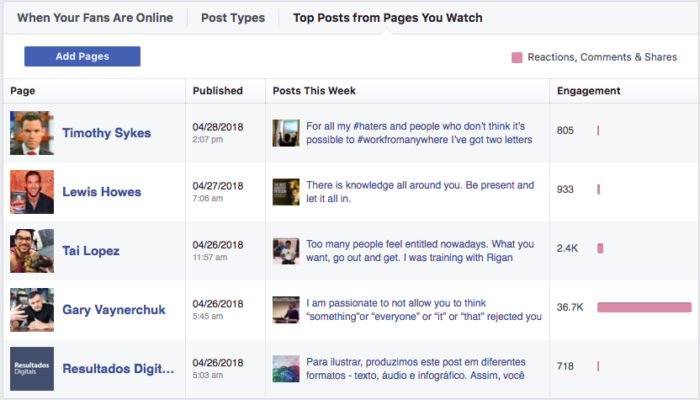
This report shows data from pages you’ve identified as competitors. And if you haven’t done so yet, you can add to it by selecting the “Add Pages” button at the top of the report.
Then, you’ll see the top content from each of the pages you’ve chosen to monitor in terms of engagement.
The report also includes direct links to each post, making it easy to see the exact content that’s working for your competitors.
Assuming that your audience shares similarities with the audiences of the pages you’ve chosen to monitor, this can be an extremely valuable insight for your business.
Spend some time investigating which post types are working for other businesses in your industry, what kinds of topics they’re posting about, and the tone and style that they use.
Of course, you should never attempt to replicate another company’s strategy directly.
But this is a great way to learn how to most effectively connect with your audience — so that you can create a clearer plan for your own approach.
5. Learn when your fans are online
Many Facebook page admins struggle to identify the best times to post on social media.
If you spend time creating content, you want to make sure that your audience actually sees it — and timing can play a big role in that.
Fortunately, determining when your audience is online doesn’t need to be a game of guesswork.
Facebook provides all of this data under the Posts tab. Simply select “When Your Fans Are Online” from the menu at the top of the report.
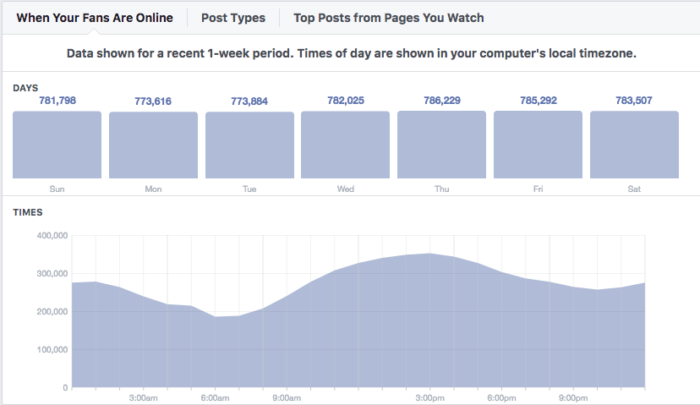
Here, you’ll see data from the previous week, showing your total number of fans active on each day of the week.
Then, once you select a day, you can see how many users were active during each hourly interval based on your local time zone.
With this report, there’s no need to guess when you should be posting to reach your audience.
Create a schedule based on when you know they’re most active online, and you can be confident that you aren’t missing any opportunities simply because of timing issues.
6. Use the Net Followers report to track your audience’s growth
Your organic reach depends on many different factors, the most notable of which is Facebook’s algorithm.
But your posts will only ever show up in the feeds of users who’ve chosen to follow you — meaning that your potential organic reach is limited to that number of users.
That means that it’s important to keep an eye on your audience’s growth.
Fortunately, this is an easy metric to monitor using the “Net Followers” report, which you can find under the Followers tab.
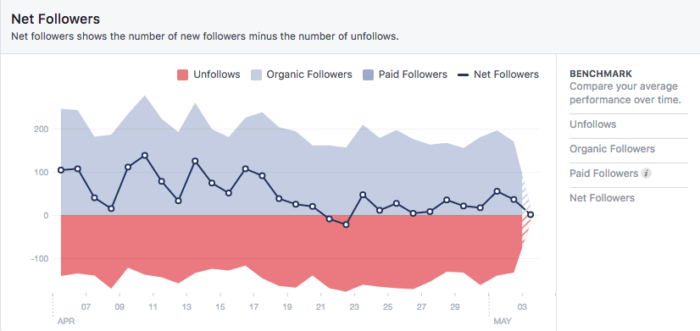
While many page managers focus solely on their total number of followers, that metric doesn’t tell the whole story.
When it comes to growing a page, retaining your current followers is just as important as earning new ones.
And this report can show you how you’re doing in that regard.
Plus, if you’re losing followers, this can help you learn why.
If you notice a significant number of unfollowers on a specific day, you’ll want to take a look at what you posted that day.
This can give some insight as to what kinds of content your audience doesn’t like.
This way, you can avoid publishing the kinds of content that cost your page followers — and continue to grow your audience.
7. Use the Actions on Page report to see how Facebook drives important business goals
As with any marketing channel, your goal with Facebook marketing isn’t simply to generate attention on the platform itself.
Ultimately, you want your efforts to translate into meaningful results for your business.
And fortunately, some businesses have seen these types of results remain consistent — or even increase — despite the overall decrease in average page reach.
For example, in one Scribewise study, the company saw a 67% increase in site traffic due to Facebook from December 2017 to January 2018.
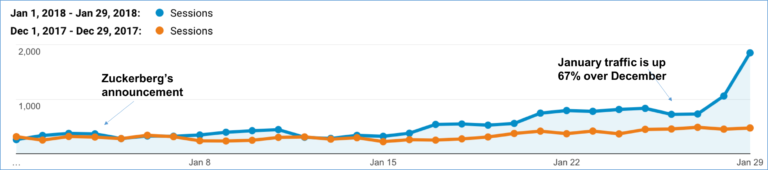
So while many social media marketers were panicking about drops in reach, their results actually improved for a more meaningful metric than how often they appear in users’ News Feeds.
And the data in the Actions on Page tab can help you gauge whether your Facebook marketing campaigns are making an impact.
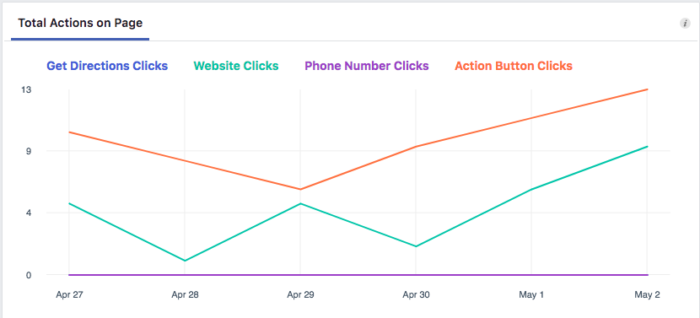
This report shows whether users are taking actions that translate into off-page results.
Actions like asking for directions to your business, clicking your phone number, visiting your website, or clicking the action button on your header.
Depending on your business and social media marketing strategy, not all of these actions will be relevant.
For example, if you’re running an e-commerce store, you wouldn’t expect your followers to ask for directions.
But you would want them to visit your website or click an action button that directs them to shop — and this report is where you can see whether they’re taking those steps.
So to make the most of this report, you’ll first need to determine what kind of action you’re hoping to drive with your page.
And if you haven’t done so yet, you’ll want to create a custom action button. This will show up in your page’s header and direct visitors to take a step that’s important to your business.
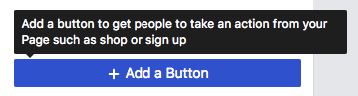
Click “Add Button,” and you’ll be prompted to select from a pre-set list of button types.
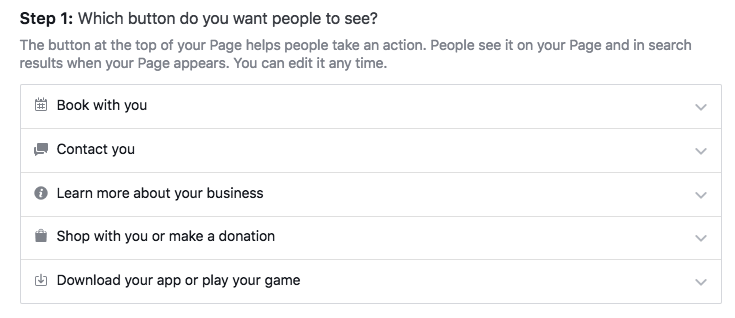
You can opt to direct users to book an appointment, contact you, visit a specific page on your site, shop or make a donation, or download an app or game.
Once you’ve added your button, you’ll be able to track how many users click it in the Actions on Page report.
This will give you a clearer idea of how your Facebook strategy is contributing to your overall marketing goals.
8. Use Video Insights to monitor performance
Today, video is one of the best ways to engage Facebook users. In fact, 12 of the 14 most viral Facebook posts in 2017 were videos.
Facebook has even explicitly stated that video generates more engagement.
It’s clearly a compelling medium — so it should come as no surprise that 81% of marketers are using it as part of their strategies.
And videos don’t have to be complicated or involve high production values to generate results, either.
Just take a look at how Inspiralized uses videos created with Instagram’s Boomerang feature to attract their audience’s attention:
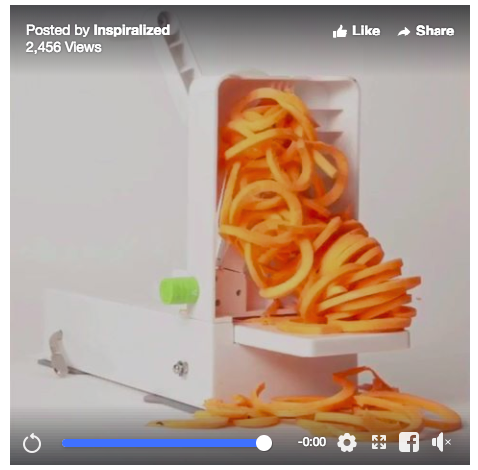
So if you’re not using video yet as part of your strategy, there’s no reason not to try publishing a few simple posts and see how your audience responds.
Then, once you do, Facebook’s Video Insights are a great way to monitor your performance.
Click the Video tab, and you’ll first see an overview of your page’s Video Views.
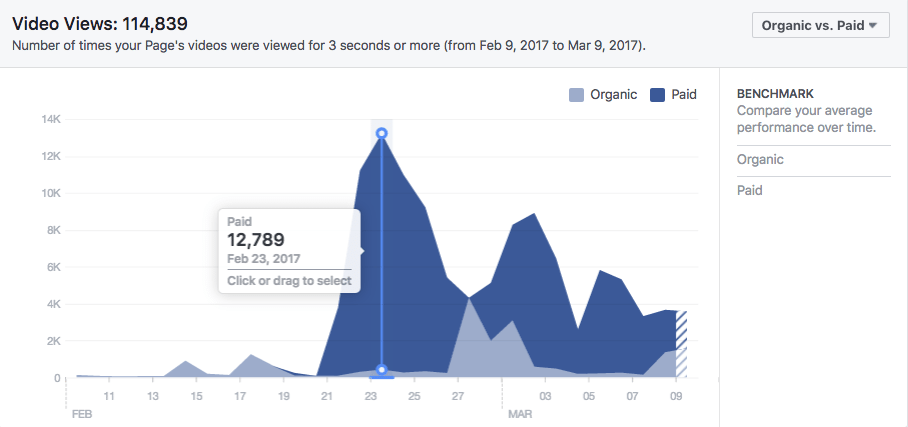
This report counts each time a user watches three seconds or more of one of your videos as a view.
But if you scroll a little farther down the page, you’ll also see a report showing only views of ten or more seconds.
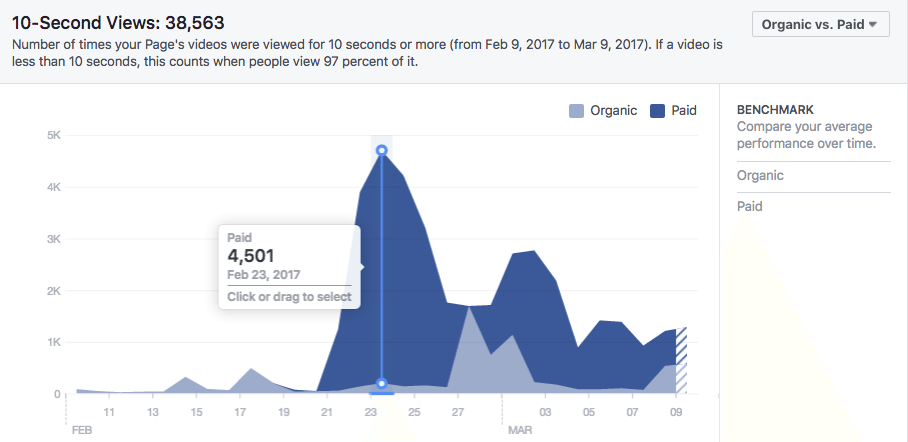
If your video is less than ten seconds, Facebook will instead use this report to show users who watch 97% of it.
Either way, this report is an excellent way to see which of your videos are effective in engaging your audience.
If a user spends ten or more seconds watching your content, they’re clearly interested — and that means a lot more than the type of view included in the standard reach metric.
From here, you can also click any video to access more data about that individual post.
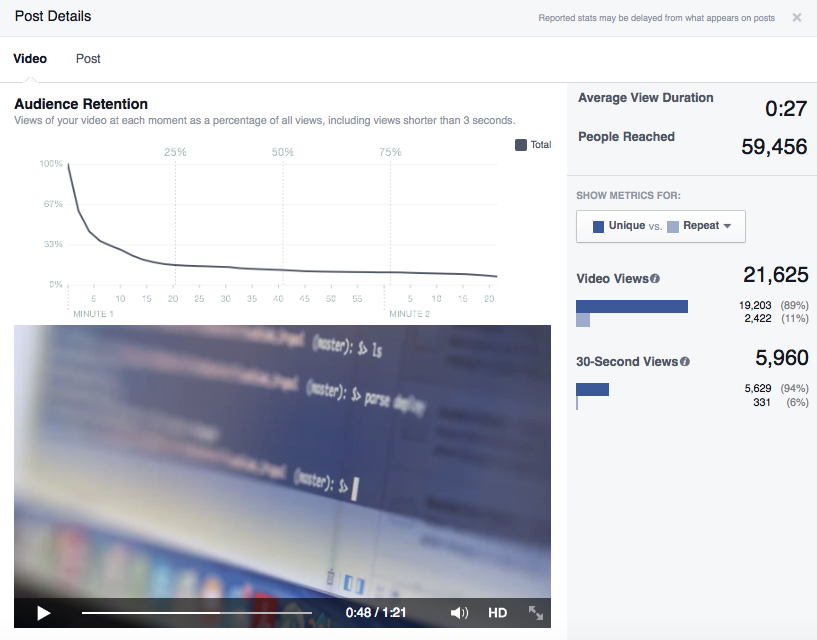
This data includes peak live viewers, average watch time, and total minutes viewed.
9. Learn who your followers are
The more you know about your followers, the more effective you’ll be in creating content that’s relevant to their needs and interests.
You can access Facebook’s data about who follows your page by navigating to the People tab, then selecting “Your Followers.”
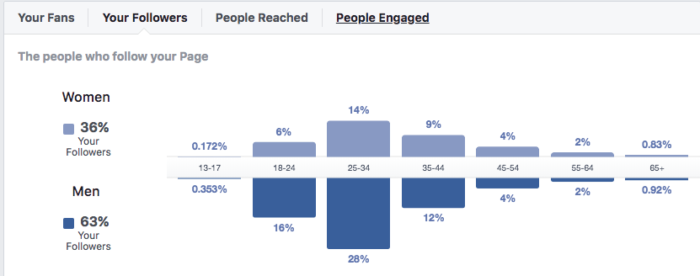
It’s important to note that by default, Facebook will show data on your fans, not your followers.
And while you’ll often see these terms used interchangeably, there’s an important distinction to make.
Fans “like” your page, but may have opted not to see your posts in their feeds. Followers, on the other hand, have indicated that they want to see your content.
That means that while these audiences may be extremely similar, followers are a better indicator of who’s seeing and interacting with your posts.
Conclusion
Engaging your audience on Facebook is no longer as simple as remembering to publish a new post once or twice a week.
But using the reports above, you can gain valuable insight into your audience’s interests and browsing habits.
Focus on engagement rather than reach because someone who is engaging with your content is more likely to buy than someone who just scrolled past it on their News Feed.
Compare post types and individual posts to see what’s working for you. Then check out what’s working for your competitors.
Once you know what types of content your audience likes, find out when they’re online and post at peak times so they actually see it.
And don’t forget video. It’s one of the best ways to engage your audience.
Try a few video posts and see how your audience responds.
Finally, track your audience growth and business goals to make sure your content is connecting.
When you shape your strategy around what they want to see, you’ll be much more successful in achieving the reach and engagement you want.
Which metrics do you find most helpful when monitoring your Facebook marketing success?
Comments (26)