
Your bounce rate can be such a scary number, right?
It’s common knowledge that a high bounce rate is bad and a low rate is good.
Every time you log into your Google Analytics account, it’s right there waiting for you.
I understand the feeling when you see that number creeping up.
But the problem is that numbers can be misleading.
After all, how high is really too high?
In this post, I’m going to show you how you can fully measure and assess your bounce rate. That way, you’ll know if it’s actually too high for your industry or if it’s perfectly normal.
I’ll share tips and tricks on how to audit your bounce rate and understand what’s driving it up.
I’ll also tell you some of my secrets for lowering your bounce rate.
But first, let’s talk about exactly what a bounce rate is and why you should care.
What is a bounce rate and why does it matter?
A “bounce” occurs when someone visits your website and leaves without interacting further with your site. Your bounce rate shows you the percentage of your visitors who bounce off of your site.
By default, Google Analytics considers a visitor to have interacted with your site if they visited at least one additional page.
The bounce rate you see in your overview report on Google Analytics is your site-wide bounce rate.
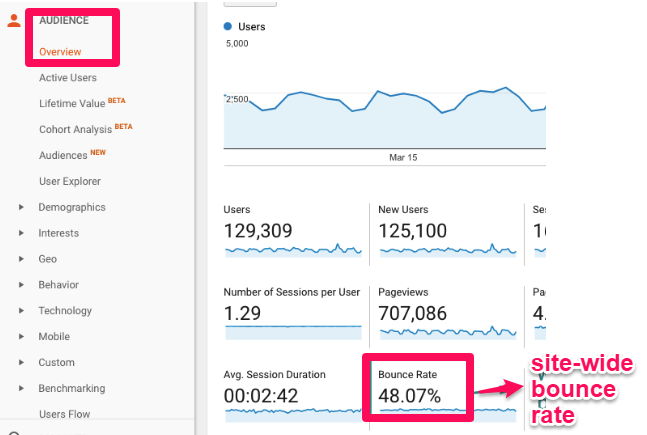
It’s the average number of bounces across all of your pages divided by the total number of visits across all of those pages within the same period.
You can also track the bounce rate of a single page or a segment or section of your site.
I’ll show you how once we start looking at the different segment reports.
The bounce rate of a single page is exactly what it sounds like. It’s the total number of bounces divided by the total number of visits on a page.
If you run an e-commerce site that also has a blog, you may want to implement a segmented bounce rate.
Why?
Your blog posts may have a very different average bounce rate than your product pages.
We’ll get into the exact details later, but segmenting the two can make your numbers more meaningful when you’re looking at the data.
So, why is bounce rate important?
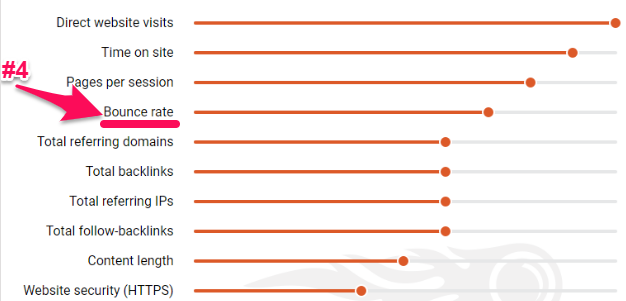
According to SEMrush, bounce rate is the 4th most important ranking factor on SERPs.
However, according to Search Engine Journal, Google does not use bounce rate in its algorithm metrics.
Can they both be right?
Yes, and I’ll tell you why.
Google’s algorithm may not directly take bounce rate into account, but what it signifies is very important to it.
As of 2016, RankBrain was the third-most important ranking factor of Google’s algorithm.
If you’re not familiar with RankBrain, its main purpose is to improve search results for users by better understanding their search intent.
If a user clicks on your page and leaves without any interaction, that could signal to RankBrain that your site isn’t what they’re looking for.
It makes it look like your result doesn’t match the searcher intent well. As a result, RankBrain says, “Maybe this page shouldn’t be so high in the results.”
Can you see how these connect?
If you understand bounce rate properly, it can tell you if your marketing strategy is effective and if your visitors are engaging with your content.
The key is to understand what your “target” is and break down your bounce rate in a way that provides meaning.
What bounce rate is good?
Many different variables determine what a “good” bounce rate is.
Things like your business type, industry, country, and the types of devices your visitors are using all influence what a good average would be for your site.
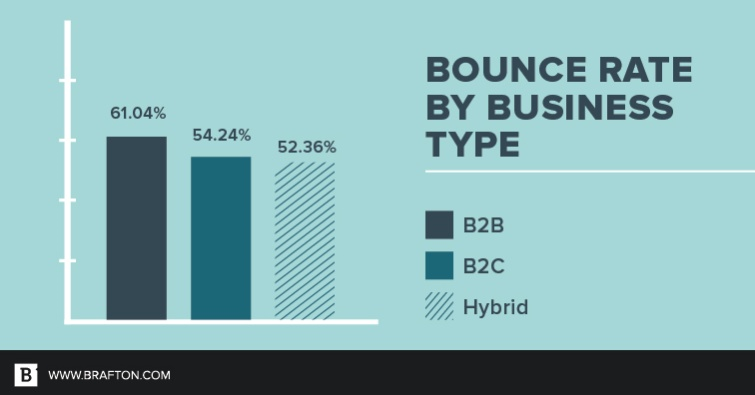
For instance, Brafton found that the average bounce rate is 58.18%. However, their research shows that bounce rates are higher for B2B businesses than B2C businesses.
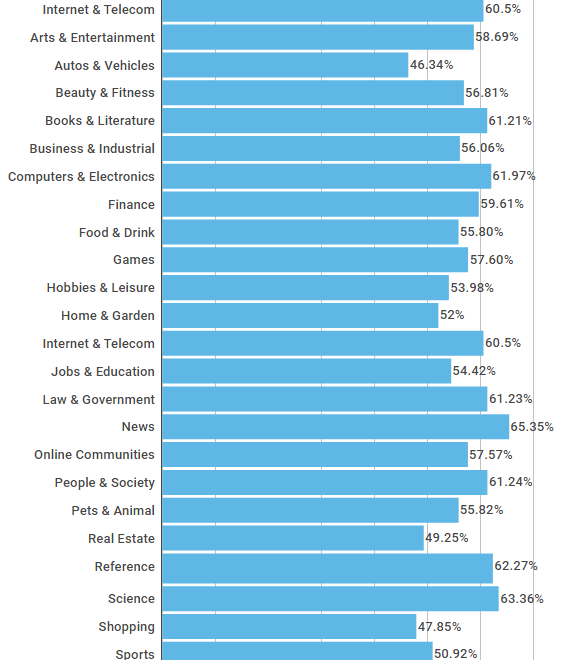
These 2017 benchmarks show a wide range of average bounce rates across industries:
If you’re still unsure about the bounce rate you should be targeting, Google Analytics can help you figure it out.
Google Analytics gives you a quick visualization of the average bounce rate for what it believes is your industry. It does this by benchmarking.
First, you need to set up benchmarking in Google Analytics.
Under the admin section, click on “Account Settings” and then check the “Benchmarking” box.
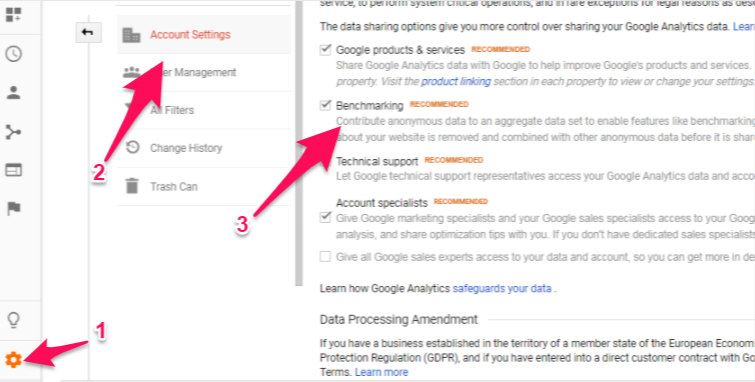
Now you can compare industry averages.
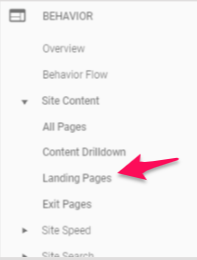
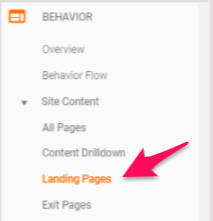
Just navigate to your behavior reports. Click on “Site Content” and then “Landing Pages.”
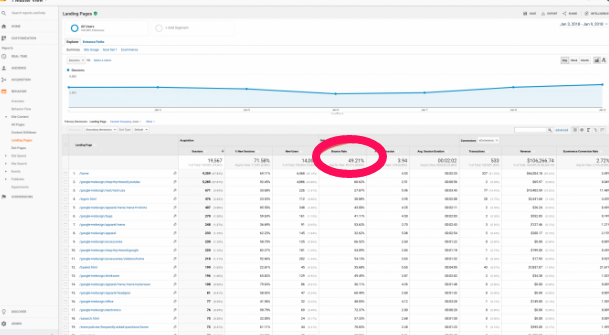
You’ll immediately see the average, site-wide bounce rate.
Of course, a site-wide average can be too broad to be a valuable benchmark.
You can drill down further to view section-specific bounce rates.
With either the Content Drilldown Report or the advanced filter feature, you can see the average bounce rates for sections of your site.
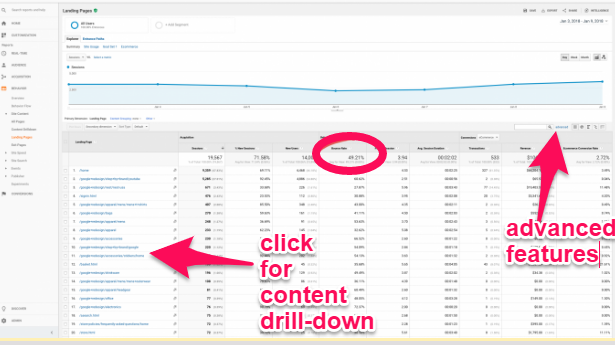
For example, now you can compare the industry average for just your blog or product pages.
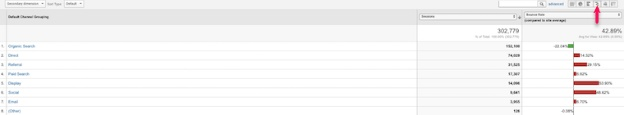
In the “Audience” section of Google Analytics, go under “Behavior” then “Benchmarking.” Then, select “Channels.”
Now you can choose your vertical and compare whichever time period you want to review.
This should give you a better idea of your website’s bounce rate performance compared to the average by channel.
The chart above compares your channel bounce rate against other Google Analytics accounts or properties in your industry.
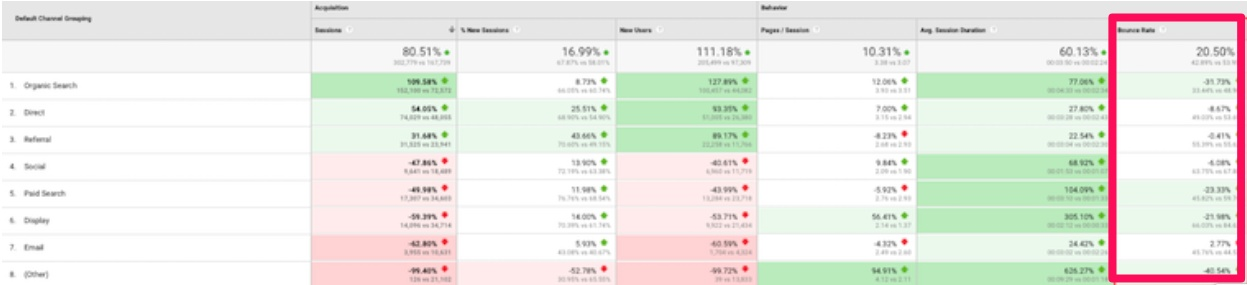
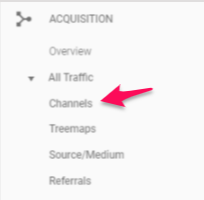
If you want to look deeper, you can do so by going into “Acquisition,” then “All Traffic,” and then “Channels.”
Then click the “Comparison” button on the right and filter by “Bounce Rate” to see which channels are above or below average.
You can then dig even deeper into each one for further analysis.
Ultimately, a “good” bounce rate will be different for every site. It may even be different for every page on your site.
I suggest that you simply focus on your bounce rate trends over time and how you can improve the highest ones to boost conversions.
The focus should be on using this metric to find weaknesses in your site. Don’t worry about hitting a magic number.
Now, let’s look at how you can improve your bounce rates.
Modifying bounce rates
Your site-wide bounce rate is too broad to be anything but a vanity metric.
It’s too shallow to provide meaning.
To measure and assess your bounce rate, you need to narrow it down and group it by different variables.
You won’t be able to start lowering your bounce rate until you really understand what’s causing it to be high.
There are a couple of ways that you can modify the bounce rate metric you see in Google Analytics.
As I already mentioned above, the first way is by segmenting your bounce rate.
You can create all sorts of different segments in Google Analytics to better analyze your bounce rate. You can even create custom variables.
We’ll look at nine different segment options that will help you assess and improve your bounce rate.
Segment by age
There are plenty of different demographics that Google Analytics tracks, which allows you to better segment and analyze your site traffic.
One of these is the age range of your visitors.
To look at bounce rate by age range, look under “Audience” and then “Demographics” on the left-hand sidebar. Then, click the “Age” option.
 .
.
The resulting report should look something like this.
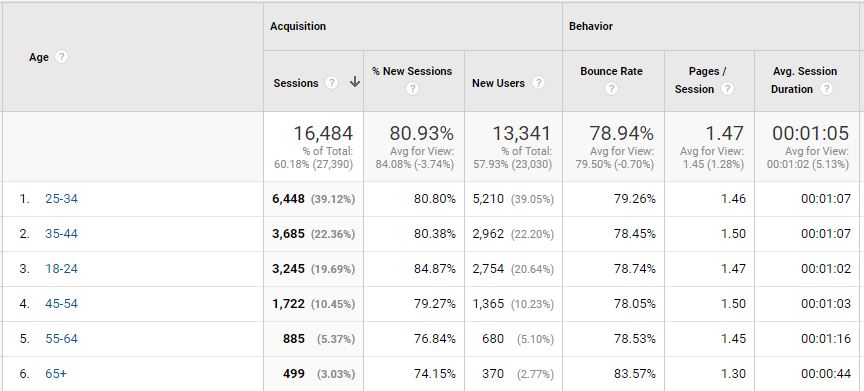
Now you can easily see if your bounce rate is higher with a certain age range.
You can see in the example above that seniors (65+) have a much higher rate than the rest of this site’s visitors.
If seniors are part of your ideal target market, make sure that you structure your web pages properly for marketing to them.
For example, avoid using jargon, trendy language, and slang.
Segment by gender
The “Gender” option is just below “Age” on that left-hand menu.
This report tells you your bounce rate for males and females.
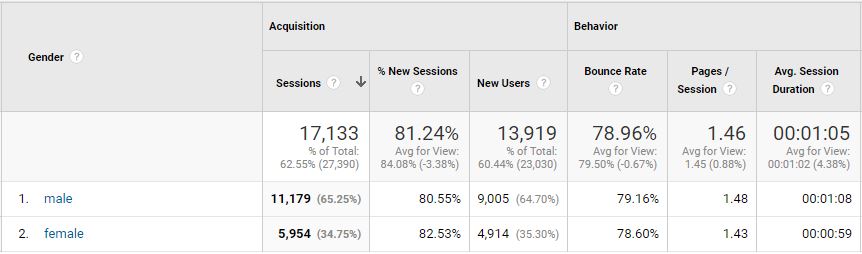
You can now easily see if your site is better at retaining one gender over the other.
Gender targeting with tactics such as different language and colors can impact viewing and purchasing behavior.
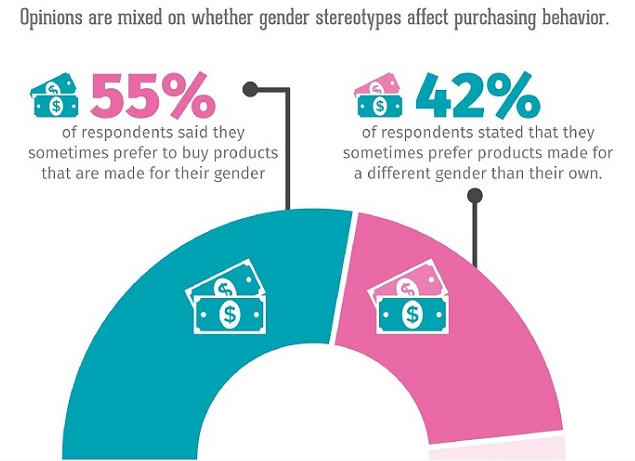
If you have a higher bounce rate with one gender, make sure you’re not accidentally creating the perception that you’re only targeting the other sex.
Segment by affinity
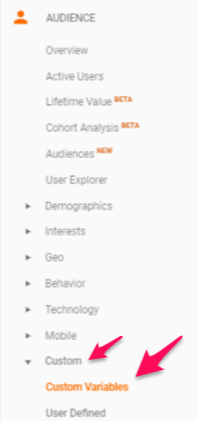
The next option in the “Audience” section is under “Interests” and then “Affinity Categories.”
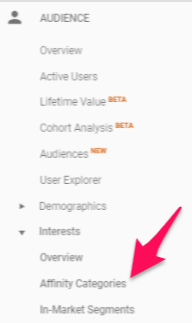
This groups bounce rate based on visitor interests.
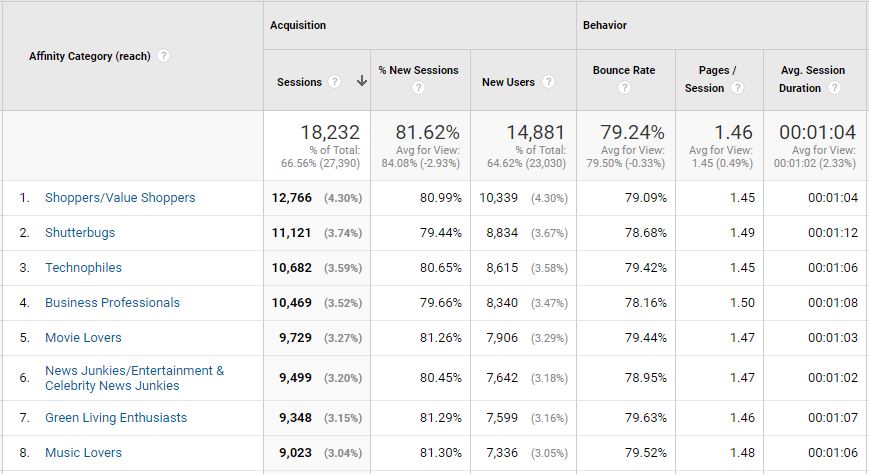
Check out which affinity categories have the highest bounce rates to see if you’re losing out on key marketing groups.
You can see in the example above that this site is engaging best with business professionals and shutterbugs.
Engagement with music lovers, movie lovers, and green living enthusiasts is the poorest.
This knowledge can now help you better target those groups with your imagery and content.
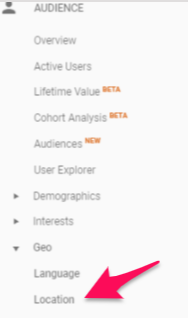
Segment by location
Still in “Audience,” just under “Interests,” you’ll find the “Geo” section. Within that, you can click on “Location” for another segment report.
First, you’ll see a color-coded map that shows you where most of your visitors come from.
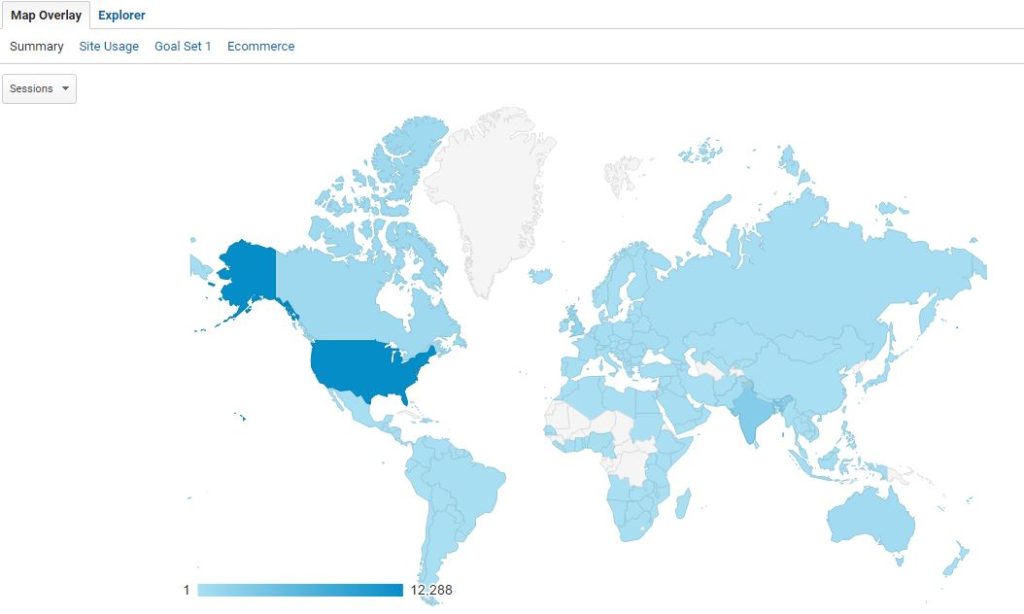
Below that, you’ll see the table version breaking down your visitors by geographic region.
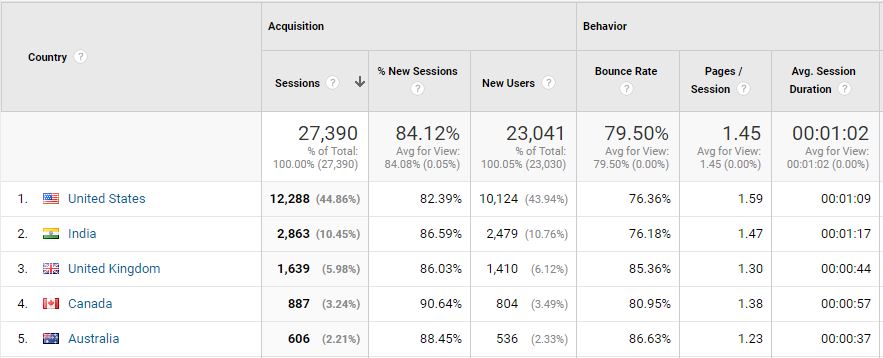
This gives you your bounce rate by country.
In the example above, you can see that Australia and the UK have much higher bounce rates than the other countries.
You can drill further into it to see if there are certain provinces that are engaging worse than others. Then, you can adapt your marketing strategy to target areas where you want to see improvement.
Segment for new visitors
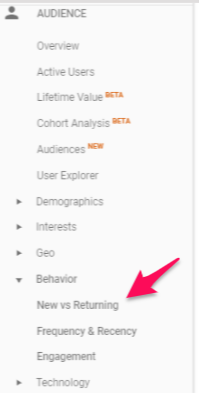
A good segment to check out is the “New Vs. Returning” breakdown. It’s also in the “Audience” section under “Behavior.”
Now you can see if your new visitors are bouncing at a higher rate than your returning visitors.
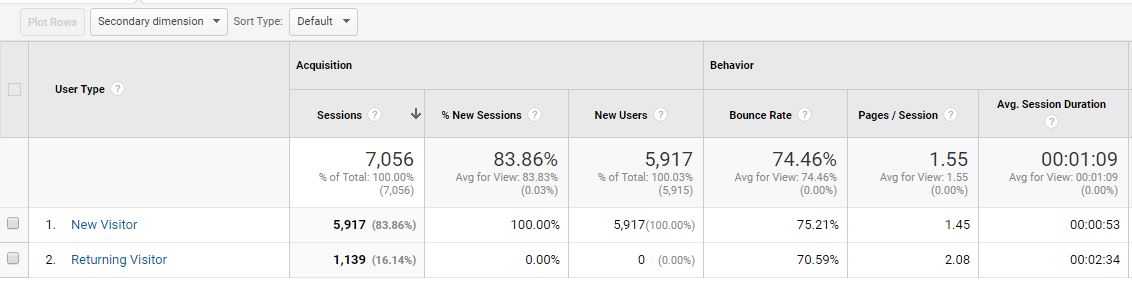
I would expect your new visitors to have a higher rate.
So, to get more value out of this segment, you can view the acquisition source as a secondary dimension.
Just click on the “Secondary Dimension” drop-down list at the top of the table and select “Source” from the list that appears below.
We’ll talk more about acquisition in a minute.
Segment by browser
The browser breakdown report is a good way to see if you have any technical issues that are causing your visitors to bounce.
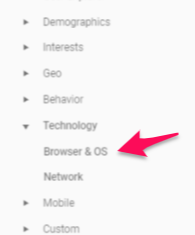
In the “Audience” section under “Technology,” select “Browser & OS.”
The report should look like this:
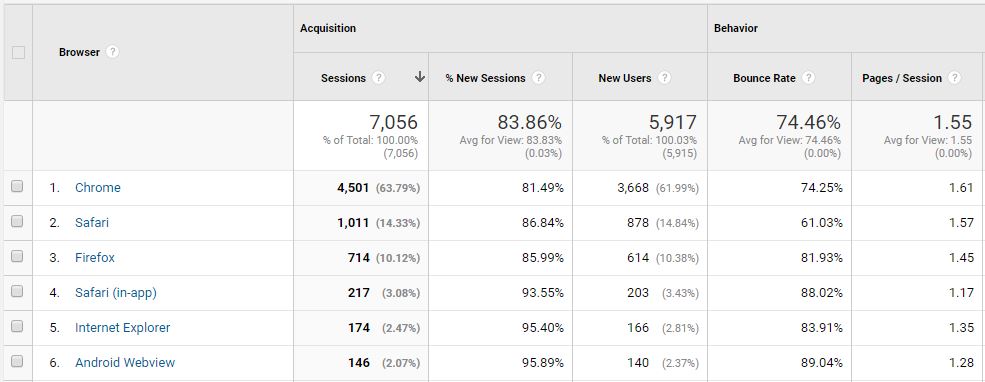
If one browser has a higher bounce rate than the others, that might indicate that you haven’t configured your site well for that browser.
You also need to consider versions of browsers. For example, don’t just check Internet Explorer. Check across versions 8.0, 9.0, and 11.0.
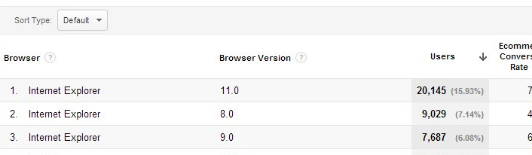
If one has a noticeably higher bounce rate, your site might have bugs or UX issues with that browser.
Even if it’s an outdated browser, you will want to fix the issue if the browser is still bringing you traffic.
Segment by device
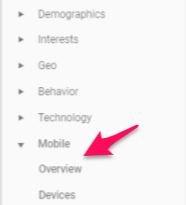
Underneath the “Technology” section, you can find the “Mobile” section. Select “Overview” to see your bounce rate across devices.
This will give you a bounce rate comparison between desktop, mobile, and tablet.
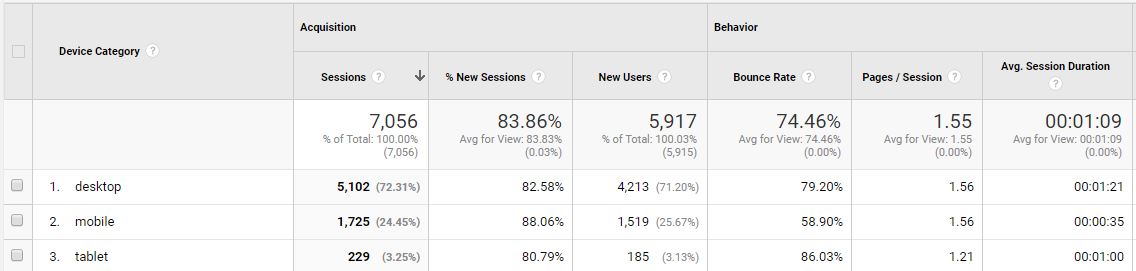
If you find out that your bounce rate is significantly higher on mobile or tablet, it may indicate that you haven’t properly optimized your site for those devices.
You can also view the “Devices” report. This further breaks it down by mobile brand and operating system.
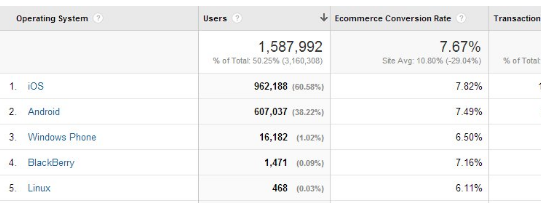
If you find, for example, that Apple users are bouncing at a higher rate than Android users, you might have some design issues.
Pay attention to individual device models as well.
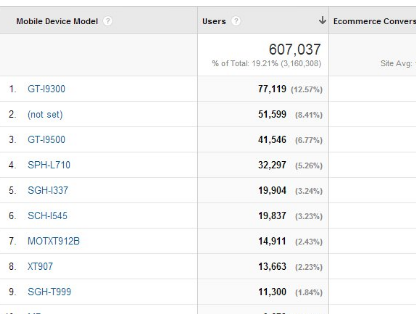
Focus on trends and device release dates. For example, you might discover that your bounce rate is fine for Apple devices in general, but it’s too high for the latest models.
This may indicate that your website isn’t compatible with the newest Apple OS.
Segment by acquisition
Now, let’s look at segmentation by acquisition rather than by audience.
Go to “Acquisition,” then “All Traffic,” and then “Source/Medium” in the left-hand menu.
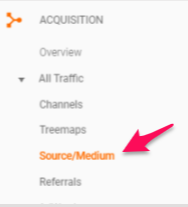
The table at the bottom of your screen should look like this.
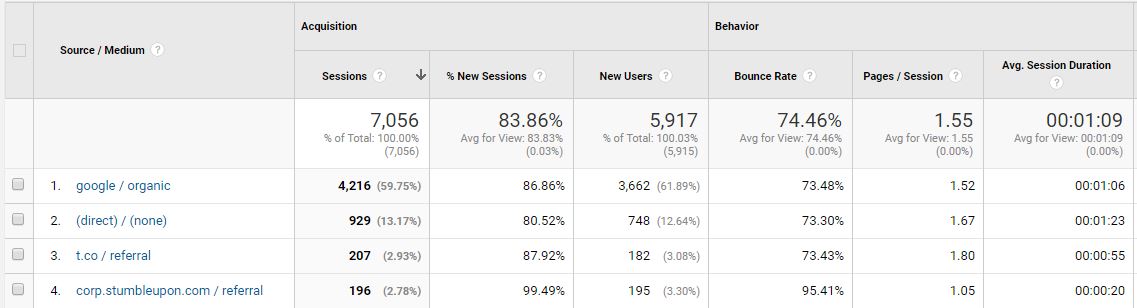
It will show you a breakdown of where all of your traffic is coming from and the associated bounce rates.
Take a look at the sources that have the highest bounce rates to see if there’s a trend.
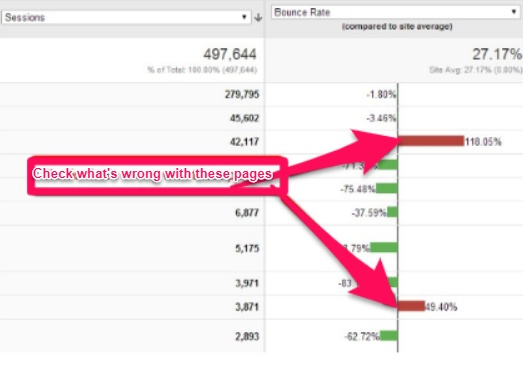
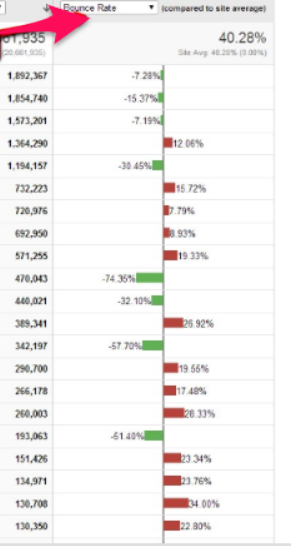
Here’s an example where you can see that the paid advertising campaigns have a much higher bounce rate:
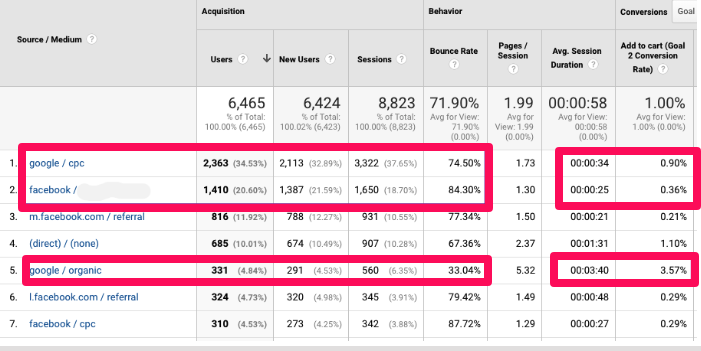
Either your advertising targeting is too broad, or your landing pages are not lining up very well with your ads, resulting in a higher bounce rate.
Segment by landing page
The final option we’ll discuss is segmentation by landing pages.
In the left-hand menu under “Behavior,” click on “Site Content” and then “Landing Pages.”
The resulting table shows you a breakdown of your landing pages and their average bounce rates.
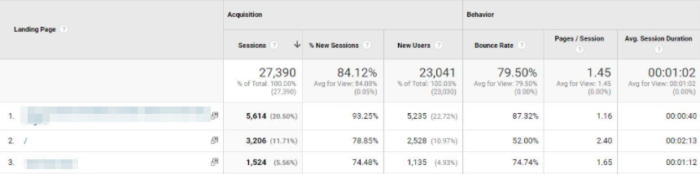
You might find that one page has a much higher bounce rate than the others.
Visit that page and look for any design problems or issues that might be making it less effective than the others.
Make sure you haven’t forgotten any key steps to optimize your landing pages for conversions.
Now that you know the different ways that you can segment your site traffic, I’ll show you how you can create adjusted bounce rates.
You can adjust what Google Analytics considers an interaction. This will directly impact your bounce rate.
For example, you might feel that a visitor has interacted on your site if they watched a video.
In Google Analytics, you have the option to set an event like playing a video, clicking a button, or completing a download as an interaction.
Then, users who complete these “events” will no longer count toward your bounce rate.
However, you need to careful with this. Make sure that automated events don’t skew your results.
If you’ve set up your videos to play automatically, you need don’t want to count video views as interactions.
The simple way to modify how Google records interactions is by sending events into your Google Analytics that tell you when a user spends a certain amount of time on a page, scrolls through a certain percentage of a page, or sees a specific element a the page.
You can send events from Google Tag Manager:
1. Adjust your bounce rate through scroll percentage events
The “Scroll Depth” trigger allows you to create custom events based on how far a visitor scrolls down a page.
First, you need to create a new tag.
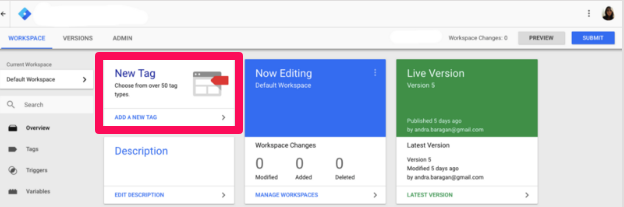
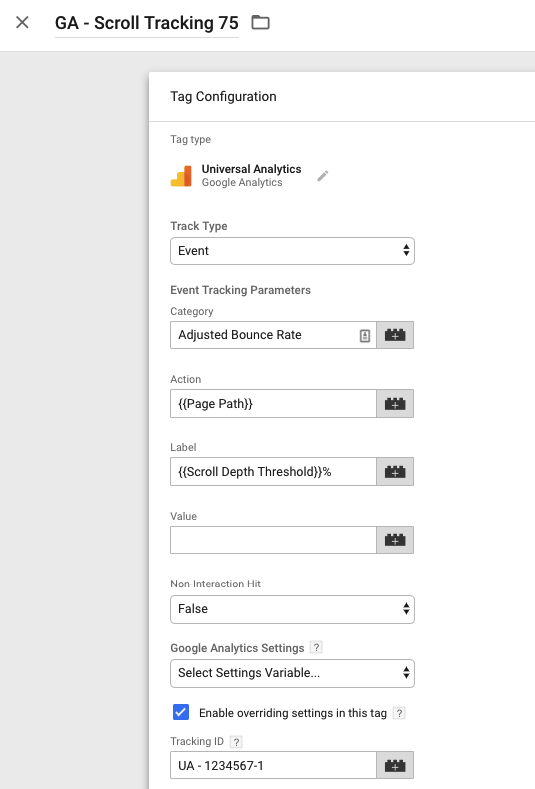
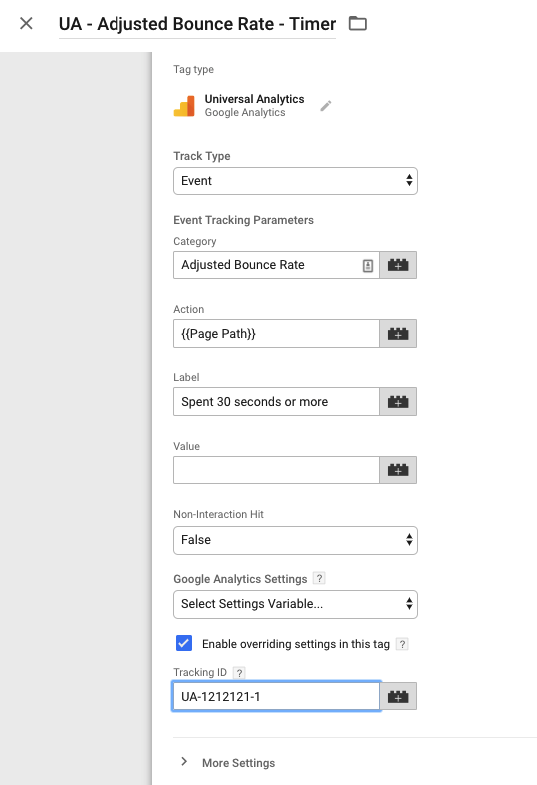
Then, name your tag, select “Universal Analytics” for tag type and choose “Event” for the track type.
Next, you need to type in the event category and event action.
To get the action, simply click the small plus sign beside the field and select “Page Path.”
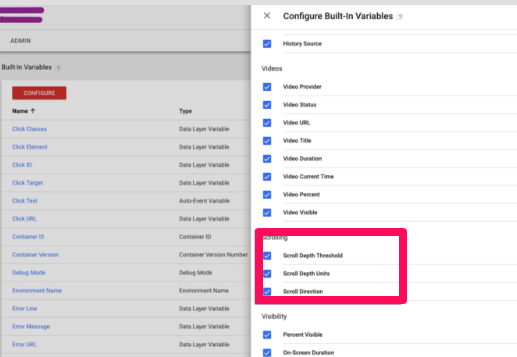
For the event label, pick “Scroll Depth Threshold.”
If you don’t see this option available, go to your “Built-In Variables” screen and enable the scrolling variables:
Now, select “Non-interaction Event” as “False,” and add in your UA tracking ID .
If you’ve completed all of those fields, it should look like this:
For this tag, I recommend setting the scroll to 75% of the page. That means that Google will consider a visitor to have interacted on your site if they scroll 75% of the way through the page.
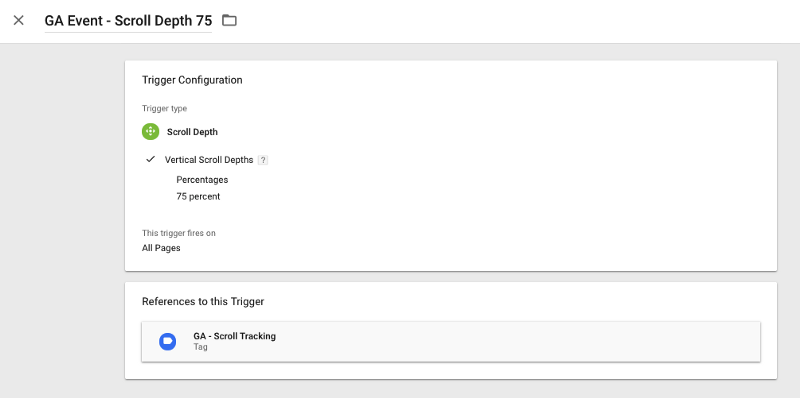
Make sure you’ve selected “Scroll Depth” as the trigger type. Then, in percentages, put down “75 percent”.
Once done, you can save, preview, debug, and then publish.
2. Adjust your bounce rate through the timer function
You can also decide that Google should consider a visitor to have interacted on a page if they spend a minimum amount of time on it.
Create a new tag and give it a name, such as “UA — Adjusted Bounce Rate — Timer.”
You can choose the length of time that you want to start with. I suggest trying 30 seconds.
To do this, add a new trigger and name it “Timer — 30 seconds”.
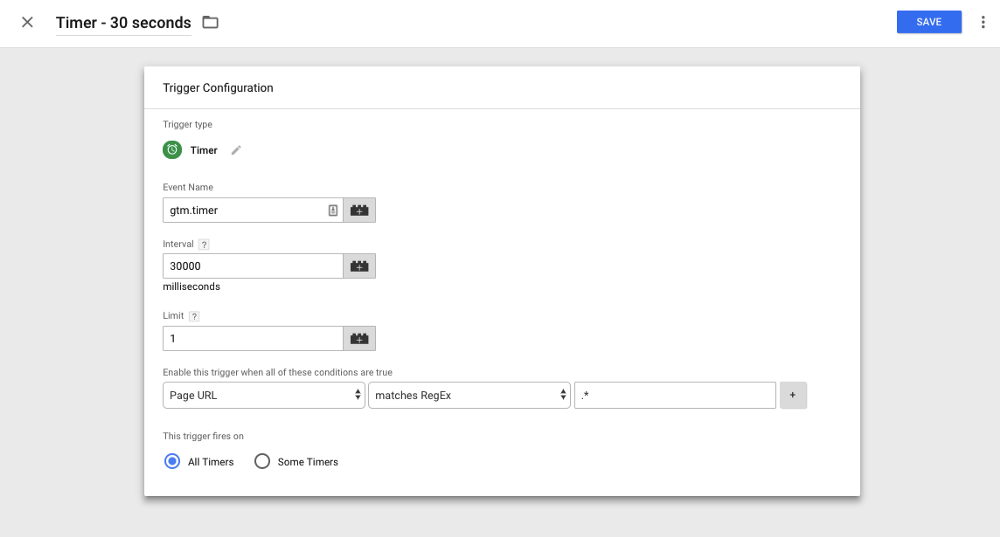
The interval is in milliseconds. So, for 30 seconds, you need to put enter “30000.”
Select a limit of one. Then, in the conditions section, set it for “Page URL matches RegEx*.”
This will make it so that Google Analytics includes all of your pages in the tracking.
Make sure you save, preview, and debug before publishing.
Other methods for decreasing bounce rate
Here are some more ways to see where visitors are bouncing and how you can use that information to boost conversions.
Review top exit pages
Another report you should check out is your top exit page report.
You can find it right below the landing pages report in the left-hand menu.
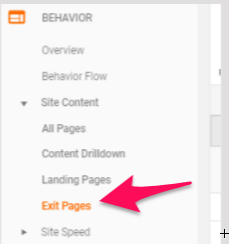
This report will show you which pages people most often abandon your website from.
Take a look at your top traffic pages and compare your bounce rate and your exit rate.
This will show you who’s landing directly on that page and bouncing versus who’s arriving there from an internal link and exiting.
It can help you narrow down where you should spend your time testing and making improvements on your site.
Review in-page analytics
Another great report within Google Analytics is the in-page analytics report.
This is only available now via a Chrome plugin, but it is still very useful.
As you can see below, the report allows you to see the click-through rate for every link on a web page. 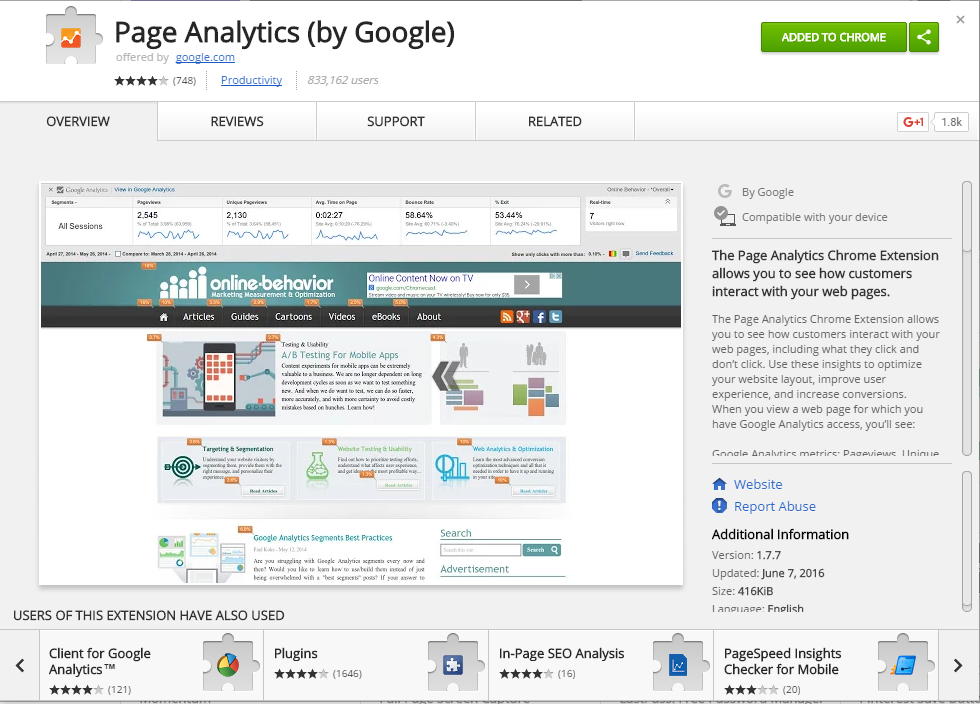
This is a great way to evaluate a landing page, but it can be useful for any content on your site, including your homepage.
It will allow you to see which links in your content people are clicking on and which ones they skip right over.
This will help you determine which anchor texts you should reword or which calls-to-action you need to improve.
View Page Timings
Your pages may have high abandonment because they’re too slow.
You can check this with the Page Timings report.
In the “Behavior” section of the left-hand menu, click “Site Speed” and then “Page Timings.”
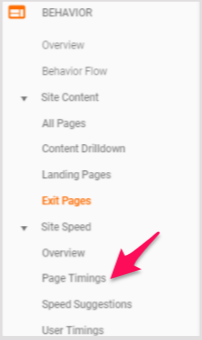
The report will tell you how fast each page on your site is loading.
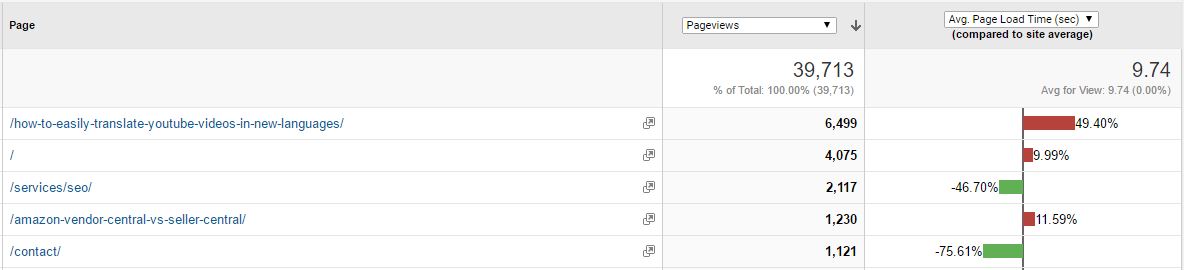
You can sort by number of page views and average page speed. That way, you can start improving your pages with the highest traffic yet slowest load times first.
It also shows you your overall site average speed.
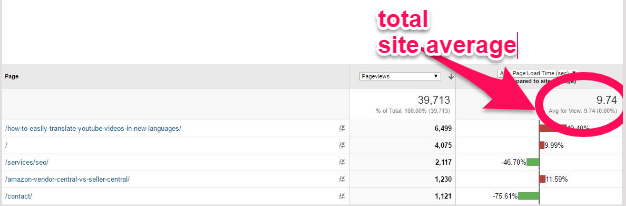
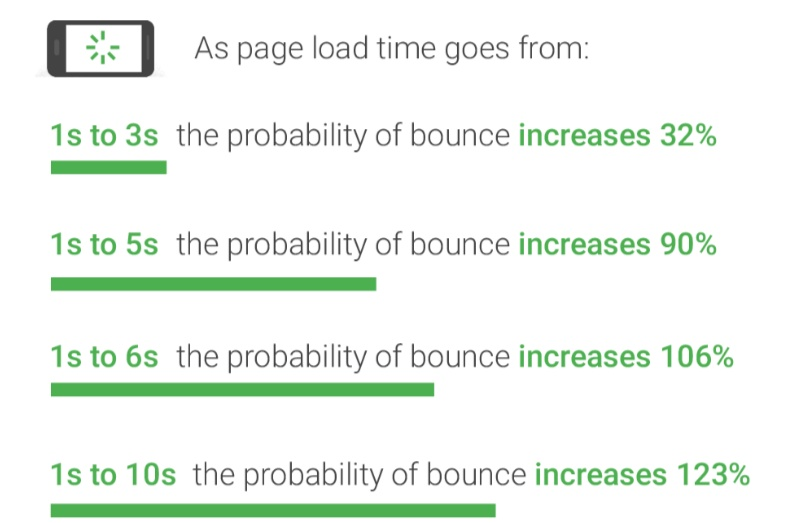
In light of Google’s Speed Update that’s coming in July, site speed is becoming increasingly important. But even apart from that, it’s critical for improving bounce rates.
For example, the average page speed above means that our bounce rate is 123% higher than it could be.
Google Analytics Site Speed reports
You can check out the other Site Speed reports for further analysis and options for improving your site speed.
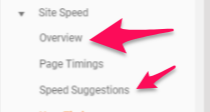
The Speed Suggestions report will not only indicate potential issues but also give you useful advice on how to resolve them, such as prioritizing visible content.
Utilize A/B testing
Throughout all of these report checks, you are hopefully pinpointing some specific areas you need to target for improvements.
It’s difficult to guarantee which changes will improve your bounce rate the most.
For instance, you may have identified a weak landing page. But what do you need to do to improve it?
Do you need to make it longer? Do you need a different call-to-action? What will increase your conversion rate?
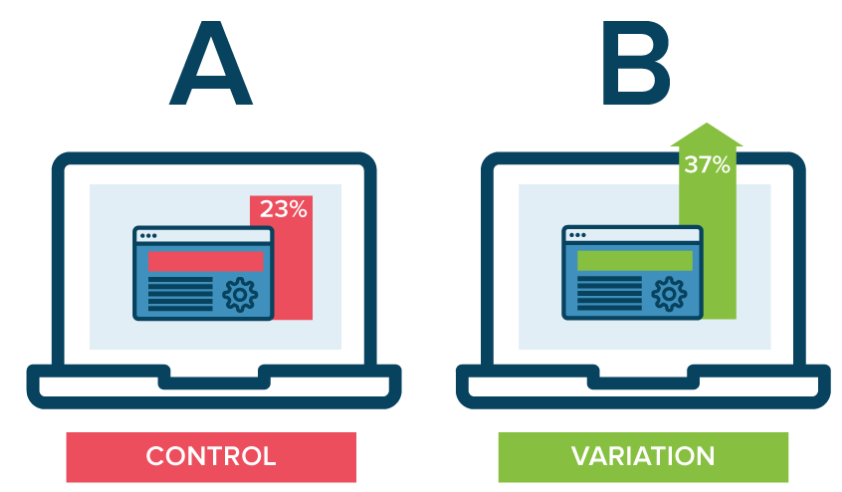
A/B testing is a great way to test your improvement strategies.
It allows you to test things like different call-to-action wording, different landing page designs, and different target audiences.
A/B testing will make it easy to see what’s working and what isn’t since it allows you to show one version of your website to half of your visitors and another version to the other half.
Just make sure you set a clear goal for your testing and follow the correct steps.
To better understand your A/B test results, you can also use a significance calculator.
Make your pages easy to read
It’s easy to forget such a simple aspect of your pages, but readability is important.
There are lots of free tools that allow you to check the readability of your content and your website like the Yoast plugin for WordPress.
Be mindful of your font size and type, your sentence and paragraph length, and the amount of white space on the page.
Use subheadings and break your content up into chunks.
Also, consider other elements on your page that might be distracting like your color choices and ad placements.
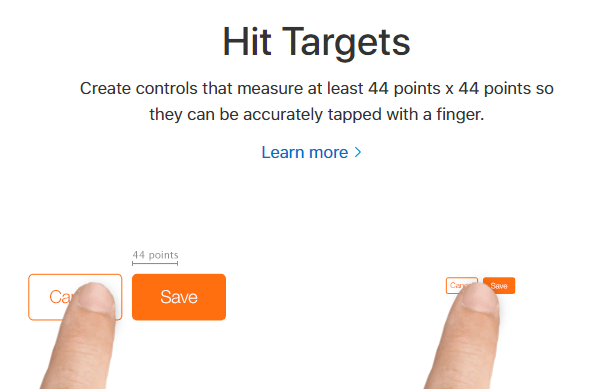
Include clear CTAs and consider their placements
A great way to get people to engage and convert is by using compelling calls-to-action.
A call-to-action should compel someone to do something such as sign up for a newsletter or purchase a product.
There are many ways to improve your call-to-action buttons. Consider your copy, color, button size, placement on the page, and so much more.

Apple suggests making sure that all CTA buttons are at least 44 pixels tall.
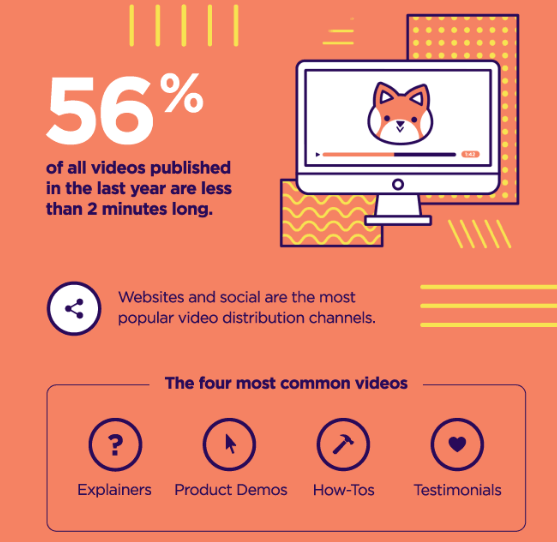
Use videos and images to engage your audience
Humans are visual creatures.
We love imagery. We also retain it better.
If you hear something or read something, the chances are good that you’ll only remember 10% of it three days later. However, if you see a picture, you’re likely to remember 65% of it.
Adding images and videos is a great way to get your audience engaged with your content.
Short, catchy videos are increasing in popularity, and they can boost engagement.
Infographics are also effective at drawing your visitors in.
In fact, over 41% of marketers said that infographics were their most engaging form of visual content.
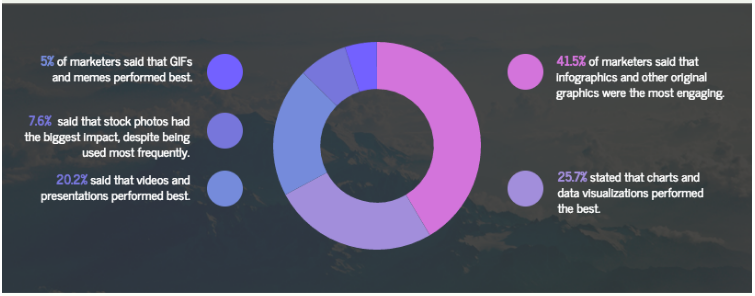
If you find that your audience isn’t engaging with a certain page, you may simply need to add more images, videos, and infographics.
Offer live chat support
Live chat is the fastest method for offering customer service support.
If people come to your page and don’t immediately find exactly what they want, live chat can help engage them before they give up and try the next site.
There are lots platforms out there today that can help you set up live chat services, such as Intercom.
Live chat is one of the best tools you can implement on your website this year to decrease bounce and boost conversions.
Conclusion
Analyzing and improving your bounce rate can be intimidating.
But improving your bounce rate means a more engaged audience and more conversions.
If you follow the steps I’ve outlined in this post, you should see your bounce rate decrease in no time.
First, understand what a “good” bounce rate really is and narrow down your analysis to pinpoint exactly what your bounce rate metrics are telling you.
Remember that a site-wide bounce rate is simply a vanity metric. It’s too broad to provide actionable information.
Focus on the different segment reports and your other analytics tools to dive into the data.
Check out your top exit pages, page timings, and speed reports to understand what might be causing your bounce rates to be high.
To help people engage with your content, be sure to improve your site’s readability, add imagery, optimize your CTAs, and use live chat.
Do some A/B testing to see what works best for you and your audience.
Monitor your reports with each change to see where and how you’re improving
Remember: There is no magic number that you’re trying to hit.
The goal is to simply keep improving and offering your customers a better, more engaging experience.
What tools and tricks do you use to monitor and improve your bounce rate?
Comments (90)